Preface
The retail industry is a highly competitive, fast-paced industry which shows steady growth year after year. In an increasingly competitive landscape, retail industry players must compete in several ways. These days, consumers want first-rate customer service and an integrated shopping experience that seamlessly combines all the benefits of traditional shopping with the convenience of using modern technology. The rise in omnichannel retailing is a confirmation of this transformation. Although omnichannel retailing and digital shopping are leading retail trends and are cited as one of the disruptors, 90% of retail sales are still happening where sales have taken place for hundreds of years: in the physical stores. This hypothesis was recently confirmed by the results of a survey conducted by consulting firm A.T. Kearney. This news may comfort some traditional retailers, but they have to deal with a different set of challenges such as picking the best sites for stores, determining the optimal number of locations for each market, keeping up with consumer expectations of what the in-store experience should be, getting better at e-commerce strategies, etc.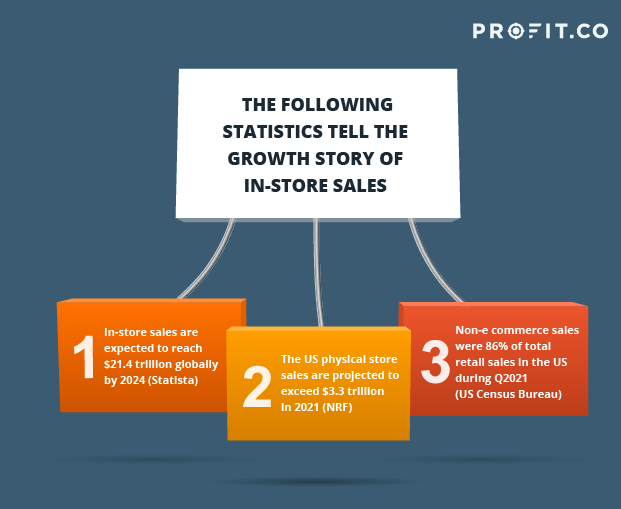
Role of OKRs in store operations
So, what can traditional retailers do differently to keep up with these BAU (Business As Usual) challenges? What else can be much better to have OKRs (Objectives & Key Results) drive your store ops metrics? While OKRs are primarily cited for strategy execution, will OKR fit the bill to operationalize the execution? Among these common questions, the million dollar question is “Do I need OKRs when I have KPIs in place already?” It is very common to confuse OKRs with KPIs, especially when managing the metrics of store operations and for running the BAU activities. “While there are similarities, OKRs and KPIs are not interchangeable,” says Jon Knisley, Principal for automation and process excellence at FortressIQ. “KPIs provide a measurable assessment of performance. They are descriptive and tend to look backward. OKRs are also measurable and timeboxed, but since they tend to be more aspirational, OKRs provide a more strategic view of what’s ahead.” Having said that, KPIs focus on outputs while OKRs focus on outcomes that are meant to help in achieving the KPI targets. One example would be a KPI to measure sales per employee, which can be calculated by dividing the Net Sales by the Number of Employees. The outcome attached to this KPI would be improving the sales per employee. OKRs can help to achieve this outcome by defining key results to help each associate sell more products, create an incentive system to motivate employees, provide relevant sales training, etc. Below, the OKR consultants at Profit.co have shared their insights on how to align retail store operations with OKRs, handle execution challenges, and make the store operations more efficient. Let’s take a look at these insights through the lens of a store manager.OKRs for driving store ops
A store manager is responsible for overseeing the daily operations of a store and making sure it runs smoothly and effectively. Their duties include motivating sales teams, creating business strategies, driving store sales, increasing profitability, as well as creating store policies and marketing programs that will increase sales and grow the existing customer base. The store manager needs to be versatile enough to maintain high store standards and conditions, foster a positive environment, ensure customer needs are met, resolve complaints with quick and efficient service, and ensure all products and displays are merchandised effectively to maximize sales and profitability.The list goes on and on. Although store operational KPIs help to measure the store performance data, OKRs can be used to create outcome-focused goals informed by those KPIs. Some sample OKRs that can be considered are:
| Objective | Improve the store sales |
|---|---|
| Key Result 1 | Increase comparative department/ category sales by 2% month over month |
| Key Result 2 | Increase sales per square foot from $400 to $500 |
| Key Result 3 | Increase average transaction size from $120 to $150 |
 Objective
Improve the store sales
Target Date: Annual-2022
Jan 01 – Dec 31
Visibility: All Employees
 Key Results
Increase comparative department/ category sales by 2% month over month
Increase sales per square foot from $400 to $500

Increase average transaction size from $120 to $150

| Objective | Improve the store performance |
|---|---|
| Key Result 1 | Increase daily foot traffic from 2200 to 2500 |
| Key Result 2 | Increase conversion rate of shoppers to buyers from 55% to 65% |
| Key Result 3 | Increase average basket size from 16.8 to 25 |
Objective
Improve the store performance
Target Date: Annual-2022
Jan 01 – Dec 31
Visibility: All Employees
Key Results
Increase daily foot traffic from 2200 to 2500
Increase conversion rate of shoppers to buyers from 55% to 65%
Increase average basket size from 16.8 to 25
| Objective | Make efficient use of the inventory |
|---|---|
| Key Result 1 | Improve inventory turns from 10.8 to 6.0 |
| Key Result 2 | Increase 30 day sell through rate from 40% to 50% |
| Key Result 3 | Decrease the inventory shrinkage from 5% to 2% |
Objective
Make efficient use of the inventory
Target Date: Q1-2022
Jan 01 – Mar 31
Visibility: All Employees
Key Results
Improve inventory turns from 10.8 to 6.0
Increase 30 day sell through rate from 40% to 50%
Jan 01 – Jan 31
Decrease the inventory shrinkage from 5% to 2%
| Objective | Make the store operations more efficient |
|---|---|
| Key Result 1 | Increase GMROI from $3.55 to $4.70 |
| Key Result 2 | Increase daily sales per employee from $4500 to $5200 |
| Key Result 3 | Increase the frequency of PI (Physical Inventory) checks from 1 to 2 times per quarter |
Objective
Make the store operations more efficient
Target Date: Annual-2022
Jan 01 – Dec 31
Visibility: All Employees
Key Results
Increase GMROI from $3.55 to $4.70
Increase daily sales per employee from $4500 to $5200
Increase the frequency of PI (Physical Inventory) checks from 1 to 2 times per quarter
Inventory Handling
Inventory handling duties can be a part of everyone’s job in a retail store. Handling begins with receiving shipments, which includes unpacking boxes, sorting received items, and disposing of boxes and packing materials. Store employees store new inventory items according to SOP (Standard Operating Procedure), usually following the first in, first out rule and restocking inventory on the shelves whenever it is needed. Store associates are responsible for maintaining the aesthetic appeal of inventory items in the store by straightening items after customers handle them, making sure all items are clean and free of dust, and occasionally re-organizing shelves and displays to give the store a fresh look and feel to keep customers engaged and interested while shopping.You can create an OKR to help track and improve the efficiency of in-store inventory handling.
| Objective | Improve in-store Inventory handling for a better store aesthetic |
|---|---|
| Key Result 1 | Reduce time to backfill the shelves from 12 hours to 6 hours |
| Key Result 2 | Maintain planogram compliance rate of at least 90% |
| Key Result 3 | Decrease average damages due to mishandling from 3 per day to 1 per day |
Objective
Improve in-store Inventory handling for a better store aesthetic
Target Date: Annual-2022
Jan 01 – Dec 31
Visibility: All Employees
Key Results
Reduce time to backfill the shelves from 12 hours to 6 hours
Maintain planogram compliance rate of at least 90%
Decrease average damages due to mishandling from 3 per day to 1 per day
Focus on indirect Inventory, not just what is being sold!
When talking about inventory, it is most common to think only of the products that are kept in stock to sell to customers. But, there are also inventories that you don’t intend to sell which you need to keep track of, like the store supplies (packaging materials, paper towels, toilet paper, cleaning products, etc.) or other indirect spends. It would be difficult, if not impossible, to discuss the optimization of indirect spending without mentioning Jeff Bezos’ multi-trillion-dollar eCommerce and cloud computing behemoth. Spanning the globe with millions of products, and a supply chain to match, Amazon Business manages indirect spending through bleeding-edge process optimization and automation that reduces both maverick spend and invoice fraud.It is crucial for the store operations to track the indirect inventory in order to have the operational expenses under control. With the right set of metrics, it will be possible to identify more cost-saving opportunities. Here is an OKR to help better manage and optimize these opportunities:
| Objective | Keep track of indirect inventory to optimize maverick spend |
|---|---|
| Key Result 1 | Reduce monthly maverick spend from $750k to $500k |
| Key Result 2 | Decrease losses made due to invoice fraud from $300k to $100k |
| Key Result 3 | Increase cost avoidance opportunity ideas implemented/month from 2 to 4 |
Objective
Keep track of indirect inventory to optimize maverick spend
Target Date: Annual-2022
Jan 01 – Dec 31
Visibility: All Employees
Key Results
Reduce monthly maverick spend from $750k to $500k
Decrease losses made due to invoice fraud from $300k to $100k
Increase cost avoidance opportunity ideas implemented/month from 2 to 4
Optimize slow-moving stock
Slow-moving inventory is defined by overstocked items, low turnover rates, and infrequent shipment of merchandise. An increased amount of slow-moving inventory indicates that the company is not very efficient in managing its inventory. A high percentage of slow-moving stock also reflects slow sales and potential financial trouble.The inactivity of these products contribute to wasted capital and resources in the form of carrying costs and opportunity costs. Some recommendations on managing this indicator include:
- Identifying and cataloging inventory items with low turnover rates
- Refining service level agreements with slow-moving stock
- Evaluating the costs associated with slow-moving inventory
- Using KPIs to measure and assess stock turns
Align the inventory initiatives and KPIs with OKRs to optimize or get rid of the slow moving inventory.
| Objective | Optimize slow moving stock |
|---|---|
| Key Result 1 | Maintain the customer service level at less than 50% for slow moving items |
| Key Result 2 | Reduce the tail SKUs from 80% to 40% |
| Key Result 3 | Liquidate 75% of slow moving items |
Objective
Optimize slow moving stock
Target Date: Annual-2022
Jan 01 – Dec 31
Visibility: All Employees
Key Results
Maintain the customer service level at less than 50% for slow moving items
Reduce the tail SKUs from 80% to 40%
Liquidate 75% of slow moving items
Pay attention to the customers
This is extremely important in retail operations: always attend to every customer’s needs and provide amazing customer service. Increasing customer satisfaction even by a little bit can result in loyal customers that keep consistently buying from the retailers. Train the employees to be alert at all times and to be sensitive to the customer’s problems.The success of customer management is not just to keep your customers coming back but to make them happy to spread the word about your business.
| Objective | Provide amazing customer service |
|---|---|
| Key Result 1 | Launch customer loyalty beta program by Q4 |
| Key Result 2 | Reduce time for returns/ refunds from 30 mins to 5 mins |
| Key Result 3 | Increase NPS score from 3.8 to 4.5 |
| Key Result 4 | Increase number of referral signups per month from 350 to 500 |
Objective
Provide amazing customer service
Target Date: Annual-2022
Jan 01 – Dec 31
Visibility: All Employees
Key Results
Launch customer loyalty beta program by Q4
Reduce time for returns/ refunds from 30 mins to 5 mins
Increase NPS score from 3.8 to 4.5
Increase number of referral signups per month from 350 to 500
Customer Engagement – Keep the interest alive!
Creating a happy customer that is loyal to your brand requires engagement. There are various ways and metrics that can be adopted to keep track of customer engagement. A simple way to stay top-of-mind is to implement a customer loyalty program. During new product or service launches, make sure enough people know about it to keep both your regular and prospective customers interested. Share short videos via email or social media to keep your audience engaged.Take a look at this sample OKR to drive customer engagement below:
| Objective | Improve the customer engagement process |
|---|---|
| Key Result 1 | Maintain social media engagement rate at more than 4% |
| Key Result 2 | Increase the store visit frequency of existing customers from 2 to 4 times per month |
| Key Result 3 | Increase the average time spent in store from 40 mins to 60 mins |
Objective
Improve the customer engagement process
Target Date: Annual-2022
Jan 01 – Dec 31
Visibility: All Employees
Key Results
Maintain social media engagement rate at more than 4%
Increase the store visit frequency of existing customers from 2 to 4 times per month
Increase the average time spent in store from 40 mins to 60 mins
Keep store employees motivated!
Technology is more important than ever, not just for managing employees but for enabling them. It is increasingly difficult for a store employee to do their job without technology. Between online orders coming into the store for pickup or shipping, online returns coming to stores to be processed for credit to the consumer, or the increasing role of online influencer while in the store — as companies like Nordstrom introduce live streaming in stores to reach online shoppers— the traditional role of the store employee as someone just ringing cash and carry sales is over.Despite the technology enhancements and aesthetics in stores, it is still the store’s employees that turn shoppers into loyal repetitive customers through excellent customer service. It is important for them to have good product knowledge. Train them on new products and services regularly so that they stay up-to-date. Reward them with sales incentives to keep them happy and motivated. For example, you can run sales contests for achieving 75% of quota within the first 15 days of the month – the winner gets a gift card.
| Objective | Keep store employees motivated |
|---|---|
| Key Result 1 | Increase monthly training hours from 4 to 6 |
| Key Result 2 | Launch “Star Employee of the month” program by Q4 |
| Key Result 3 | Increase SPLH (Sales revenue Per Labor Hour) from $95.50 to $100 |
Objective
Keep store employees motivated
Target Date: Annual-2022
Jan 01 – Dec 31
Visibility: All Employees
Key Results
Increase monthly training hours from 4 to 6
Launch “Star Employee of the month” program by Q4
Increase SPLH (Sales revenue Per Labor Hour) from $95.50 to $100