Introduction
No organization achieves 100% efficiency in its business processes; only 4% of businesses monitor their processes. When faced with low productivity or poor customer satisfaction, one way to diagnose your business processes is to use a fishbone diagram. This tool helps you brainstorm the possible causes and effects of your process problems.
Read this comprehensive guide to understand the fishbone diagram and its uses in the business.
In this Guide, you will find
- What Is A Fishbone Diagram?
- When Should You Use A Fishbone Diagram?
- Why Should You Use A Fishbone Diagram?
- Fishbone Diagram Examples
- Basics of Fishbone Diagram
- How To Create A Fishbone Diagram?
What Is A Fishbone Diagram?
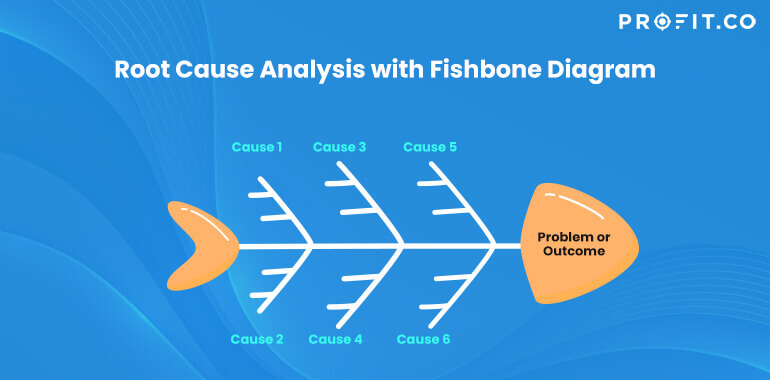
A fishbone diagram is a tool that identifies the root causes of any given outcome. It’s also called a cause and effect diagram or Ishikawa diagram. It resembles a fish’s bone structure, with the problem or result at the head, and causes branching out like bones along its spine. You can create a fishbone diagram using a spreadsheet, document, or drawing app. You can also download a fishbone diagram PDF or find templates for your root cause analysis.
When Should You Use A Fishbone Diagram?
Out of all root cause analysis tools, a fishbone diagram works best when you want to get to the heart of a problem. Use this tool in the following scenarios:
When you’re analyzing a complex challenge with numerous possible causes
When identifying bottlenecks that cause a process to fail
When you need a fresh point of view to evaluate a problem
When you need a creative or innovative approach to solving a problem
When you need to stimulate a brainstorming session that’s stuck in a rut
Why Should You Use A Fishbone Diagram?
A fishbone diagram helps visualize a process’s causes and effects in a drawing or graphic manner. Therefore, it’s a great tool if your team brainstorms better with structured diagrams, such as mind mapping and flowcharts.
Note: You can use a fishbone diagram to investigate a positive or desirable outcome. It’s an effective way to break down a process into repeatable steps to recreate positive results.

“We cannot solve our problems with the same thinking we used when we created them.”
Fishbone Diagram Examples
A fishbone diagram has numerous applications across industries, from manufacturing to retail, healthcare, logistics, construction, and more. Here are some fishbone diagram examples in problem-solving:
- Online Shopping Delivery
If a customer receives a damaged product from an online retailer, there are numerous potential causes for this outcome. These include poor packaging, lousy weather during transportation, mishandling at the warehouse, or disorderly packing in the delivery vehicle. Use a fishbone diagram to trace the problem and ultimately improve customer satisfaction.
- Restaurant Service
Another example is when a restaurant receives a bad review from a customer. Let’s say the customer complained about food poisoning after dining at the establishment. In that case, use a fishbone diagram to outline the food preparation process, from acquiring the ingredients to serving the customer.
Some potential causes of food poisoning include poor ingredients packaging, a power outage affecting refrigeration, untrained staff, poor kitchen hygiene, etc.
- Care Home Accidents
An elder care home must prioritize its residents’ safety to minimize injuries and poor health outcomes. Let’s say a resident falls in the bathroom at night and fractures their hip. The facility can use a fishbone diagram to understand what happened and avoid future incidents. The root cause analysis may reveal poorly maintained bathrooms, understaffing, lack of training for care aides, unsuitable mobility tools like walkers or grab bars, etc.
Basics of Fishbone Diagram
With these fishbone diagram examples in mind, let’s consider the essential components of a fishbone diagram, the 6Ms, and 5 Whys.
The 6Ms Of Fishbone Diagram
The 6Ms of a fishbone diagram are the factors that contribute to the outcome that you’re analyzing. These factors are manpower, machines, method, materials, Mother Nature, and measurements.
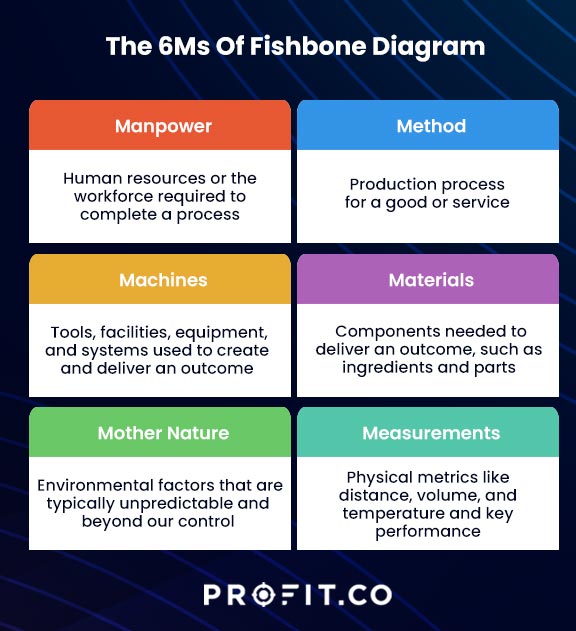
- Manpower
This refers to human resources or the workforce required to complete a process. A poor outcome may link to the workforce if your root cause analysis tools reveal the following:
- Lack of training
- Low employee motivation
- Toxic corporate culture
- Micromanagement
- Poor communication, etc.
- Method
This refers to the production process for a good or service. Challenges in the method include:
- Red tape
- Legacy processes
- Resistance to change
- Compliance regulations, etc.
- Machines
This refers to the tools, facilities, equipment, and systems used to create and deliver an outcome. Machine challenges in root cause analysis reveal technical issues like maintenance and upgrades.
- Materials
This refers to the components needed to deliver an outcome, such as ingredients and parts. Material challenges often involve vendor mismanagement, poor inventory practices, inadequate storage, mislabelling, etc.
- Mother Nature
This refers to environmental factors that are typically unpredictable and beyond our control. These include floods, heat waves, earthquakes, fires, or natural events your business can’t anticipate.
- Measurements
This refers to physical metrics like distance, volume, and temperature and key performance metrics like leads, sales, margins, and other business data. A root cause analysis of your measurements can reveal inconsistencies that keep you from streamlining your processes for repeatable positive outcomes.
Note: The 6Ms form the main framework for your analysis, but you can add or remove any element to suit your context.
Book a free demo with our team to learn more about how OKR software can optimize your organization’s performance!
Fishbone Diagram and the 5 whys
One of the most effective root cause analysis tools that work well with a fishbone diagram is the 5 Whys. This technique breaks down each of the 6Ms explained above to analyze each case in greater detail. The 5 Whys means asking “why?” five times to find the reasons behind each problem. Consider the example below:
Main outcome: Product returned by an unhappy customer
Cause: The product didn’t match the description (Measurements)
- Why (1): The images misrepresented the product’s dimensions.
- Why (2): The graphic designer distorted the image to fit the catalog’s template.
- Why (3): The designer had hundreds of other products to update and took a shortcut.
- Why (4): The designer fell ill, slowing down their productivity.
- Why (5): The designer’s request for an assistant is pending in HR.
Using this approach, you can flesh out your fishbone diagram with the root causes of your outcomes. You end up with a comprehensive analysis and insights into your business processes, which you can use for strategic planning.
Advantages and Disadvantages of a Fishbone Diagram
Some benefits of using a fishbone diagram include the following:
- It encourages broad thinking and creative problem-solving
- It keeps the team focused on each cause and effect
- It reveals the problems to avoid and solutions to prioritize
- It can serve as a proactive process management tool to identify loopholes and mitigate risk
Some drawbacks to using a fishbone diagram
- It can be a messy, confusing diagram if analyzing a complex process
- It requires you to sift the relevant from irrelevant causes, which may be time-consuming
- It can overwhelm your team if it reveals numerous causes that you need to fix
- It requires continuous testing to ensure that the solutions don’t lead to more problems
How to:
How To Create A Fishbone Diagram
Build a fishbone diagram using these four easy steps:
- Determine the primary process outcome to analyze and the relevant 6Ms.
- Write the outcome on one side of your page or whiteboard as the fish’s head, then draw a line towards the opposite side to serve as the backbone.
- Draw six lines (three above and three below) connecting to the backbone, leaving enough space for the 5 Whys answers.
- To build the fish’s skeleton, fill out the 6Ms as the main problem’s causes and the 5 Whys as the sub-causes.
Fishbone Diagram Tips and Best Practices
Here are some expert tips for creating and using a fishbone diagram effectively:
- Use a flip chart, dry-erase board, and sticky notes to fill out the fishbone diagram.
- Leave plenty of space for the 5 Whys to accommodate more insights.
- Let each brainstorming team member give one cause and one why each, working through the rounds until you exhaust all ideas.
- Gather votes for each root cause to rank them by priority.
- Consider other root cause analysis tools like failure mode and effects analysis (FMEA) or a Pareto chart if the fishbone becomes too cluttered or complex.
Conclusion
A fishbone diagram is a tool that helps you visually analyze the causes and effects of your business processes. It’s simple to create and generates fresh, innovative ideas and solutions. You can use various methods to create a fishbone diagram, such as a plain sheet of paper, a spreadsheet, a drawing app, a whiteboard, or a fishbone diagram PDF template. Use this tool to streamline your business processes and create repeatable workflows across your organization. To learn more about project management, you can get started on Profit.co completely free today!
The Real Work Begins After the Root Cause Is Found — Profit.co Helps You Execute It.
Frequently asked questions
A fishbone diagram or Ishikawa diagram is a root cause analysis tool that breaks down the causes and effects of a process outcome.
The 6Ms in a fishbone diagram are workforce, machines, method, material, Mother Nature, and measurements.
The branches on a fishbone diagram show the causal relationships between effects, that is, the reasons why the outcome occurred.
You can use a fishbone diagram to spark creative responses in a brainstorming session and to categorize ideas into actionable solutions.