The Growing Importance of Webinars in the Business World
In recent years, webinars have become an increasingly popular and effective tool for businesses to reach, engage, and communicate with their audiences. From product demonstrations to industry thought leadership, webinars provide a convenient and cost-effective way to share information and connect with customers and clients. As such, the importance of conducting effective webinars has grown significantly in the business world.
Read Along or Jump Ahead to the Section that Interests you Most
- Top 5 Key Webinar Metrics to Measure and Track for Evaluating and Tracking a Webinar
- List of 31 Top Key Webinar Metrics to Measure
- Registration and Attendance Metrics
- Cost and Revenue Metrics
- Engagement and Interaction Metrics
- Conversion and Sales Metrics
- Customer Retention and Satisfaction Metrics
- Brand Awareness and Impact Metrics
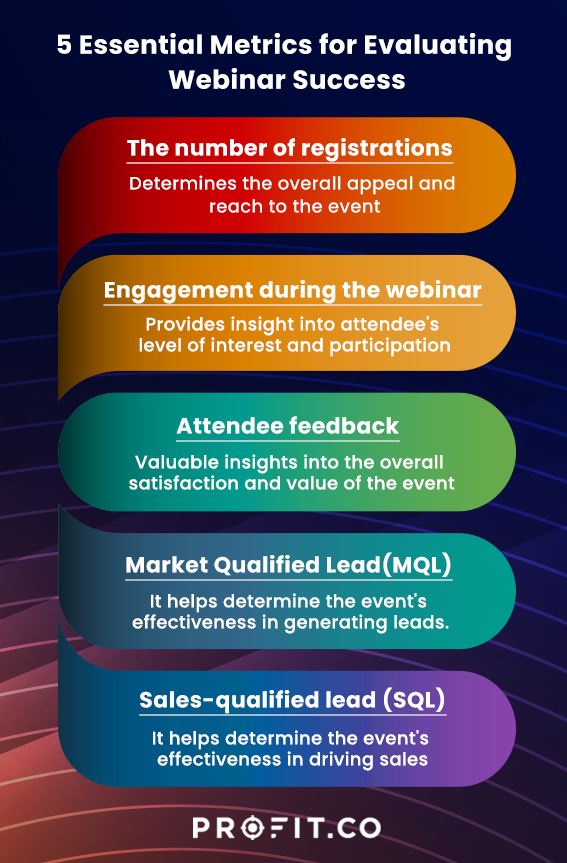
Top 5 Key Webinar Metrics to Measure and Track for Evaluating and Tracking a Webinar
- The number of registrations
Tracking the number of registrations for a webinar event is a key metric for understanding the overall appeal and reach of the event.
- Engagement during the webinar
Measuring engagement during the webinar is crucial for understanding attendees’ level of interest and participation. Elements including the number of questions asked, the number of people contributing to polls or surveys, and the overall level of involvement in the event help measure engagement.
- Attendee feedback
Gathering feedback from attendees after the webinar can provide valuable insights into the overall satisfaction and value of the event.
- Market Qualified Lead(MQL)
Tracking the number of Market Qualified Leads generated by a webinar event can provide valuable insights into the event’s effectiveness in generating leads.
- Sales Qualified Lead(SQL)
Tracking the number of Sales Qualified Leads generated by a webinar event can provide valuable insights into the event’s effectiveness in driving sales and generating leads.


List of 31 Top Key Webinar Metrics to Measure
1. Registration and attendance metrics:
1) Number of registrations
2) CTR
3) Event check-ins
4) Total registrations
5) Registration by ticket type
6) Returning attendees
2. Webinar cost and revenue:
7) Cost of the webinar
8) Gross revenue
9) Cost-to-revenue ratio
10) Revenue by promo code
11) Webinar ROI
3. Engagement and interaction:
12) Engagement during the webinar
13) Speaker engagement
14) Attendee feedback
15) Market Qualified Lead(MQL)
16) Active community members
17) Top performing topics
18) Live polling response rate
19) Social media mentions
20) Audience reactions
4. Conversion and sales:
21) Attendee to SQL – Conversion rate
22) Sales Qualified Leads (SQLs) Link
23) Pipeline generated
24) Accounts Influenced (ABM)
25) Customers acquired
26) Cost per customer acquisition
5. Customer retention and satisfaction:
27) Post-event customer retention
28) Sponsorship satisfaction
6. Brand awareness and impact:
29) Brand awareness
30) Event surveys
31) Session analytics
Webinar Registration and Attendance Metrics
Measuring a webinar event’s success goes beyond counting the number of attendees. There are a variety of metrics related to registration and attendance that can provide valuable insights into the effectiveness of your event. In this blog post, we’ll explore some key terms and how to utilize metrics to evaluate the success of your webinar.
1. Number of registrations
The number of registrations is the most obvious metric for a webinar event. It represents the total number of people who have signed up to attend the event. While a high number of registrations can be a good indicator of interest in the topic and the event itself, it’s only one piece of the puzzle. It’s possible to have many registrations but a low attendance rate if people don’t follow through.
2. CTR (Click-Through Rate)
The click-through rate (CTR) measures the effectiveness of your webinar’s marketing efforts. It represents the percentage of people who click on a link to register for the event after seeing an advertisement or promotion. A high CTR can indicate that your marketing efforts resonate with your target audience and effectively drive registrations.
3. Event Check-ins
Event check-ins refer to attendees confirming their attendance for the webinar by following a unique link or entering a code. These can help track attendance accurately and ensure that only registered attendees can access the event.
4. Total registrations
Total registrations are similar to the number of registrations, but it includes all registrations regardless of whether the person ultimately attended the event. These can be useful for tracking the overall reach of the event and understanding how many people are interested in attending.
5. Registration by ticket type
Tracking registrations by ticket type can provide valuable insights into the appeal of different pricing tiers or the effectiveness of promotional codes. For example, if you offer free and paid tickets for your webinar, you can use this metric to see which ticket type is more popular and why. Similarly, if you offer promotional codes for discounts on paid tickets, you can use this metric to see which codes are most effective in driving registrations.
6. Returning attendees
Tracking the number of returning attendees can provide insights into your webinar event’s overall satisfaction and value. If you have a high number of returning attendees, it could signify that people found the event valuable and worth attending again.
Webinar Cost and Revenue Metrics
In addition to measuring the success of a webinar event in terms of attendance and engagement, it’s also essential to consider the financial aspects of the event. Understanding the costs and revenues associated with your webinar can help you to evaluate the overall return on investment (ROI) and identify opportunities for cost savings or revenue growth. In this blog post, we’ll explore some key terms for utilizing these tools to understand the financial performance of your webinar.
7. Cost of the webinar
The webinar cost represents all the expenses incurred in organizing and hosting the event. The Webinar cost can include things like speaker fees, marketing and advertising expenses, and any other charges related to the event. Understanding the total cost of the webinar is important for calculating the ROI and determining the event’s profitability.
8. Gross revenue
Gross revenue represents the total amount of money generated by the webinar before deducting expenses. Ticket sales, sponsorships, and other revenue sources related to the event contribute to the gross revenue.
9. Cost-to-revenue ratio
The cost-to-revenue ratio measures the efficiency of the webinar event, calculated by dividing the total cost by the gross revenue. A lower ratio indicates a higher level of profitability, while a higher ratio may indicate that costs cut into the overall revenue generated by the event.
10. Revenue by promo code
Tracking revenue by promo code can help you to understand the effectiveness of different promotions and discounts. By analyzing which promo codes generate the most revenue, you can identify strategies that are most successful in driving ticket sales.
11. Webinar ROI
The return on investment (ROI) of a webinar event is a measure of the event’s profitability, calculated as the net profit divided by the cost of the webinar. A positive ROI indicates that the event was profitable, while a negative ROI indicates that the event was not profitable.
In Business, the idea of measuring what you are doing, picking the measurements that count like customer satisfaction and performance… you thrive on that.

Webinar Engagement and Interaction Metrics
One of the main goals of a webinar event is to engage and interact with attendees. Whether it’s through Q&A sessions, polls, or other interactive elements, it’s essential to measure the level of engagement and interaction during the event to ensure that it meets the audience’s needs and interests.
12. Engagement during the webinar
Measuring engagement during the webinar is crucial for understanding attendees’ level of interest and participation. Measuring the number of questions asked, the number of people who contribute to polls or surveys, and the overall level of involvement in the event.
13. Speaker engagement
In addition to measuring the engagement of attendees, it’s also essential to consider the engagement of the speakers. These elements include the number of questions asked of the speaker, the level of interaction with the audience, and the overall level of participation in the event.
14. Attendee feedback
Gathering feedback from attendees after the webinar can provide valuable insights into the overall satisfaction and value of the event. This can include ratings, reviews, and more detailed comments and evaluations.
15. Market Qualified Lead(MQL)
Tracking the number of Market Qualified Leads generated by a webinar event can provide valuable insights into the event’s effectiveness in driving sales and generating leads.
16. Active community members
For webinar events with a community or forum associated with them, tracking the number of active members can provide insights into the overall engagement and interest in the event. This can include the number of posts, the number of likes and comments, and the overall level of participation in the community.
17. Top performing topics
Tracking the popularity and engagement of different topics during the webinar can provide valuable insights into the interests and preferences of the audience. By analyzing which topics were the most popular or well-received, you can tailor future events to better meet the needs of your audience.
18. Live polling response rate
Live polling is a useful tool for measuring engagement and interaction during a webinar event. By tracking the response rate to live polls, you can get a sense of attendees’ level of participation and engagement.
19. Social media mentions
Tracking mentions of the webinar on social media platforms can provide valuable insights into the overall reach and impact of the event. By analyzing the number of mentions and the sentiment of the comments, you can get a sense of the overall perception of the event.
20. Audience reactions
Gathering audience reactions during the webinar can provide valuable insights into the overall satisfaction and value of the event. This can include ratings, reviews, and more detailed comments and evaluations.
Webinar Conversion and Sales Metrics
In addition to measuring the engagement and interaction of attendees during a webinar event, it’s also important to consider the impact of the event on sales and conversions. By tracking key metrics related to conversion and sales, you can get a sense of the overall effectiveness of the event in driving business outcomes. In this blog post, we’ll explore some of the key terms in this category and how they can be used to evaluate the success of your webinar in terms of conversion and sales.
21. Attendee to SQL – Conversion rate
The attendee to SQL (sales qualified lead) conversion rate represents the percentage of attendees who are converted to sales qualified leads after the webinar. This is a key metric for understanding the ability of the event to generate leads that are ready for the sales process.
How to measure attendee to SQL – Conversion rate
This metric is calculated by dividing the number of attendees converted to sales-qualified leads (SQLs) after the webinar by the total number of attendees. The formula is: Attendee to SQL Conversion Rate = Number of SQLs / Number of Attendees.
22. Sales Qualified Lead(SQL)
Sales-qualified leads (SQLs) are leads that have been qualified as having the potential to become customers. Tracking the number of SQLs generated by a webinar event can provide valuable insights into the effectiveness and success of the webinar.
How to calculate Sales qualified leads (SQLs)
The number of SQLs generated by a webinar event is the total number of leads that have been qualified as having the potential to become customers due to the event.
23. Pipeline generated
This metric measures the number of leads or prospects generated through your webinar that will likely result in a sale. To measure the pipeline generated, you can track the number of leads who registered for your webinar and move on to the next stage of your sales funnel, such as scheduling a demo or consultation.
24. Accounts influenced (ABM)
This metric measures the number of target accounts influenced by your webinar. If you’re using an account-based marketing (ABM) strategy, you can use this metric to gauge the success of your efforts. To measure accounts influenced, track the number of target accounts that attended your webinar, as well as any follow-up actions they take, such as scheduling a meeting with your sales team.
25. Customers acquired
This metric measures the number of new customers that resulted from your webinar. To measure customers acquired, track the number of webinar attendees who converted into paying customers within a specific time frame after the webinar.
26. Cost per customer acquisition
This metric measures the cost incurred for each new customer acquired due to your webinar. To measure cost per customer acquisition, divide the total cost of the webinar by the number of customers acquired. This metric can help you determine the ROI of your webinar, and optimize your marketing spend.
Webinar Customer Retention and Satisfaction Metrics
Ensuring customer satisfaction and retention is crucial for the success of any business, and webinar events are no exception. You can get a sense of the event’s overall impact on your customer base by tracking key metrics related to customer satisfaction and retention.
27. Post-event customer retention
Tracking customer retention after a webinar event can provide valuable insights into the overall satisfaction and value of the event. This can include the number of customers who continue to engage with the event or the business after the event, as well as the overall level of customer retention.
28. Sponsorship satisfaction
For webinar events with sponsors, tracking the sponsors’ satisfaction can provide valuable insights into the event’s overall effectiveness in meeting the sponsors’ needs. This can include ratings, reviews, and more detailed comments and evaluations.
Webinar Brand Awareness and Impact Metrics
In addition to measuring the engagement and interaction of attendees during a webinar event, it’s also important to consider the event’s impact on brand awareness and perception. By tracking key metrics related to brand awareness and impact, you can get a sense of the overall effectiveness of the event in building and promoting your brand. In this blog post, we’ll explore some of the key terms in this category and how they can be used to evaluate the success of your webinar in terms of brand awareness and impact.
29. Brand awareness
Tracking brand awareness after a webinar event can provide valuable insights into the overall reach and impact of the event. This can include the number of people aware of the brand as a result of the event and the overall level of brand awareness.
30. Event surveys
Gathering feedback from attendees through event surveys can provide valuable insights into the overall satisfaction and value of the event. This can include ratings, reviews, and more detailed comments and evaluations.
31. Session analytics
Tracking the engagement and interaction of attendees during specific sessions of the webinar event can provide valuable insights into the overall appeal and effectiveness of those sessions. This can include the number of questions asked, the number of people contributing to polls or surveys, and the overall level of participation in the sessions.
Conclusion
Webinars are an effective marketing tool for businesses to showcase their expertise and thought leadership in a particular industry. By providing valuable information to attendees, companies can build trust and credibility with their audience, which can help to increase conversions and sales over time. Businesses can use these 31 KPIs to gain valuable insights into the success of their webinars and use that information to optimize future webinars and marketing campaigns. A great way to learn about OKRs is to apply them to sports that we know. In this webinar, find out how one of the powerhouses of world sport, the Manchester United football team could apply OKRs.