It’s no secret that measuring the success of your website or business hinges on user engagement metrics. But what is user engagement, and why should you measure it? How?
Let’s dive deep into user engagement metrics, looking at why they’re important and how to measure them to serve your goals best. We’ll also explore eight key metrics you should focus on in 2023 for more successful outcomes. Let’s get started!
What is User Engagement?
User engagement is the concept of measuring how actively a user interacts with your website or business.
It’s an important metric that can tell whether people respond positively to your site and content. A high user engagement suggests that visitors quickly find what they’re looking for, enjoy their experience while interacting with you and come back often. On the other hand, low levels indicate that there may be room for improvement in how users engage with your brand.
You’ve got to START with the customer experience and work back toward the other way around.

Why Should You Measure User Engagement?
Measuring user engagement is essential for understanding your website or business’s performance. You’ll gain valuable insights into the customer journey by closely tracking key metrics, and these insights can help inform decisions and optimize your online presence. User engagement metrics provide a direct line of sight into how users interact with your brand and whether they find what they need quickly.
By monitoring these metrics, you can ensure that customers have an enjoyable experience while engaging with you, leading to higher conversions and more loyal customers.
These metrics also help you understand what customers want from your business and where they may be experiencing issues. You can make informed decisions that will increase user satisfaction and drive more sales.
How Can You Measure User Engagement?
Measuring user engagement helps you understand how your website or business is performing. To get an accurate picture of user engagement, you’ll need to track key metrics such as page visits and conversion rates.
As Bernard Marr, a world-renowned thought leader highlights, you can track three engagement metrics, including:
Monthly active users (MAU)
Weekly active users (WAU)
Daily active users (DAU)
These metrics indicate the number of users interacting with your services or products within the specified period.
You can also monitor customer engagement by measuring the following:
Online comments and reviews, both positive and negative
Social media shares, comments, and likes
Content engagement on blogs, videos, podcasts, and downloads
Website engagement
Device or app usage
Beyond just measuring individual metrics like page visits, it’s also essential to look at overall trends over time. You can take advantage of analytics tools such as Google Analytics.
Heatmaps can give deeper insights into where people often click on a particular webpage. It helps you better understand what elements resonate with them so that you can adjust for improved results.
Profit.co’s agile OKR management software enables you to create objectives with measurable key results to track the engagement KPIs most important for your business. You can get started on Profit.co today– try it free!
8 Key User Engagement Metrics You Should Measure in 2023
In 2023, businesses need to measure engagement metrics to understand how their website or business performs.
Measuring the proper KPIs gives you a more holistic view of user engagement than just looking at individual numbers alone. By understanding the following eight key metrics, you will have a better chance of achieving target goals. It will be easier to create lasting relationships with customers this year.
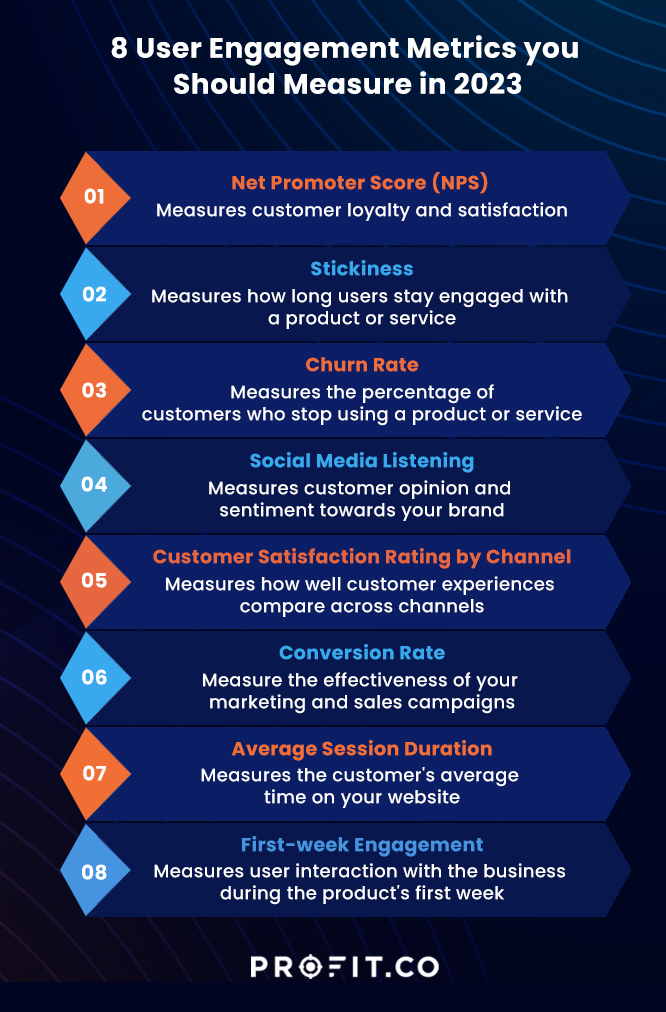
Net Promoter Score (NPS)
Net Promoter Score (NPS) metrics measure customer loyalty and satisfaction based on a simple question: On a scale of 0 to 10, how likely are you to recommend this product or service?
NPS gives you insight into your customer’s overall experience with your brand and identifies areas that need improvement. Comparing competitors’ NPS scores helps you see which company offers the best customer experience.
Stickiness
Stickiness measures how long users stay engaged with a product or service. It is an important metric to track since it gives you insight into user satisfaction and engagement levels. Stickiness elaborates on what features of your products or services keep customers returning. Furthermore, this engagement metric helps identify where to allocate resources for further development.
Churn Rate
The churn rate measures the percentage of customers who stop using a product or service. It helps you understand user engagement and satisfaction levels. It reveals how many customers leave your business every month.
Tracking churn rate helps you identify where your business may lose customers. This information guides adjustments to increase user retention rates.
The churn rate helps you make intelligent decisions about pricing models. Your pricing may be causing users to leave, and you’ll know when to release upgrades to keep users engaged with your products or services.
Social Media Listening
Social media listening metrics evaluate customer opinion and sentiment toward your brand, revealing the conversations about your product or service.
Data from these metrics helps you make informed decisions about which topics resonate most with users. Create content that strikes a chord with your target audience and stay up-to-date on what people are saying about your brand online.
Social media listening lets you respond quickly to negative comments or feedback. You can also monitor trends in conversation topics related to your industry, products, or services.
Customer Satisfaction Rating by Channel
Customer satisfaction ratings determine how well customers’ experiences compare across channels. This user engagement metric identifies which channels provide the best customer experience and highlights where you can improve to increase loyalty and sales.
You can use this data to develop strategies that optimize each channel based on its strengths and weaknesses. Customers can have a consistent experience no matter where they interact with the brand.
You can deliver an exceptional customer experience while staying competitive in your industry.
Conversion Rate
Conversion rate metrics measure the effectiveness of your marketing and sales campaigns. This metric tells you how many website visitors or leads become customers. By tracking this data over time, you can understand which tactics work best and adjust so your efforts result in higher conversion rates.
Knowing your conversion rate helps you understand the effectiveness of different campaign strategies. You can also improve user experiences on critical touch points such as product pages, landing pages, etc.
Average Session Duration
The average session duration metric tells the customers’ average time on your website. It provides insight into which areas visitors spend the most time in and where to make improvements to keep them engaged.
You can identify user behavior trends that indicate growth opportunities. For instance, it’s easier to know when to introduce or improve new features.
Analyzing this metric allows you to make strategic adjustments to ensure customer satisfaction. You’ll also gain insights into what types of content or features drive longer engagement times.
First-week Engagement
First-week engagement tells you how many users interact with your business during the product’s first week.
These engagement metrics help you understand what changes to make to provide an exceptional user experience. It’s the best way to ensure people quickly engage with your brand.
This data also helps inform pricing, content, and product update decisions. Changes may be necessary to keep customers coming back each week.
FAQs
What types of user actions should you track?
User actions such as page views, clicks, and conversions can provide valuable insights into how customers interact with your products or services.
What KPIs should businesses be measuring in 2023?
It’s essential not to look at individual numbers but consider customer satisfaction ratings, open email rates, and social media shares for an even more holistic view of overall levels of engagement this year.
How often should you monitor engagement metrics?
Having up-to-date information about how users engage with your product is essential for optimizing campaigns and improving customer experiences.
Conclusion
User engagement metrics provide insight into how to meet user needs better. Knowing what data to collect, how it affects user experience, and the various analytics available can help you make informed decisions that optimize your customer’s journey. By leveraging these engagement metrics in 2023, you can create more meaningful customer experiences that give your business the edge it needs to grow and succeed. To learn more about how Profit.co can help you measure your most important engagement metrics, schedule a demo with our OKR experts today!