Introduction
To produce anything, including services, businesses of all shapes and sizes need raw materials and equipment. The process through which these businesses acquire their various needs is called the supply chain.
If you’re a business owner, you know that supply chain operations is more than just buying raw materials; this process involves figuring out what you need, when you need it, how much you currently need or will need in the future, how long your current stock will last, when you should begin to make a new batch, how long it will take the needed materials to get to you, how long in advance you should place an order, who offers the highest quality of what you need, what is the cheapest possible price and if there any suitable alternatives.
What is Supply Chain Operations?
Simply put, supply chain operations includes every process that aids in either the management of the flow of goods and services, or the transformation of raw materials into finished goods. Ideal supply chain operations help you to maintain efficiency in your business, lower costs, improve product quality, strengthen customer and supplier relationships, enable you to keep up with demand, and so much more.
Supply chain operations can be broken down into six phases, the first of which is ,procurement. We covered this phase of supply chain operations in our article series on improving procurement. Next comes the material management phase.What is Material Management?
Material management is a core supply chain function that is concerned with planning, organizing and controlling the flow of materials from their initial purchase through internal operations to their introduction into the manufacturing process. The fundamental objective of the material management functions is the acquisition of materials and services of the right quality, in the right quantity, at the right time, from the right source and at the right price. It begins with the receiving and inspection of materials and ends with the issuance of the material to production to meet up with the customer’s demand as scheduled and at the lowest cost. Inventory management and control goes hand in hand with material management because it helps keep track of raw material and specific products, which in turn minimizes costs to the organization and ensures maximum return on working capital. In this article, we’ll discuss techniques for more effective inventory management planning and how you can optimize this process to help improve the material management phase of supply chain operations. Optimize your inventory management planning and your entire supply chain with well-written OKRs. Try the Profit.co OKR Management platform for free today!Inventory Management Techniques for Effective Inventory Management Planning
At its most basic function, inventory management is counting. With systems evolving into ecosystems and with customer needs becoming more varied and needing immediate attention, an inventory management system has also evolved from just counting to becoming a necessary business tool. It is used for the management and control of items in stock. It is also used for the determination of prices, and for analyzing consumer behavior, trends and patterns. The most important use today of a proper inventory management system is forecasting and predicting consumer behavior. The information garnered by an inventory management system is used in maintaining a delicate balance in the number of goods stocked at a particular time. Maintaining this balance is necessary for efficiency, accuracy and profitability. The goal of inventory management is simple: goods stocked at the right time and in the right quantities and goods reordered as at when needed and in the right quantities. These items can be raw materials or finished goods. Two common issues with poorly managed inventories are overstocked items which mean working capital tied up in unsold goods accruing storage costs or an out -of- stock item for orders placed by a customer. It is important to note that to effectively do this, it is necessary to design the system around best practices and sound policies. Inventory management best practice policies are based on three distinct goals; monitoring and managing the flow of items in stock, predicting consumer behavior and making forecast models for the future inventory. Best practice policies dictate that an inventory management system be automated, feature cycle counting, create strategic partnerships with vendors, use historical data to predict future inventories and streamline procurement and delivery efficiently. There are numerous approaches to inventory management planning. Each approach should be considered based on the specific business need of the inventory. Although industries may vary, the fundamental goal of each inventory remains the same. However, the requirements of individual industries make some techniques better suited to their specific goals. There are quite a number of planning techniques. Each comes with its benefits and setbacks. The five covered here will be highlighting the strength of each technique and the industries they best serve.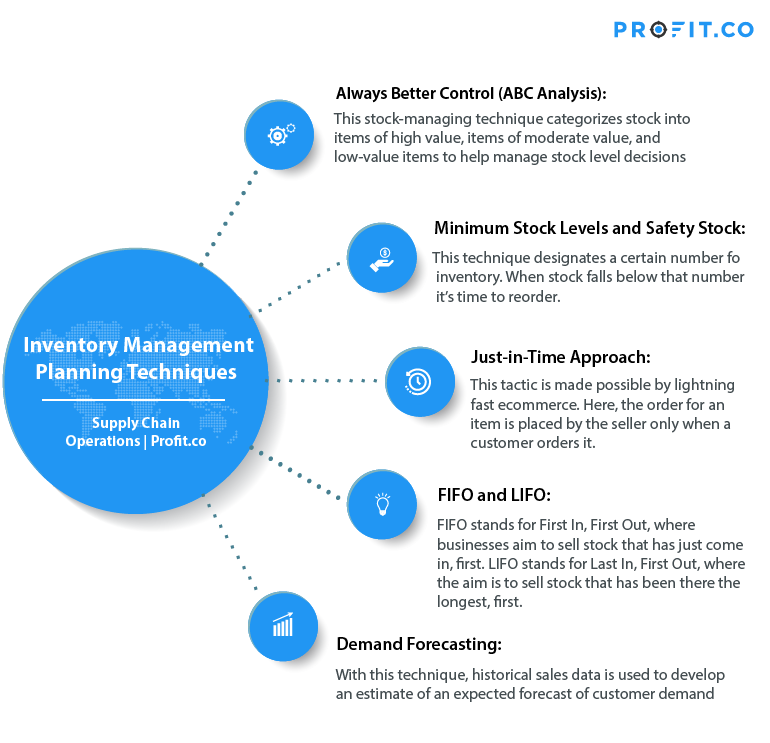
Techniques for Inventory Management Planning
1. Always Better Control Analysis (ABC Analysis):
The Always Better Control Analysis is a technique for managing stock where the decisions on levels of stock are based exclusively on the monetary value of the items stocked. It gets its name from the” Pareto Principle”, named after the Italian economist, Vilfred Paretor. It is also called the 80/20 principle. Items under this approach are categorized into three: Category A, Category B and Category C. The decision making process under this approach factors in the Carrying Costs associated with the items in stock. The Carrying Costs of an item are all costs associated with unsold items of said stock item. The cost of warehousing, the security required for the item whilst in the warehouse and the depreciation value of the items as they remain unsold. This cost determines the actions that should be taken on this inventory item. The three categories of items under the ABC approach and the decisions associated with each category are: Category A: These items are of high value. They account for 20% of the inventory stock items, but their value or output is worth 80% of the revenue of the stock. By nature of their value, the Carrying Costs of these items are high. The required approach to managing these types of items based on the ABC technique is to classify them as ‘High’ in value, flagged that their stocking levels be ‘low’, and they should be reordered frequently. Category B items are of moderate value. They account for 30% of the inventory stock, but their revenue output is at 15% of the inventory stock. The Carrying Costs associated with Category B items are moderate. Hence, the approach is to classify them as ‘moderate’, flag that they should be stocked moderately and reordered periodically. The time frame for reordering could be monthly or quarterly. Category C items are low-value items. However, these items are purchased frequently; hence the Inventory Turnover of such items is high. They usually account for 5% of the revenue output but 50% of the inventory stock items. The associated costs are low, and they are typically reordered in bulk quantities. The ABC is better suited to small scale businesses stocking a variety of items. The VED approach is closely related to the ABC technique. It is not off the mark to think of the VED approach as the ABC approach but adapted for an industry requiring the use of component parts, for instance, an automobile assembly facility. Items in stock are classified as either of three: Vital, Essential or Desirable. However, another important factor which determines an item’s stocking level is the Cycle Time. The cycle time is the time required to gather or pick this item from a storage facility until the item enters the manufacturing process. This value, recorded in units of time, determines how an item is stocked and reordered. Let’s look closely below at the three categories. Vital: The unavailability of this item will upend the whole process of production. With items categorized as ‘Vital’, the production process is adversely disrupted and may come to an abrupt halt if they are unavailable. The Cycle Time value of this item must be such that the vendors on which this item are dependent on are as close to the production base as possible without compromising quality. It is pertinent to note that such items are prioritized in the decision-making actions of the inventory management system. They must never run out. Essential: Essential items under the VED approach do not necessarily disrupt the production process, although their unavailability may cause delays in production. It is, therefore, instructive to flag their importance in the inventory management system. Desirable: These items have little to no impact on the production process, but they are desirable to be on hand. The VED, like the ABC, hinges decisions based on the pricing of these items as well. Hence the cost of these items plays a role in determining their stocking levels as well.2. Minimum Stock Levels and Safety Stock
This approach employs the most basic of all inventory control system; the minimum reorder level. This simply means that when an item reaches a certain number or falls below a certain number, the item should be reordered. However, other factors will go into this reordering process. For instance, consumer behavior which can be predicted on seasons, possible fads or trends currently making the rounds. It is important to correlate the minimum reorder level with consumer behavior when necessary.3.Just-In-Time
The Just-In-Time approach has grown in popularity due to the boom of ecommerce in recent years. The inventory model of the dropshipping business model is based entirely on Just-In-Time. With this approach, orders are only made when an order is received from a consumer. There are very low storage costs associated with this approach. However, the inventory management system’s order picking accuracy must be highly optimized. Without the need for storage, the accuracy of orders to ensure that the right order gets to the right client or customer becomes the priority. Other factors to be considered are the reliability of suppliers, the time required to ship, the cost of shipping and the product demand of items as the seasons’ turn.4.FIFO and LIFO
FIFO stands for First In First Out. As the name implies, the idea behind this technique is to get the stock items that come in first, sold or shipped out first. This technique is a must for dealing with perishable items with a short shelf life. In the perishable section of a grocery store, the idea is to ship out items brought in as soon as possible. LIFO on the other hand, stands for Last In First Out. This technique is suited for heavy duty raw materials that are stacked in piles. The most recent item on the top of the pile is shipped out first.5.Demand Forecasting
Demand forecasting is the process in which historical sales data is used to develop an estimate of an expected forecast of customer demand. Using this technique, a deep dive is done through the historical sales data and used to predict consumer behavior and serve as a guide for populating the inventory. For a successful and efficient system, forecasts are now a necessary tool. A solid investment in a robust tool for demand forecasting, eventually pays for itself by savings accrued by an efficiently managed inventory. Demand forecasting can be used in a car sales company and even in the retail industry. By tracking sales within a time frame, say 12 months, an inventory manager can populate inventory stock to reflect consumer behavior buying patterns. Want to see how you can enact some of these techniques using OKRs on an agile software? Book a free demo with the Profit.co team to see what our product can do!How to Attack Discrepancies in Your Inventory
Many industry leaders in the manufacturing sector, as well as CEOs of Fortune 500 companies, place a significant premium on reasonable inventory control and management. Thankfully, lots of technological innovations and software are available to ensure efficient and effective inventory management. However, it is common to notice some discrepancies in inventory when, for instance; there is a difference between on-hand inventory stock and quantity of items inventoried. These discrepancies often lead to devastating consequences, and can affect profit levels, lead to the excessive stocking of goods and degenerate to overall customer dissatisfaction. Case in point: In February 2018, Kentucky Fried Chicken was thought to be losing about £1million per day due to inventory discrepancies and supply chain disruptions, and it was forced to close many out of its 900 branches in the United Kingdom.Causes of Discrepancies in Inventory
It is an inarguable fact that human errors are the most frequent causes of inventory discrepancies. And they can have a significant effect on the Carrying Cost of Inventory Metric, which is the total expense required to warehouse and ship the inventory of a specific product or material over a certain period. Carrying cost of inventory metric includes warehouse labor, insurance, tax, storage, depreciation and shipping or freight expenses. Human errors in inventory control and management include:1. Misplacing Inventory Stock
Misplaced inventory stock leads to an inefficient Cycle Time: Material Stocking metric which is the amount of time (hours) required to store received materials/properly goods, from the time they are received from the supplier until the time the goods are stored and recorded in inventory management tracking systems.2. Inventory Shrinkage
Inventory shrinkage is a term that refers to having a certain amount of inventory showing in your accounting records, but that same inventory no longer exists in reality. Inventory management is a leading cause of profit loss. In fact, in an industry survey conducted in 2017, it found that inventory shrinkage resulted in a loss of $48.9 billion for businesses in the United States.3. Mismanaged Returns
Mismanaged Returns occur where there’s an incorrect record of returned products as a result of inaccurate coding of such products before they are inventoried. It is necessary to ensure proper training of personnel in this regard as incorrect coding of returned products usually results in a higher Cycle Time: Customer Order Processing rating, which is the number of days required to process a customer order, from the time when the order is placed until the customer receives it. Higher cycle time can lead to business loss to competitors.How To Tackle Inventory Discrepancies
Years of study and inventory analysis have been able to identify three critical steps that can help companies manage their inventories better. These critical steps usually require further reinvestment on technology and personnel, but they are useful because they identify the problems from source and proffer solutions.1. Conduct the Pareto or ABC Analysis
As we said above, the ABC Analysis is the brainchild of Italian Vilfredo Pareto in his Pareto Law made famous in 1907. He opined that 20% of Italy’s population held 80% of its wealth. Pareto’s law also called the 80/20 rule also applies to inventory management by saying that 80% of the possible sales recorded will emanate from just 20% of the inventoried items. The ABC analysis categorizes goods as A, B and C. Category A goods are 12% of total inventory which will yield about 75% of sales, Category B – 25%, Category C – the remaining 63%. Category A goods should thus be given the highest priority as they yield higher Inventory Turns. Higher cycle counts must be conducted on Category A goods as they amount to more frequent sales. It is also essential to hold them in lower quantities. Ensuring the placement of more frequent orders is also an excellent strategy to reduce the cost of keeping inventory and its associated risks.2. Cycle Counting
Cycle Counting means a routine count or stock-taking using a checklist to detect any inventory discrepancies. They will ultimately help determine the Total Inventory Value, which is the total dollar value of the company’s inventory at a certain point in time. Total inventory value includes raw materials, components/parts, replacement parts, in-process goods and finished goods. Efficient cycle counting can also help detect misplacements and inaccurate coding of returned goods. Following the example given under the ABC Analysis above, considering an SKU of 10,000 distinct units of goods, cycle counts will be very tasking and will require a lot of staff-hours. However, the ABC Analysis shows that Category A, B, and C goods will represent 1200, 2500, and 6300 units, respectively. It clearly shows that while conducting an arbitrary count of the total 10,000 distinct goods could be quite overwhelming, counting 1200 high rotation goods will be more manageable. Cycle counts are best conducted during periods of least activity and items to be counted as such be broken down into smaller manageable units per day. When this is done, for a total inventory of 10,000 units, 1 to 2 employees can count up to 100 to 200 items per day. Within a week, a full-cycle count would have been conducted for the Category A goods, and by doing this once a month, about 80% of total inventory value would have been counted. Depending on the rotation of goods, it is best to count Category A goods 2-3 times a month, Category B goods once every 2-3 months, and Category C goods once every 3-4 months.3. Inventory Tracking
Inventory tracking is the final step after a successful analysis and application of the first two steps. From the data gotten, analyzed and presented as percentages, each business can now decide on an acceptable percentage of inventory discrepancy. Put simply, a business that requires an inventory accuracy of 97% can only allow a discrepancy of 3%. Put practically, starting with Category A items, the discrepancy per item should be calculated and given a number. For instance, item 50 may have a physical count of 97 instead of 100 expected. This should be done for all the items, and the total physical counts should be divided by the number expected and divided by 100 to give the percentage of accuracy. Likewise, the discrepancy can be determined by simply subtracting the result from 100. If the results are less than the target goal, then more emphasis should be placed on items with the highest discrepancy. If the margin is too wide, then cycle counts should be conducted more often. Effective inventory management demands that items with the highest discrepancy rates should be more closely monitored. They can be put in the front shelves for easier and more frequent counting. Putting them in front will also allow for closer monitoring with surveillance cameras if the discrepancy is as a result of theft. The above critical steps if applied effectively and efficiently will result in a very low inventory discrepancy and will translate to customer satisfaction and increased profit over time.Final Thoughts
Improving processes through the material management phase of your supply chain operations can have a large impact on the overall efficiency and effectiveness of your organization. While inventory management planning might seem straightforward, taking the time to optimize this process and ensuring that you are managing your inventory to the best possible standards can help your business run seamlessly so you can free up time for your entire team to target goals and issues as they arise, and rest easy knowing that important process like this one are running smoothly.