
In this blog you will learn
- What is S-curve in project management?
- Types of S-curve
- Uses of S-curve
- FAQs On S curve
What is S-curve in project management?
An S-curve is a graphical representation or an illustration of the cumulative data related to a project. It uses relevant data from the project, such as cash flow, man-hours, etc., and traces the progress of these aspects of the project against time. This helps you to:
- Make a projection of how a project would progress along an approximate timeline during project planning.
- Revise projections based on ongoing changes in the project.
- Track the actual progress of the project.
- Identify the various developments in the project.
- Compare the real-time aggregated data against the predictions made earlier.
- Assess the performance of the various aspects of the project by visualizing the cumulative data
- Identify issues and obstacles in the project and address them.
- Make sure that the project is on track and it progresses as per the schedule.
- Ensure the project is completed within the planned budget and does not require more resources.
Mankind invented a system to cope with the fact that we are so intrinsically lousy at manipulating numbers. It’s called the graph.

Why is it called the S-curve?
It is called an S-curve because of the S-like shape that it typically makes in the graph while tracking the progress of your project. However, an S-curve does not necessarily have to be in the shape of an ’S’ all the time. It can differ, depending on the nature and the type of the project.Why does an S-curve assume that shape?
S-curve assumes that shape because of how a project usually develops and progresses.
The project usually has limited activity and progress in the beginning. This is because, in the project’s initial phase, you would still be planning, conducting a market study, or evaluating the various aspects of the project, such as budget, human resources, etc. You would be onboarding members, building the project team with the right people, defining their roles, and setting goals for the project. You might still be having problems or minor glitches that typically show up during the initial phases of project execution. As a result of all these factors, there would not be any significant activity in project execution. Consequently, the graph would remain relatively flat during that phase, forming the lower part of the S-curve, which is known as the lower asymptote.
But as everything becomes clear and the project takes off and gains momentum. As a result, the graph representing the project’s progress also rises exponentially. This rise forms the middle part of the S shape in the graph. This is where the highest amount of growth is recorded. The point of maximum progress is called the inflection point. This point represents the time when the project team members work really hard, and the most budget and resources are being spent.
Beyond this point in the curve, the graph flattens out, completing the S shape with a flat top portion named the ‘upper asymptote’. The upper asymptote marks the change in the progress of the project – a point where the project attains maturity. This maturity is attained when work related to the project gets completed and when you start wrapping up the project, evaluating its impact, writing the report, and getting approval from key decision-makers. The S -Curve is a helpful tool in any project management style including kanban or waterfall project management.
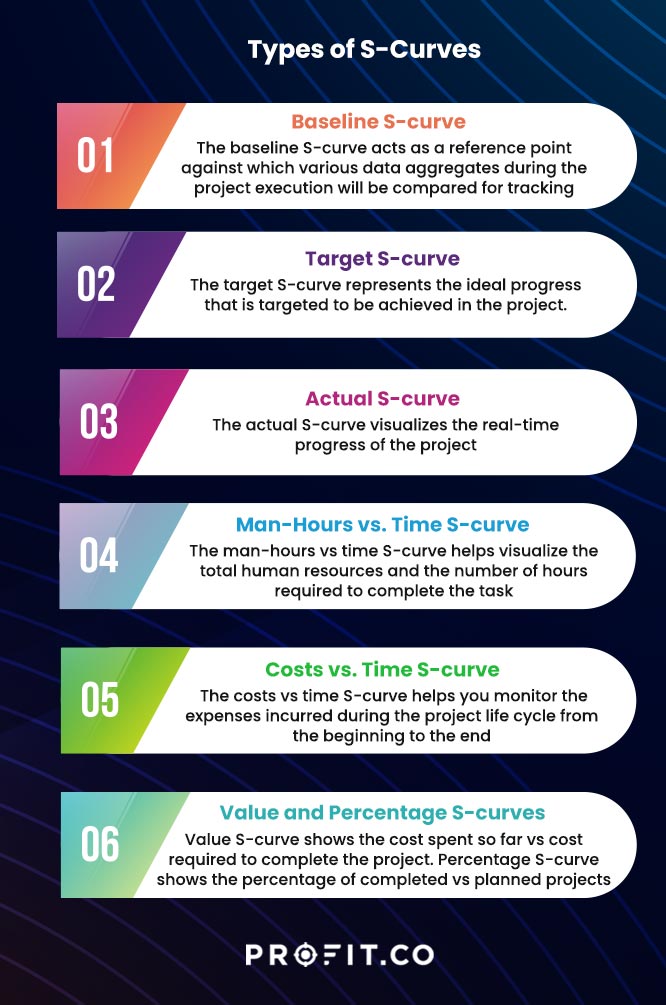
Types of S-curve
Following are the different types of S-curves in business.
- Baseline S-curve
The baseline S-curve is a graph that is created for planning and making projections regarding the project timelines and expected progress. It helps allocate resources, set the order in which the tasks should be completed, and create a project schedule based on that.
These predictions can change during the planning as you revise the project scope, budget, resource allocation, duration, etc. Once the project planning is complete, a final baseline schedule is agreed upon, and the projections are visualized as a baseline S-curve. The baseline S-curve acts as a reference point against which various data aggregates during the project execution will be compared for tracking progress and ensuring that the project follows the schedule at all stages.
- Target S-curve
A project may start well according to the baseline schedule, but it sometimes goes differently than the plan once you start executing it. The project may require constant revisions in the schedule due to reasons such as delays caused by challenges at various stages. These modifications led to a revised schedule, namely the production schedule. The production schedule starts similar to the baseline schedule but becomes different after you make changes.
You will get a target S-curve when this production schedule is visualized as a graph. The target S-curve represents the ideal progress that is targeted to be achieved in the project.
If the project does not suffer any delays, cost overruns, or setbacks, the target S-curve will perfectly intersect the baseline S-curve when you complete the project.
If you complete the project ahead of schedule and below the budget, your target S-curve will end at the bottom left of the baseline S-curve.
If you can complete your project only beyond the schedule and above the budget, then your target S-curve would end at the top right side of your baseline S-curve. This is the case with most projects, as unexpected delays and expenses always occur during project execution, regardless of how well you plan your production schedule.
- Actual S-curve
While the baseline S-curve and the target S-curve are projections of how a project should progress, the actual S-curve visualizes the real-time progress of the project. It includes the progress that you have achieved in the project so far, and the changes you have made in the production schedule halfway through the execution of the project, based on the delays and setbacks you have faced after you started implementing the project based on the production schedule. You can compare the actual S-curve against the baseline and target S-curves to see how your project performs against your initial and ideal projections respectively. The actual progress of the project can be determined by visualizing the difference between the target S-curve and the actual S-curve.
- Man-Hours vs. Time S-curve
When your project requires a massive workforce, the time your employees/laborers spend working for the project is extremely important, as every additional man-hour costs. If the project suffers delays and setbacks, or if the employees/laborers do not do the work efficiently, it can seriously impact the project. So, it is crucial to always plan for and have the right amount of workforce and man-hours at any given time in the project. The man-hours vs time S-curve helps visualize the total manpower and the number of hours required to complete the task.
- Costs vs. Time S-curve
Costs incurred during a project should be under control and should approximately align with the projections made while planning. Cost overruns can derail a project or result in not meeting the objective. For instance, if your project involves developing a new product, and if the material costs, labor costs, or cost of outsourcing increases during the project execution, you would not be able to offer the product at the target price due to high costs. This could put you at a disadvantage against your competitor. The costs vs time S-curve helps you monitor the costs incurred during the project life cycle from the beginning to the end. It helps to calculate the project’s total cost and cash flow and helps to keep the costs under check.
- Value and Percentage S-curves
Value S-curves visualize the absolute quantities of man-hours or costs spent so far, and the same required to complete the project. Percentage S-curves visualize the completed project and compare it against the planned completion, in percentage, revealing the percentage growth of the project, contraction, etc.
All successful businesses evaluate the performance of the Project Management Office (PMO) performance using metrics like the S-Curve. Tracking PMO performance is more complex, and many companies often need to measure project management aligned with the business outcome.
So to ensure that they are reaching their goals, Organizations can use the OKR framework, a powerful goal-setting tool that companies of all sizes use to help set priorities, align goals, and achieve success in their organization. A project management team can undoubtedly use this framework to focus their efforts on what truly matters for the success and development of their business and help ensure that all requirements are met with focus and alignment using the right PMO OKRs
Book a free demo with our team to learn more about how OKR software can optimize your organization’s performance!
Uses of S-curve
5 insights you can get from an S Curve.
- Determine the current status of the project, verify its progress and forecast the costs incurred, time taken, and the man-hours required to complete the project.
- Compare your S-curves against actual cost, earned value, and planned value, to determine if the project is budgeted right or whether it is behind/ahead of schedule.
- Visualize the change of scope that happens after you make changes in the costs, timeline, and other project parameters, and determine the requirements for additional resources and/or time; you can do this by comparing your baseline and target s-curves.
- Identify any slippage, i.e., the amount of delay a task has suffered compared to the planned schedule. You can calculate that by comparing the baseline S-curve against the target S-curve. The difference between where the task is scheduled to start and end and where it actually starts and ends shows the slippage in the graph. By identifying slippage, you can allocate additional resources to avoid it or revise the schedule to accommodate it.
- Calculate the cash flow using the cash flow vs. time S-curve and help the stakeholders derive the need for cash at any given time. Cash flow is the time and quantity of cash required for every task in a project.
- Forecast the range of possibilities using the banana curves that represent the time of project completion, the man-hours, or the cost. When you have an estimated range between delayed and early project completion, the highest and lowest manpower required, and the highest and lowest cost incurred, you can find an ideal middle ground to create a more realistic schedule and a budget.
- Estimate and evaluate the quantity of output from your construction/manufacturing project. An important tool for any agile project management.
Final Thoughts
Data , graphs and charts play a vital role in project management. It serves as a valuable source to access, compare and decide. The role of the S-curve to take critical decisions is not lost on leaders.
Learn more about agile OKR software and how it can be an effective tool in project management
Frequently Asked Questions
An S-curve is a graphical representation of how a project progresses over time.
S-curve gets its name from the typical shape of the graph that represents the progress of a project.
One real-world example of an S-curve is the graphical representation of a baseline schedule. As a project is in the preliminary/planning phase, it is slow to progress and the chart remains flat. Once there is a flurry of activity in the project and when the project moves ahead, the curve also takes off, and as the project nears completion, the activities get reduced and the curve stabilizes as well.