

The 9 Box Matrix in Profit.co plots your organization's talent pool on a 3x3 grid using performance and potential scores. It gives managers a single visual view for spotting high performers, growth candidates, and underperformance across teams.
Quick Answer
The 9 Box Matrix is a Performance dashboard tool that plots employees on a 3x3 grid based on scores such as Manager Competency and Potential Assessment. Build one from Settings → Performance → Dashboard → 9 Box Matrix, where you name the matrix, add users to the Access List, and set the X- and Y-axis factors (with the Formula toggle for custom attributes). Data can be filtered by review, job title, or department, and exported as CSV or XLS. Each employee's placement remains adjustable until the review is finalized.
Table of Contents
What Is a 9 Box Matrix in Profit.co?
A 9 Box Matrix is a matrix tool in the Performance module that evaluates and plots your organization's talent pool against multiple assessment factors. It combines potential assessment, goal score, OKR score, manager's overall rating, self overall rating, and secondary reviewers' overall rating into a single cumulative view.
Each employee's self-assessment score and their assessment scores provided by others are averaged to determine where they land on the grid. These combined factors are plotted along the X-axis (horizontal) and Y-axis (vertical) according to your organization's requirements.
Why the 9 Box Matrix Matters
The matrix turns scattered review scores into a single visual dashboard that surfaces your organization's high and low performers. That makes it easier for HR and leadership to identify who is ready for growth, who needs coaching, and where succession risk exists.
How It Works
Step 1: Open the 9 Box Matrix Dashboard
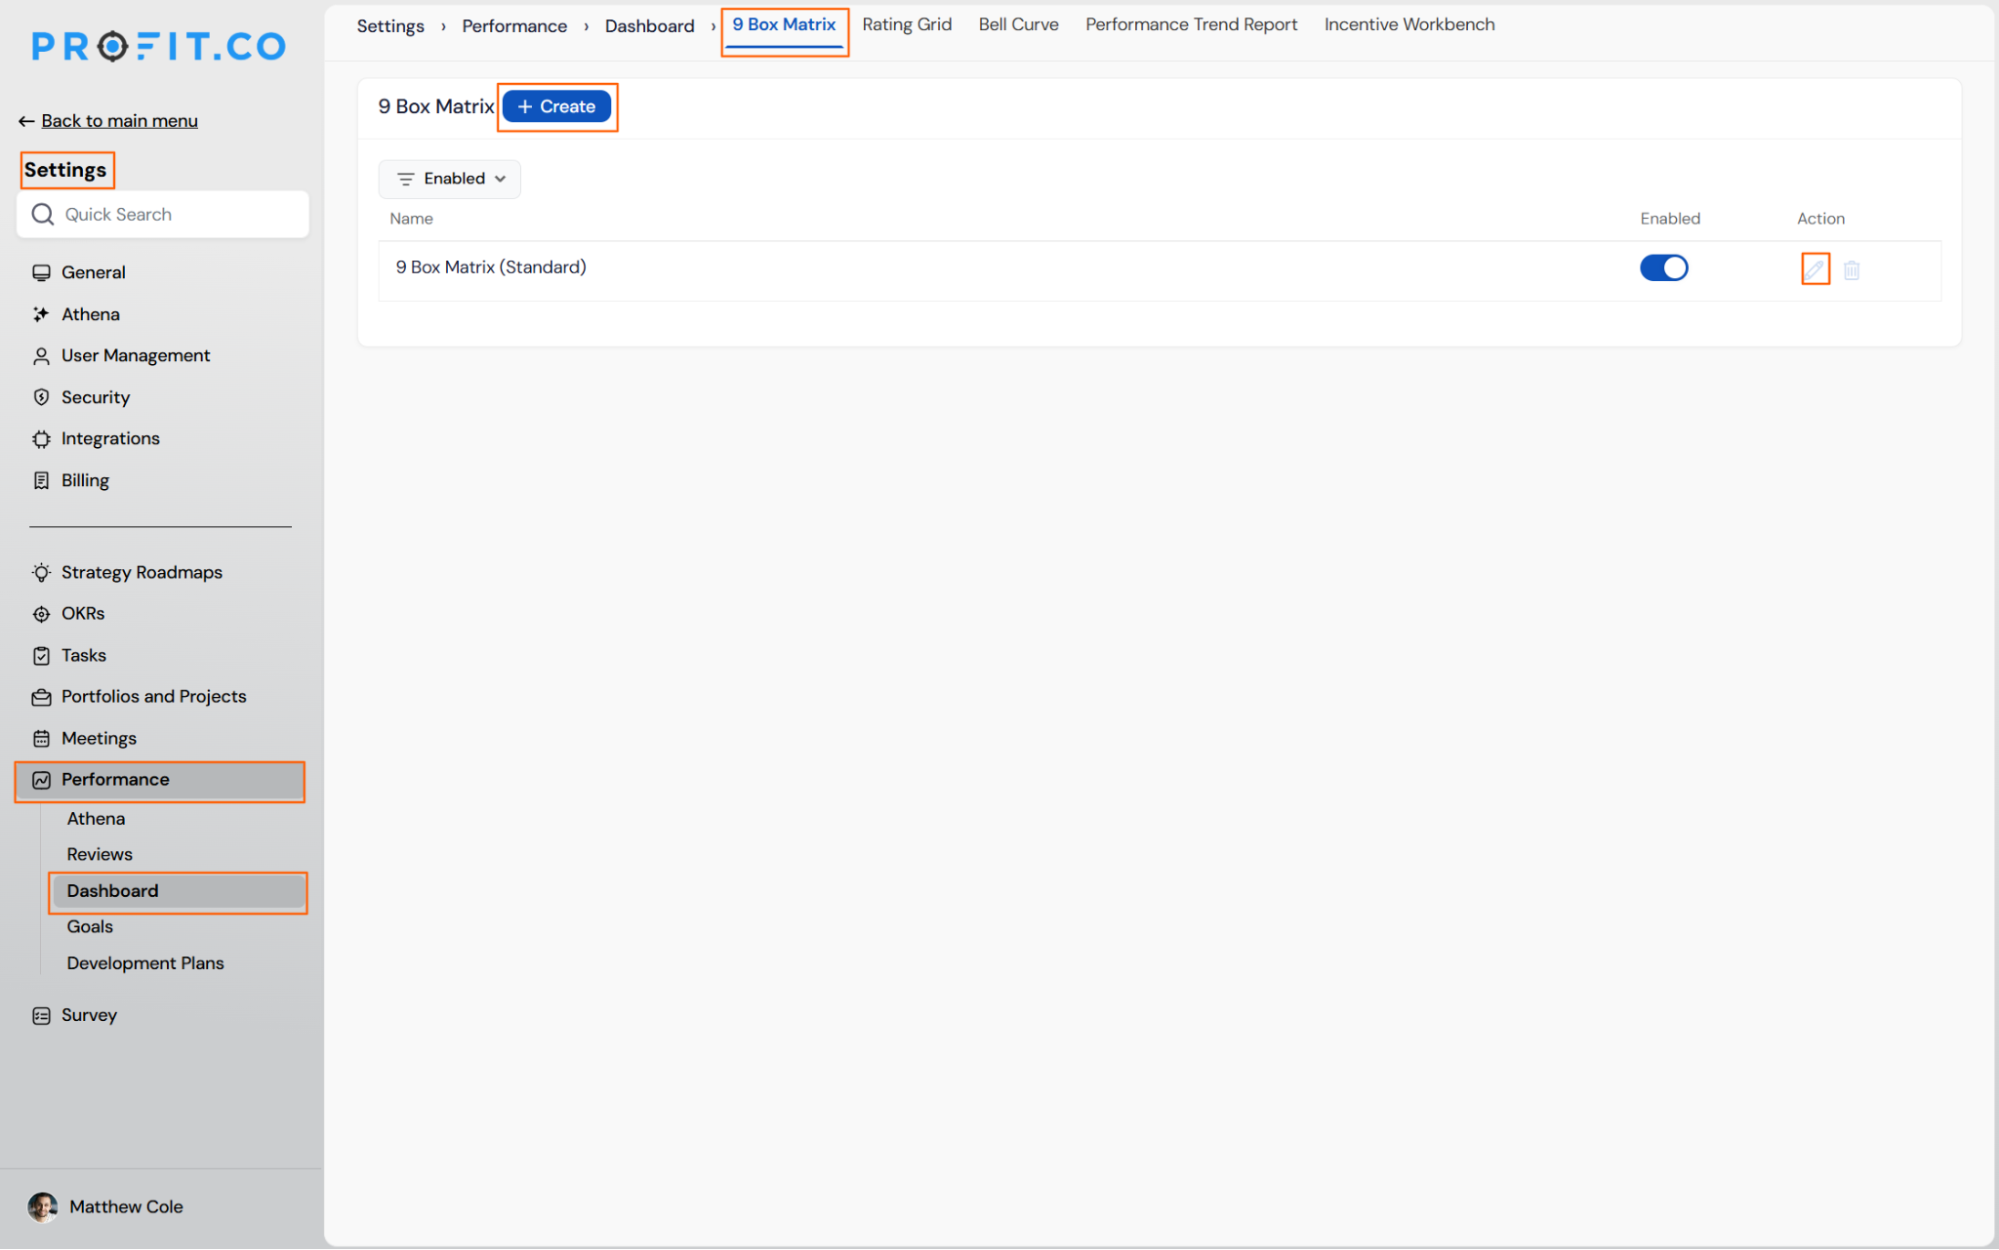
- Navigate to Settings → Performance → Dashboard from the left navigation panel.
- On the Dashboards page, switch to the 9 Box Matrix tab to edit an existing matrix.
- Click + Create to build a new matrix, or edit the Standard template to fit your preferences.
Step 2: Configure the Matrix
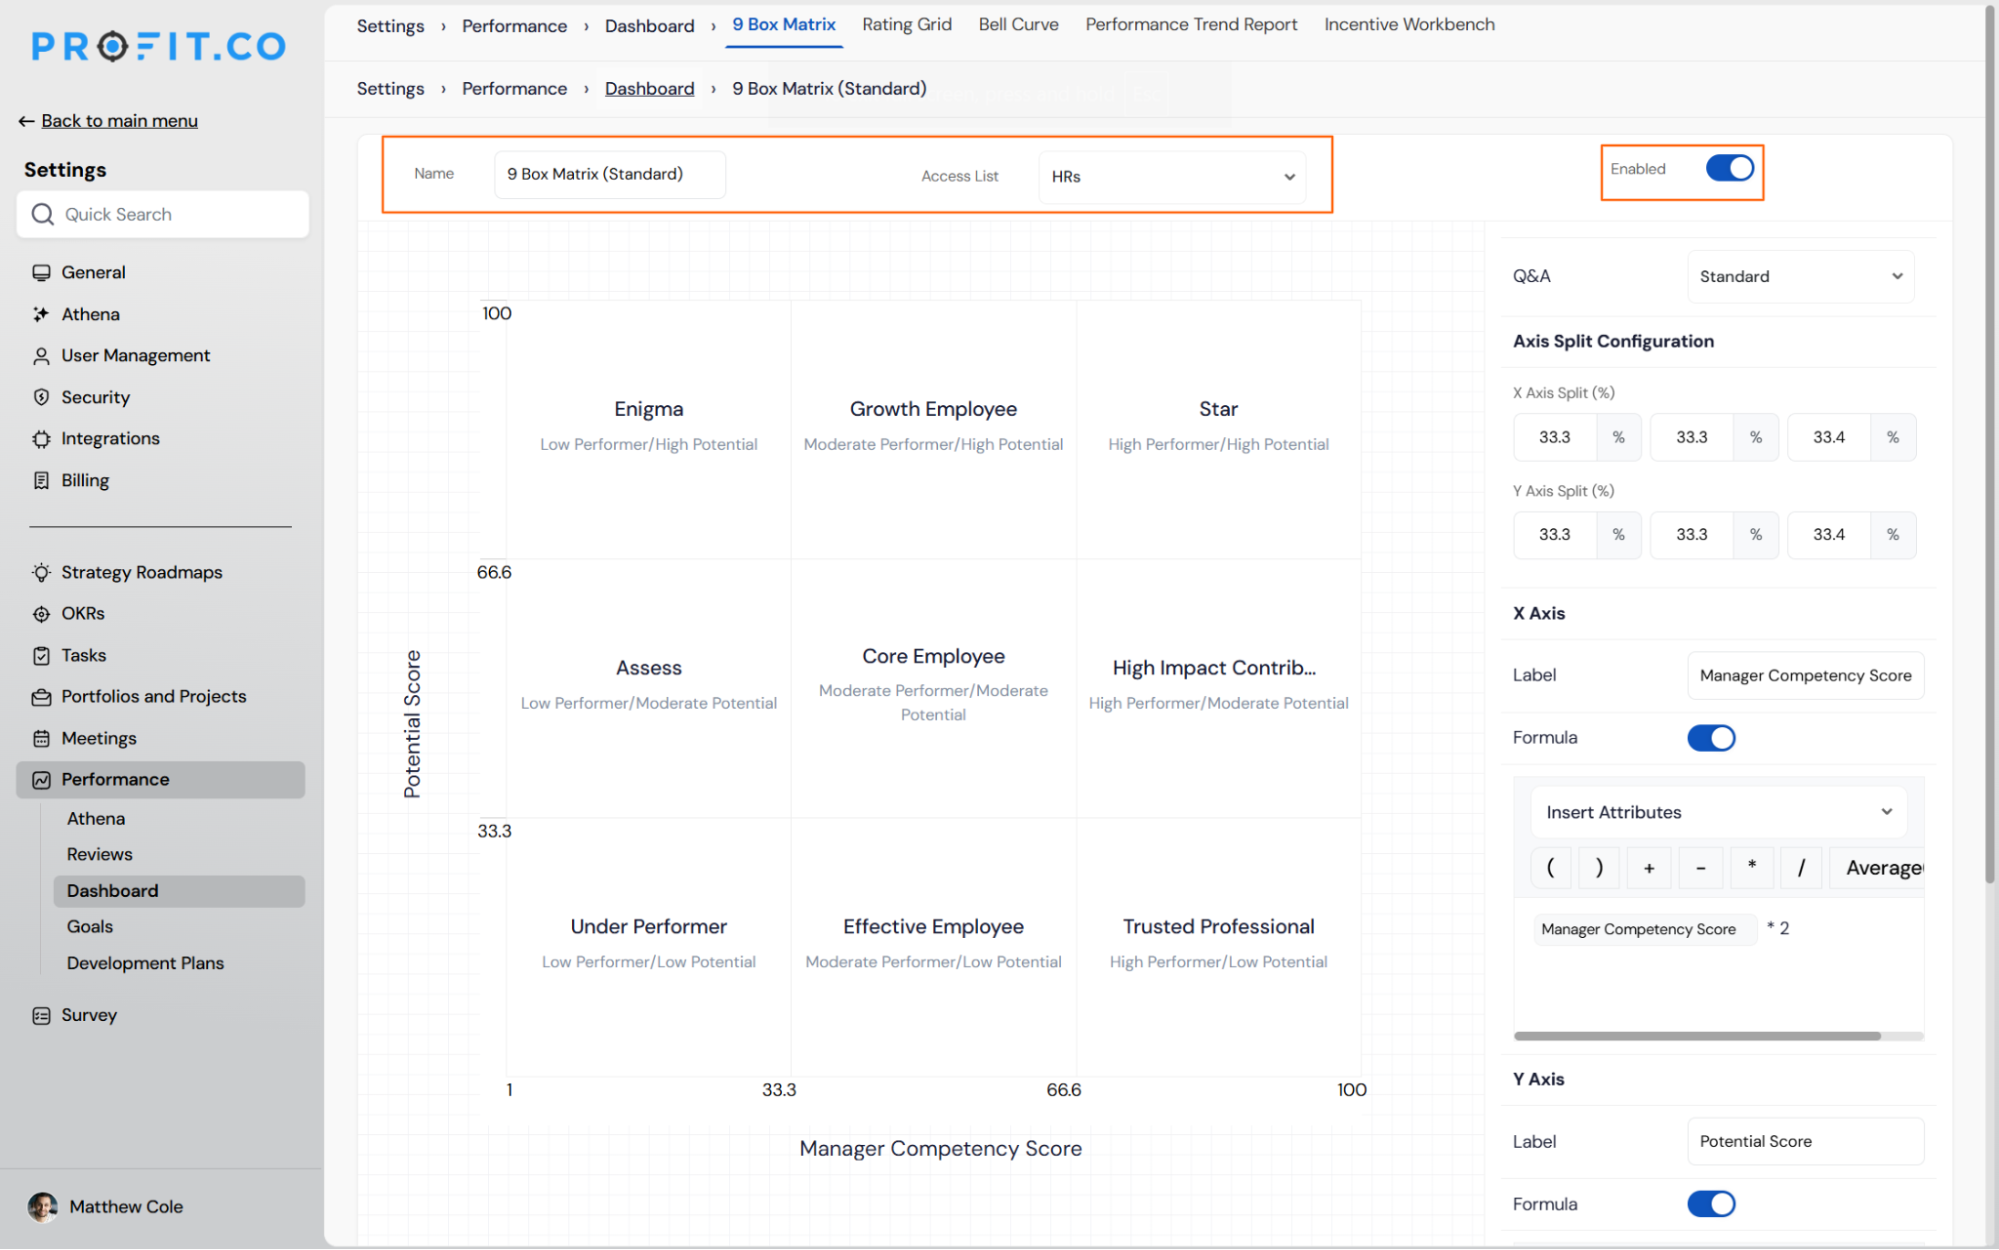
- On the Create 9 Box Matrix page, enable the toggle to activate the matrix.
- Provide a name for the matrix and select users from the Access List.
- Set the axes — by default, the X-axis reflects Manager Competency Score and the Y-axis reflects Potential Assessment.
| Configuration Element | What It Controls |
|---|---|
| Access List | Which users are included and evaluated in the matrix |
| X-axis (default) | Manager Competency Score |
| Y-axis (default) | Potential Assessment |
| Formula toggle | Lets you insert custom attributes to calculate either axis |
You can also edit the plotted factors so their labels match your organization's own terminology and evaluation criteria.
Step 3: Review the Plotted Results
- Employees are categorized and placed in the grid based on their individual combined scores.
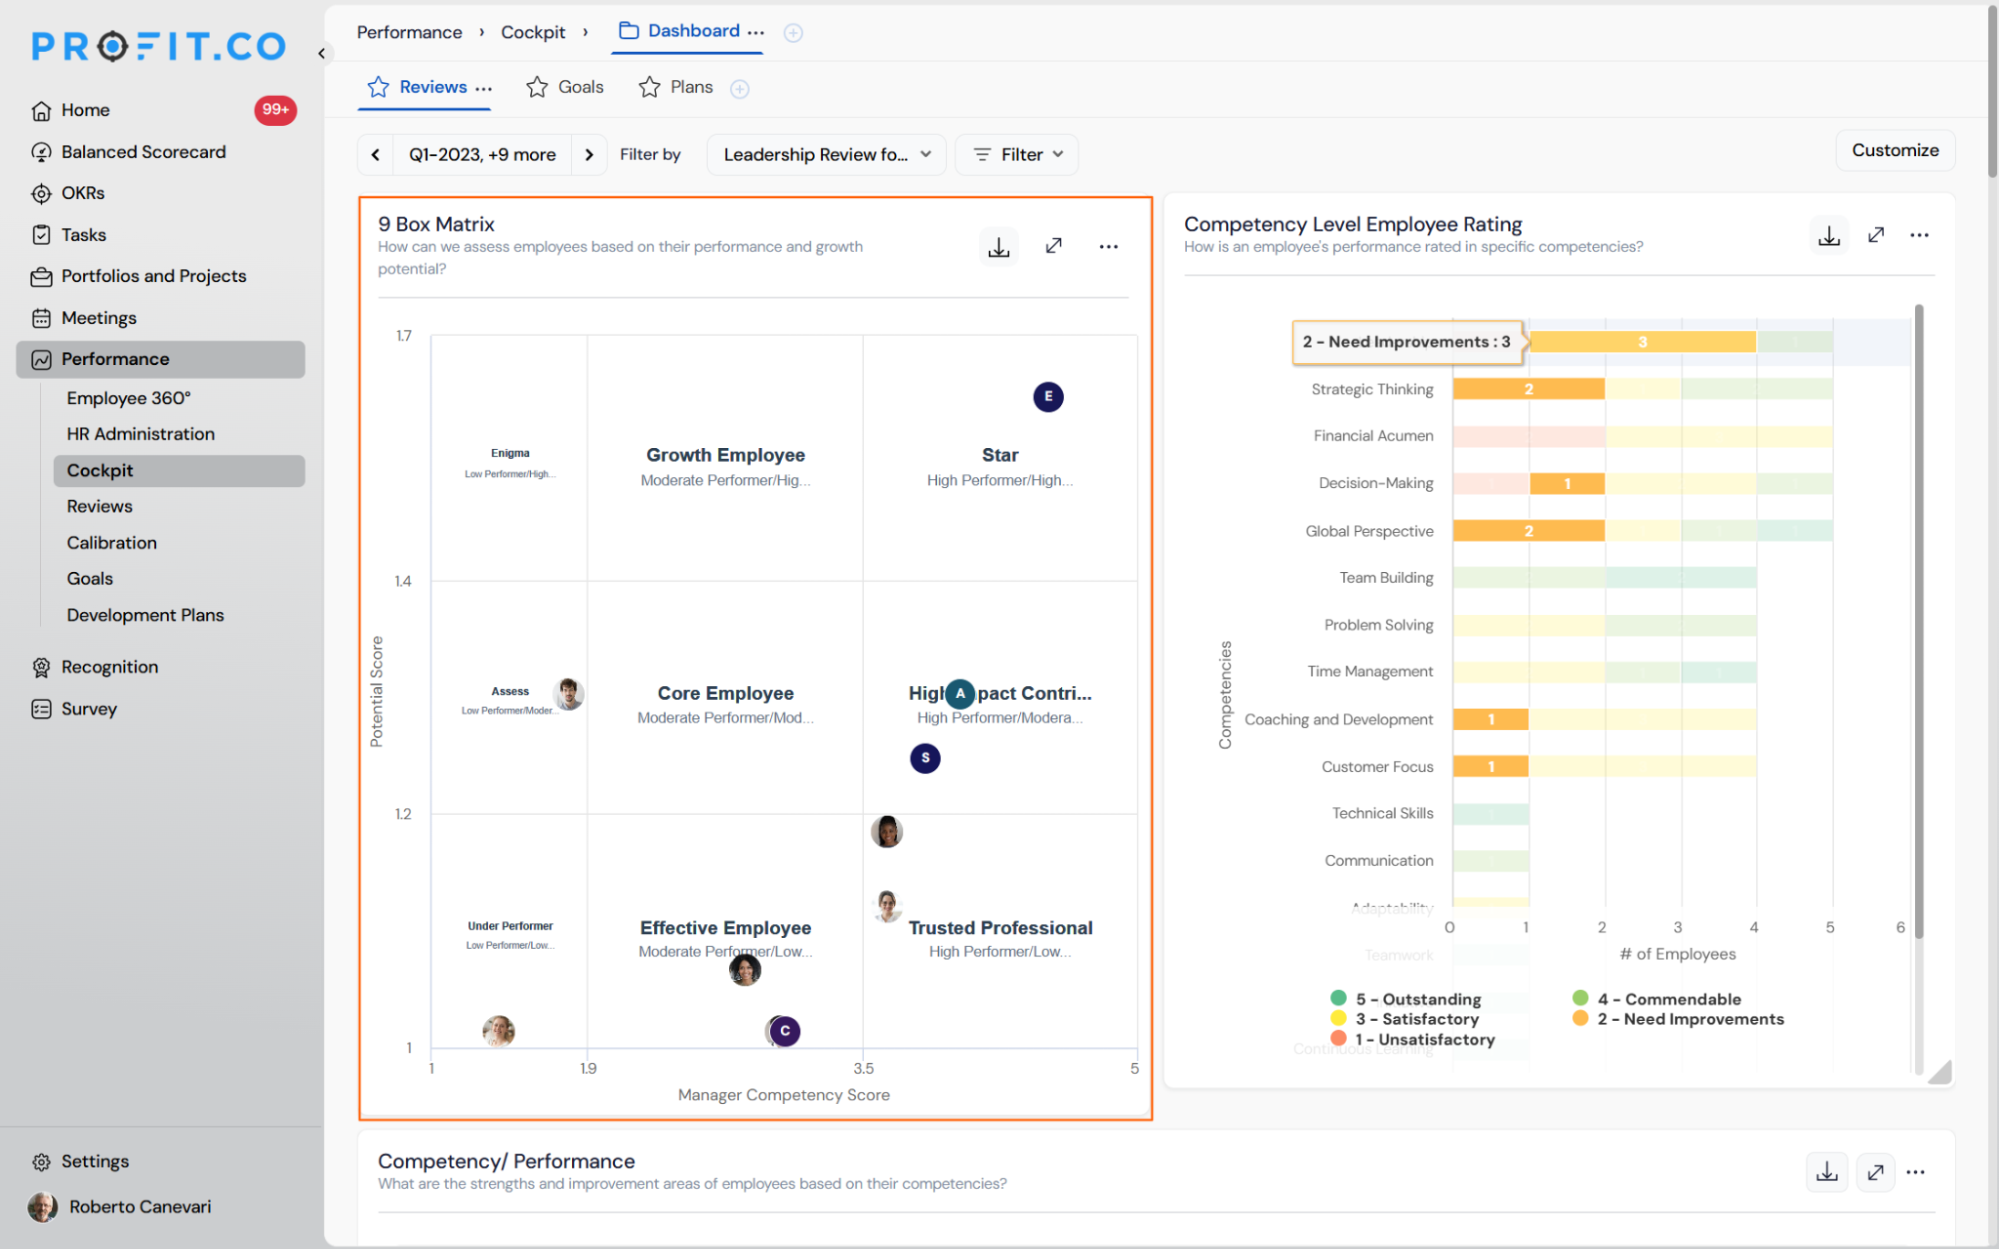
- On the 9 Box Matrix Dashboard, filter by Performance Reviews, Review Participants' Job Titles, or Departments.
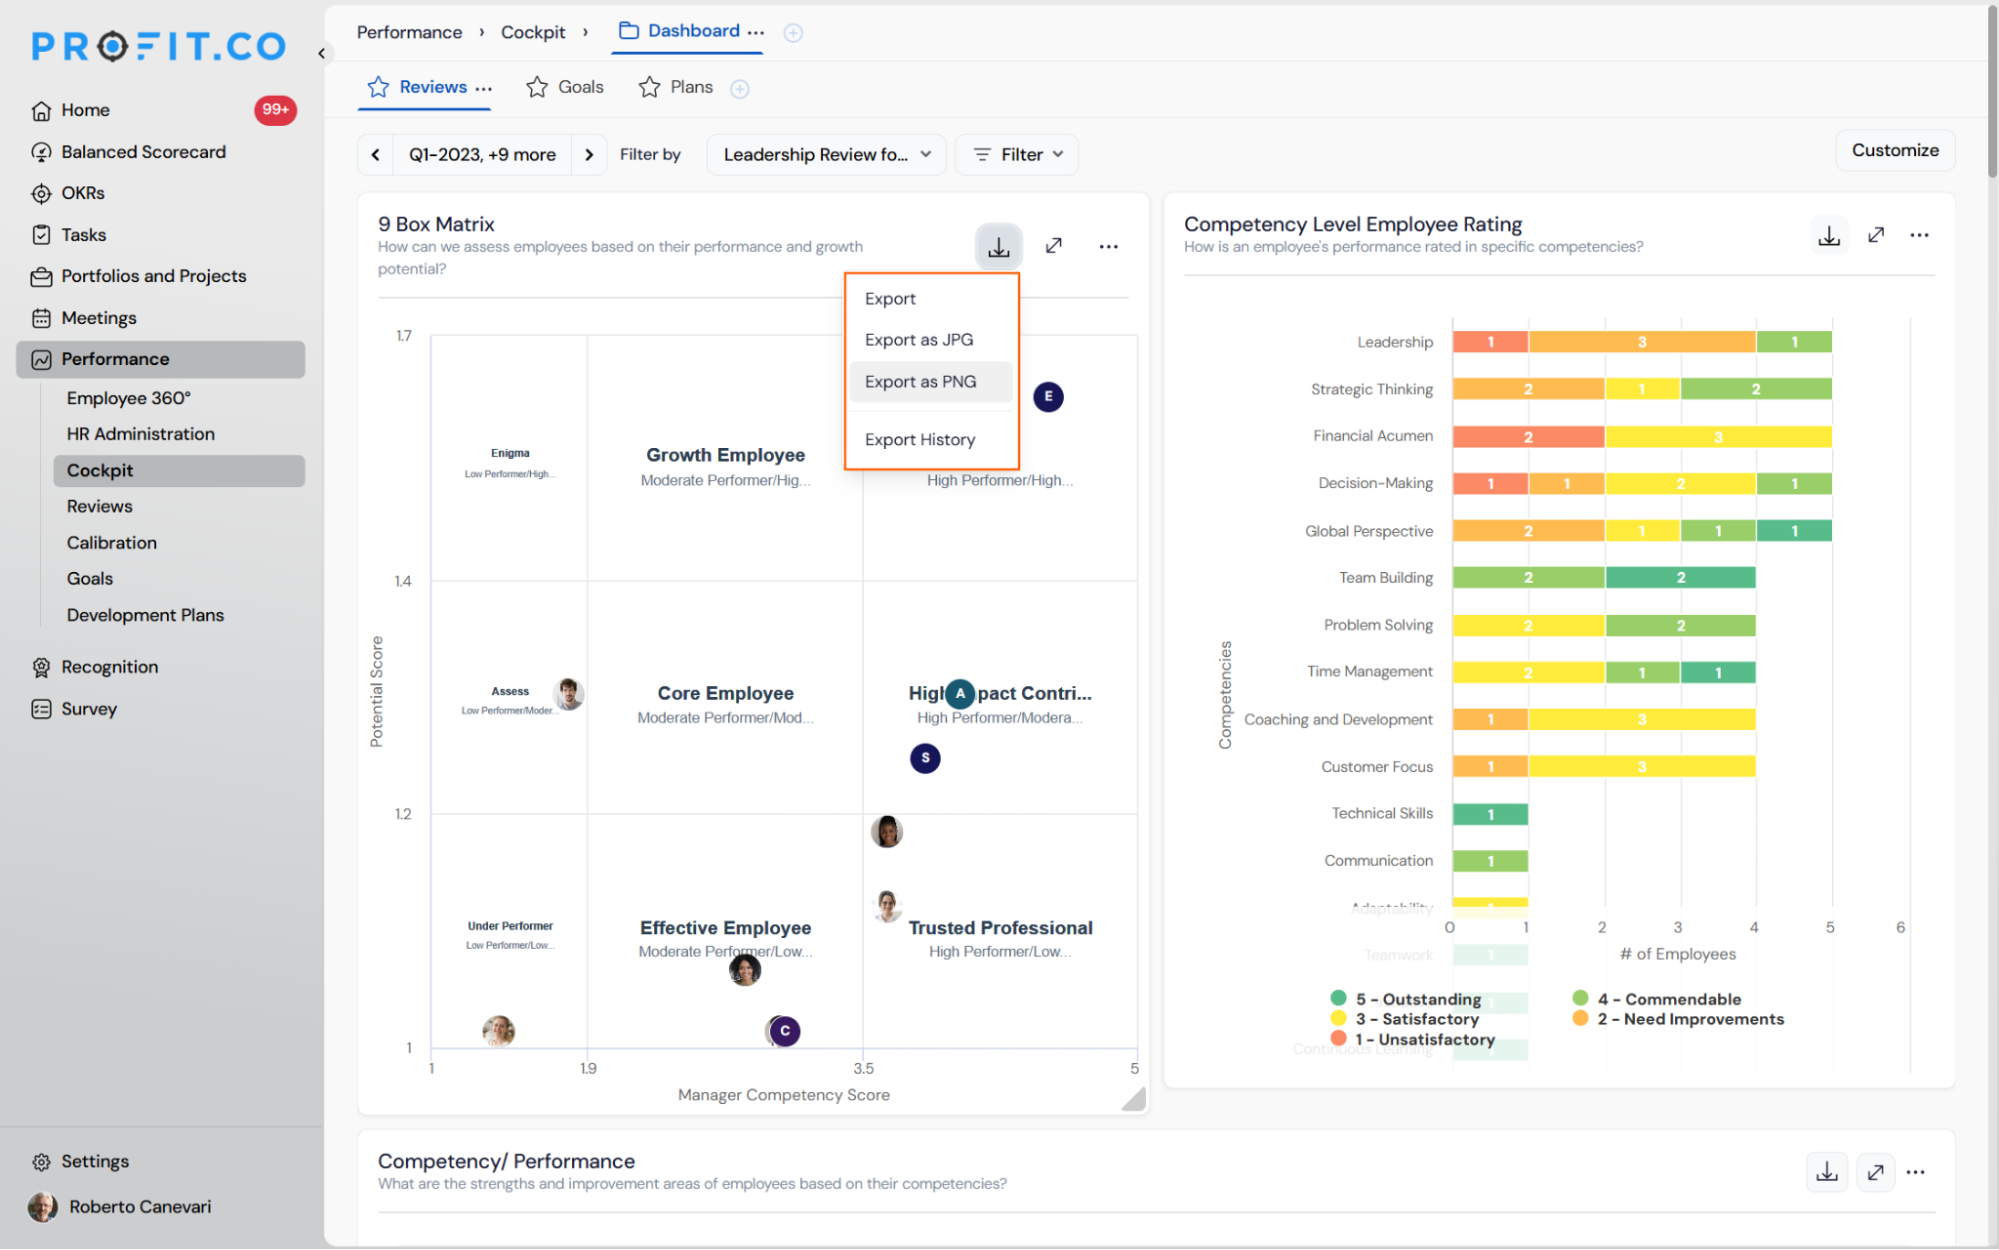
- Export the filtered results as a .CSV or .XLS document.
Talent Categories Plotted in the Matrix
Based on their combined scores, employees fall into one of the predefined categories below, giving reviewers a consistent vocabulary for talent conversations across the organization.
- Enigma
- Growth Employee
- Star
- Assess
- Core Employee
- High Impact Contributor
- Under Performer
- Effective Employee
- Trusted Employee
Best Practices for Using the 9 Box Matrix
- Name each matrix clearly if you maintain more than one, especially when different departments use different criteria.
- Keep the Access List limited to the reviewers and employees relevant to that specific evaluation cycle.
- Use the Formula toggle to align axis criteria with your organization's own competency framework instead of relying on the default scores.
- Review and adjust individual placements before finalizing performance reviews to catch scoring anomalies early.
- Export filtered data regularly to track calibration trends across job titles and departments over time.
Related Questions
Frequently Asked Questions
Yes. From the 9 Box Matrix tab, you can edit the Standard template or click + Create to build additional matrices for different teams or evaluation criteria.
The matrix uses its default axes — Manager Competency Score on the X-axis and Potential Assessment on the Y-axis — without custom attributes.
Yes. You can view and adjust an employee's placement in the matrix any time before the performance review is finalized.
Execute your strategy with confidence
Connect OKRs, tasks, and teams in one place with Profit.co
