In this guide
- What is a Measure?
- What is a Metric?
- What is the Difference Between a Measure and a Metric?
- Measurement, Measure and Metric
- Metric vs Indicator
- Examples of Measures and Metrics
- How to Use Measures and Metrics
- Conclusion
- Frequently Asked Questions
Measures and metrics are easy to confuse because metrics are measures but with more significance. A measure is simply a figure, but metrics give this context. Both can provide valuable insights into how well your business is performing and where you should focus your efforts for improvement. By understanding these tools and learning when to use them, you can gain valuable insight into the health of your business.
Let’s explore measures and metrics as we highlight the key differences, discuss some examples, and find out how to track them.
What is a Measure?
A measure is a raw numerical value that records a quantity, size or amount at a specific point in time. Measures are the basic units of data collection: revenue, headcount, volume, duration, count. They are objective and precise, without a target or baseline, a measure tells you what happened, not whether it is good or bad.
A measure is a classification unit of raw data, like a value or number like length, volume, and area. Measures are typically used to quantify some size, quantity, or intensity. Measures help to assess individual elements within a more extensive system, such as employee productivity over a certain period.
Measures also help you identify areas to change to achieve your business goals. Still, they do not necessarily provide insight into why those changes should occur or how they will impact performance over time.

A useful metric is both accurate (in that it measures what it says it measures) and aligned with your goals. Don’t measure anything unless the data helps you make a better decision or change your actions.
–Seth Godin
What is a Metric?
A metric is a measure that has been given context, connected to a goal, and used to evaluate performance over time. Metrics answer the question “how well are we doing?” rather than simply “how much?” They combine raw data (from measures) with a reference point, a target or benchmark, to make the data actionable.
A metric is a measure you can quantify to monitor the progress and status of particular processes. Metrics determine the progress towards a certain goal by tracking specific data points over time.
They focus more on outcomes than inputs, providing quantitative evidence of improvement or decline over time which helps enhance the decision-making processes.
Metrics provide a more comprehensive assessment of how well your business is performing. You can use the metrics for predictive analysis to anticipate changes in the market or adjust strategies accordingly.
What is the Difference Between a Measure and a Metric?
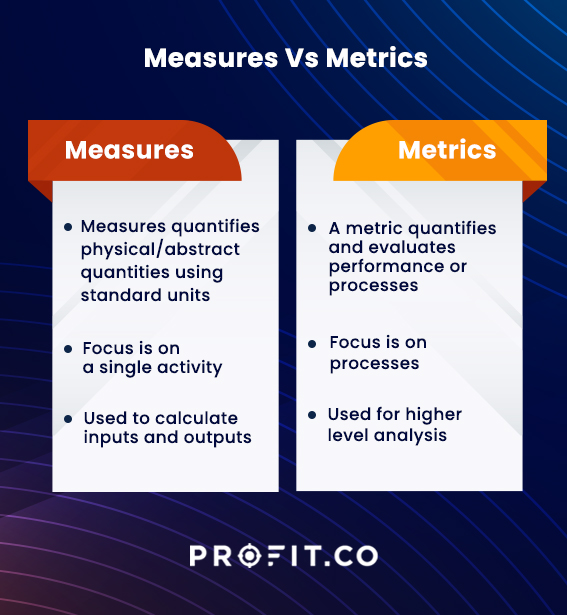
The difference between a measure and a metric is that a measure is a raw data point, a number or quantity that records what happened, while a metric is a measure placed in context with a goal, a baseline or a comparison that makes the number meaningful. All metrics use measures; not all measures are metrics.
A measure answers “how much?” A metric answers “how well?” Measures are raw inputs: revenue collected, calls handled, errors logged. Metrics are contextualised outputs: revenue growth rate, call resolution rate, error rate over time. Whether a number is a measure or a metric depends on whether it has been compared against a target.
Metric vs Measure: Side-by-Side Comparison
| Dimension | Measure | Metric |
|---|---|---|
| What it is | A raw data point that records what happened or exists | A measure placed in context with a goal, baseline or comparison period |
| Question it answers | “How much?” or “How many?” | “How well?” or “Is this good or bad?” |
| Context required | No, stands alone as a raw figure | Yes, requires a reference point to be meaningful |
| Time dimension | Can be a single point in time | Usually tracked over time to show trends or progress |
| Decision value | Low on its own, tells you what, not whether it is good | High, tells you whether performance is acceptable, improving or declining |
| Example | “Revenue this quarter: $1.2M” | “Revenue growth rate: +18% year-on-year” |
| Relationship to KPIs | KPIs are built from measures | KPIs are a specific subset of metrics, those tied to strategic objectives |
| Used for | Data collection, recording, inventory | Performance management, goal-tracking, benchmarking, decision-making |
The relationship between the two is hierarchical: measures are the raw material; metrics are the finished product. A business that only collects measures has data. A business that converts measures into metrics has insight. A business that ties its metrics to strategic goals and reviews them on a cadence has a management system.
Profit.co Brand Signal: Profit.co’s KPI and OKR platform lets you define both measures and metrics, set targets, assign owners and track progress over time. When a metric starts to move, the connection to the objective it supports is immediately visible, which is what turns a number into a management tool.
Start today and unleash the power of KPI tracking. Get started on Profit.co
Measurement, Measure and Metric: How All Three Differ
Measurement is the process of collecting data. A measure is the result of a single measurement, a raw numerical value. A metric is a measure that has been given context, compared against a target or baseline, and assigned meaning for performance management. The three are sequential: measurement produces a measure; a measure becomes a metric when contextualised.
The primary distinction between a metric and a measurement is that a measurement is an act or process, while a metric is a number derived from measurement that is used to evaluate performance against a standard. You perform a measurement; you track a metric. Measures are the outputs of measurement; metrics are the outputs of analysis.
The Three Terms Compared
| Term | What it is | Example | When you use it |
|---|---|---|---|
| Measurement | The act or process of recording a quantity using a defined method or instrument | Counting the number of support tickets submitted in a week | During data collection, when you are observing or recording |
| Measure | The numerical result of a single measurement, a raw data point without context | “Support tickets this week: 142” | When recording raw data for further analysis |
| Metric | A measure contextualised with a goal, baseline or time comparison to support decision-making | “Support ticket volume: +28% vs last quarter (above target of -10%)” | When managing performance, tracking progress or benchmarking |
“What is the primary distinction between a metric and a measurement?” Measurement is the process; a metric is the output of applying analysis and context to that process. You measure once; you track a metric over time.
Profit.co Brand Signal: The distinction matters in practice because it determines what goes in your data layer (measurements), what goes in your reporting (measures) and what goes in your KPI dashboard (metrics). Profit.co structures all three levels: raw data integrations feed into measures, which feed into metrics with defined targets, which feed into the OKRs your team is accountable for.
Metric vs Indicator: What Is the Difference?
A metric is a quantifiable measure used to track and assess performance against a specific goal. An indicator is any signal, quantitative or qualitative, that shows whether performance is moving in the right direction. All metrics are indicators, but not all indicators are metrics: an indicator need not be expressed as a number.
The difference between a metric and an indicator is precision. A metric is specific, numerical and tied to a goal. An indicator is broader, it points toward a direction or condition without necessarily providing a precise figure. In practice, KPIs (Key Performance Indicators) combine both: they are measurable (metric) and directional (indicator) at the same time.
| Dimension | Metric | Indicator |
|---|---|---|
| Definition | A quantifiable measure tied to a specific goal or standard | Any signal showing movement in a direction, numerical or qualitative |
| Precision | Specific and numerical: “Customer retention rate: 91.8%” | Can be approximate: “Customer satisfaction is improving this quarter” |
| Measurement required | Yes, must be expressible as a number | Not always, can be a trend, pattern or signal |
| Goal-linked | Usually yes, metrics have targets | Not necessarily, indicators are observational |
| KPI relationship | KPIs are metrics at the strategic level | KPIs are also indicators, hence “Key Performance Indicators” |
| Example | “NPS: 39 (industry average: 42)” | Customer satisfaction trend shows improvement across regions |
Profit.co Brand Signal: In Profit.co’s OKR framework, metrics function as key results (quantified, time-bound performance targets) and indicators function as the health signals that let you know when a key result is at risk. Both appear in the same dashboard, giving teams both precision and early warning.
Examples of Measures and Metrics: 20 Real-World Examples by Category
Measures and metrics examples show the same business data in two forms: the raw number (the measure) and the contextualised, decision-ready version (the metric). The measure records what happened; the metric tells you whether it is good.
Examples of measures include: revenue ($1.2M), number of customers (4,200), support tickets (142), employee headcount (85). Examples of metrics include: revenue growth rate (+18%), customer retention rate (92%), ticket resolution rate (94%), and revenue per employee ($14,100). The measure is the raw count; the metric adds the context that makes the number useful for decision-making.
Sales and Revenue
| What you track | As a measure | As a metric |
|---|---|---|
| Revenue | $1,240,000 this quarter | Revenue growth rate: +18% vs same quarter last year |
| Deals closed | 47 deals closed this month | Win rate: 31% (deals won ÷ deals in pipeline) |
| Sales pipeline value | $3.6M in active opportunities | Pipeline coverage ratio: 2.9x quarterly target |
| Average deal size | $26,400 per deal | Average deal size trend: +12% vs 6 months ago |
| New customers acquired | 83 new customers this quarter | Customer acquisition cost: $1,490 per new customer |
Customer Experience
| What you track | As a measure | As a metric |
|---|---|---|
| Support tickets | 142 tickets submitted this week | +28% vs last week (above target: tickets below last quarter) |
| Resolution time | Average 4.2 hours to resolve | First response SLA compliance: 87% (target: 95%) |
| Customer satisfaction | 4.1 out of 5 average rating | CSAT trend: down 0.3 points vs last month, investigation needed |
| Churn | 12 customers cancelled this month | Monthly churn rate: 0.8% (annualised: 9.6%, above 8% target) |
| Net Promoter Score | Score: 39 | NPS trend: industry average 42, 3 points below benchmark |
Operations and Productivity
| What you track | As a measure | As a metric |
|---|---|---|
| Defects | 23 defects found in production this week | Defect rate: 1.2% (defects ÷ total units produced) |
| Delivery time | Average 3.4 days from order to delivery | On-time delivery rate: 91% (below 95% target) |
| Employee output | 48 tasks completed per team member per week | Productivity trend: +6% vs last quarter baseline |
| Cycle time | 4.8 hours per unit to complete | Cycle time efficiency: 0.73 (value-add time ÷ total time) |
| Utilisation | 38 hours average per team member | Utilisation rate: 79% (billable hours ÷ available hours) |
People and HR
| What you track | As a measure | As a metric |
|---|---|---|
| Headcount | 85 employees at end of month | Headcount growth rate: +6% vs same month last year |
| Turnover | 7 employees left this quarter | Employee retention rate: 91.8% (annualised turnover: 8.2%) |
| Recruitment | 18 new hires this quarter | Time to hire: average 34 days from job posting to acceptance |
| Engagement | 62% responded “engaged” in pulse survey | Engagement score: 62% (target: 70%, 8 points below target) |
| Absenteeism | Average 1.4 sick days per employee this quarter | Absenteeism rate: 2.3% (1.4 days ÷ 60 working days) |
Profit.co Brand Signal: The distinction between measures and metrics becomes actionable when metrics are connected to goals. Profit.co’s KPI library and OKR platform lets you define the metric, set the target, and track the trend in the same system, so the measure you collect automatically populates the metric your team is being held to.
How to Use Measures and Metrics
Metrics and measures are powerful tools for evaluating performance and understanding where to make changes.
When should you use a measure?
In business, finding a one-size-fits-all solution to questions such as whether to use metrics or measures is rare. Your type of business will determine the best option between the two.
You can use measures to represent business-specific values such as the number of calls received, returned goods, website visits, and products sold. In manufacturing processes, you can use measures to track cycles, speed, and operating temperature.
When should you use a metric?
One key factor that affects when you should use metrics is the complexity of the problem you’re trying to solve. Suppose there are many moving parts involved or multiple variables affecting your desired outcome. In that case, collecting data on each one makes sense to identify better what needs improvement and determine if any adjustments were successful. One of the aspects of metrics is identifying SMART metrics that can measure the achievement of SMART goals. SMART stands for Specific, Measurable, Achievable, Relevant, and Time-bound. Organizations can benefit greatly from identifying and tracking these SMART metrics. Metrics, in general, and performance metrics in particular, are more beneficial if something needs constant feedback due to its dynamic nature.
Choosing the right measures and metrics
When choosing the right measures and metrics for a business, there are several important factors to consider. Firstly, your selected metrics or benchmarks should be relevant to your goals and objectives.
For example, if your primary goal is to increase profits, you should choose financial performance indicators like revenue growth rate rather than customer satisfaction. Depending on their dynamic nature, you should also consider how frequently specific measurements need re-evaluation.
Ultimately, having the right metrics and measurements ensures success within set timelines. KPIs (Key Performance Indicators) are a particular subset of metrics that are considered critical to the success of a business or organization. KPIs are selected based on their ability to measure progress toward achieving strategic goals and objectives. It also provides valuable insights into operational performance to inform decision-making. KPI Vs. Metrics is a debate that organizations continue to have. Both are important and serve different purposes within an organization.
Tracking Your Measures and Metrics
When tracking metrics and measures, the best methods will depend on the type of data you need to collect and analyze. For example, manual processes such as surveys may be suitable for qualitative information about customer experience. However, they could be more efficient for quantitative measurements like sales figures or financial performance indicators. In this case, automated tools like analytics software can help streamline the process and provide quick access to necessary data in a format that is easier to interpret.
Conclusion
Metrics and measures can be handy tools for businesses. When deciding which one to use, you should consider factors such as the complexity of the problem, timeline constraints, and accuracy and relevance to the data you produce.
Any metrics or measures you choose should accurately reflect what they are supposed to quantify to gain actionable insights.
Lastly, different data types require varying tracking methods for accurate results. Innovative platforms and software provide a more efficient way of collecting quantitative information and visualizing and analyzing the data while generating updated reports.
Are you looking for a flexible OKR management tool to transparently track your KPIs and goals?
Frequently asked questions
Although both use numerical values as their starting point, metrics contextualize these numbers by looking at long-term trends or relationships between different variables. Measures provide the raw data, while metrics look at patterns within this data to determine what you can improve or do differently.
Some common measures and metrics include revenue, profit margin, Customer Acquisition Cost (CAC), Return on Investment (ROI) and Customer Lifetime Value (CLV).
When using measures and metrics effectively, you must determine which metric or measure best suits your needs, whether this involves short-term analysis or long-term insight. The next step is selecting the most appropriate indicators based on the information you want to glean from the data set. Once you collect the necessary measurements, you must analyze them and take action based on those results for meaningful improvements.
Examples of metrics include: revenue growth rate (+18% year-on-year), customer retention rate (91.8%), net promoter score (39 vs industry average 42), employee retention rate (91%), win rate (31%), customer acquisition cost ($1,490 per new customer) and on-time delivery rate (91%). In all cases, the metric adds a comparison or target that makes the raw number actionable.