Metrics are the units of measurement used to track business activity. Key metrics – also called KPIs (Key Performance Indicators) – are the specific metrics tied to your organisation’s critical objectives, measured against predetermined targets. The difference: a metric tells you what happened; a key metric tells you whether it matters and what you should do about it. Not all metrics are key metrics – most are background data used to diagnose, not to decide.
In this guide
- What Are Metrics in Business?
- 7 Types of Metrics
- What Are Key Metrics?
- Key Metrics Meaning: Plain-Language Definitions
- 7 Reasons Why Key Metrics Are Important
- 5 Key Metrics to Track: Examples and Importance
- Key Metrics by Business Function: Sales and HR
- Metrics – Frequently Asked Questions
TL;DR – Metrics are raw measurement units. Key metrics are the subset tied to critical objectives, measured against targets, and used to make decisions. Most organisations track too many metrics and too few genuine key metrics. This guide covers the 7 metric types, the difference between metrics and KPIs in plain language, 5 universal key metrics with examples, and function-specific key metric tables for Sales and HR with real-world application examples.
An organization can make unprecedented growth and progress, or lack overall business health. But regardless of whether the organization is performing well or not, they are not run on perception alone. They are run based on insights derived from the analysis of vast amounts of data collected by tracking and measuring the various parameters that indicate the performance and health of the organization.
You need proof of your growth, success, or failure when you run an organization. Only when you measure various parameters that help you build a big picture of where you stand and how you fare can you identify your priorities and areas you need to focus on. Your action plans depend on that, too. To measure these parameters methodically, you need metrics.
What are metrics in business?
Metrics are the units of measurement that you need to measure the overall business health of your organization. A metric is usually a standalone unit of measurement that does not denote a complete picture or an aspect of an organization’s performance.
In simple terms, the metrics are akin to an assortment of raw materials lying within a manufacturing facility that makes different products. To make a product, you need to use suitable raw materials in the correct proportion using the right processes. A raw material itself can never be a functional finished product. It is only useful as an ingredient, just like a metric. A metric is a single statistic that does not give any meaningful insight. It needs to be compared with other parameters and combined with relevant business metrics to build any meaningful understanding or interpretation. All metrics are not created equal, and the significance of each may vary for every business. You can choose the metrics that are relevant to your business.
7 Types of Metrics
Following are the different types of metrics used in business to measure various parameters:
Goal Metrics
Goal metrics, as the name suggests, are used to measure the organization’s performance, goals, and strategy. They help you to constantly evaluate your goals and strategy and optimize the process of goal setting and strategic management. Goal metrics define how a goal will be measured. For instance, the performance of an email marketing campaign can be measured using the goal metrics of click-through rate.
Amount metric
A monetary value, either in the form of an integer or decimal value.
Count metric
The number of units, usually an integer value.
Quantitative Metrics
Quantitative metrics are numerically measured and are usually calculated using a specific formula. They can be financial metrics such as revenue or gross profit or non-financial metrics such as organic traffic to the website or the number of units sold.
Qualitative Metrics
Qualitative metrics are the metrics that do not measure anything in terms of numerical values. They are usually based on subjective human judgment. For example, customer experience in an e-commerce site is an immeasurable factor that is still crucial for the business’s success. It is compiled from the feedback of the customers regarding their experience in various areas, such as website design, ease of using your site, product pricing, ease of checkout, multiple payment options, etc.
Actionable Metrics
The metrics that are used for improving and optimizing work or for decision making are called actionable metrics. These are the metrics whose results are directly tied to specific actions. Actionable metrics indicate what is working and what is not working in your operations and dictate what you need to do to correct, improve, or mitigate the work.
Vanity Metrics
Some metrics are designed to make you feel good but do not carry any significance as indicators of progress or the state of your business. They are rightly called vanity metrics. For example, if you are running an e-commerce business, and the number of visitors to your site per day is high, it can give you the grand illusion that consumers like your brand. But this metric means nothing if the traffic is high but conversion, which is more important for an e-commerce business, is low.
Informational Metrics
Informational metrics, as the name suggests, are metrics that convey information that does not determine actions or measure goals. They just provide some inconsequential yet interesting information. For example, counters on websites that denote the total number of visitors who have visited your site so far give a piece of interesting information. But it does not carry any other significance. For example, the number of visitors a site attracts does not directly impact the business.
Key Metrics
Key metrics are the ones that stand out as business-critical metrics used to measure the organization’s goals. Key metrics are important for your strategy – they are tied to specific targeted objectives, measured against predetermined targets, and used to make management decisions that other metric types are not.
What are key metrics?
Key metrics or key performance indicators (KPI) are used to measure the performance of business-critical initiatives, processes, or objectives. Unlike metrics, key metrics are usually tied to specific targeted objectives and are measured against predetermined goals. They act as benchmarks and indicators for various aspects of the performance of an organization. Unlike metrics, key metrics are not necessarily standalone units of measurement; they can be derived by combining multiple metrics.
For instance, the sales conversion rate for an eCommerce business is a key metric calculated by dividing the metric — ‘number of sales’ — by another metric, ‘Number of users’ multiplied by 100. These two metrics in isolation do not measure or indicate a business-critical performance parameter. But the key metric of sales conversion ratio, obtained by combining those two metrics using a formula, gives a real picture of sales performance. How much of your user base in your online store actually makes a purchase helps you determine the effectiveness of your strategy. If the number of sales is 1000, but if you have nearly a million users on your site, it may still be deemed a failure. This is the kind of meaningful insights you can get by measuring relevant key metrics.
Key metrics compare and combine various metrics to build insights that can help you identify gaps and larger organizational problems that are not visible to the bare eyes. Every organization may have different objectives and priorities. In accordance with that, what is critical to their business also varies; as a result, the key metrics they need to track may also vary.
Key Metrics Meaning: Plain-Language Definitions
The term “key metrics” is used differently across industries, teams, and tools – often interchangeably with KPI, measure, or indicator. The definitions below clarify exactly what each term means in a business context, so you can select, label, and communicate metrics with precision. For the comprehensive guide to what KPIs are and how they differ from metrics structurally, the full guide covers every component in detail.
| Term | Plain-Language Meaning | Example |
|---|---|---|
| Metric | Any quantifiable measure used to track a business activity. A metric is a raw data point – it tells you what happened, not whether it matters. | Number of website visitors this week: 12,400 |
| Key metric | A metric that is critical to your business objectives – tied to a specific goal, measured against a target, and used to make decisions. Not all metrics are key metrics; most metrics are background data. | Trial-to-paid conversion rate: 21.7% vs 24% target |
| KPI (Key Performance Indicator) | KPI and key metric are used interchangeably in most business contexts. Technically, a KPI measures performance against a defined target – the “indicator” element means it signals progress toward a strategic goal. | On-time delivery rate: 97.1% vs 97% target – KPI is Green |
| Leading indicator | A key metric that predicts a future outcome – it changes before the outcome you care about changes. Leading indicators give you time to act before a problem becomes a result. | Sales pipeline coverage ratio: 3.1x (predicts whether quarterly revenue target is achievable) |
| Lagging indicator | A key metric that confirms an outcome after it has occurred. Lagging indicators tell you what happened – they are useful for reporting but not for intervention. | Annual revenue: $5.8M (confirms whether the year’s sales target was met) |
| Vanity metric | A metric that looks positive but does not indicate whether the business is moving toward its goals. Vanity metrics produce reporting that feels good but does not drive decisions. | Total social media followers: 48,000 (large number, but no connection to revenue, retention, or growth) |
| Diagnostic metric | A metric used to explain why a key metric moved – not tracked as a primary KPI but monitored when a key metric shows an unexpected change. | Conversion rate by traffic source (explains why overall conversion rate dropped when a specific channel underperformed) |
| Baseline | The starting value of a key metric at the beginning of a measurement period – used as the reference point against which progress is measured. | Voluntary attrition rate at start of Q1: 13.4% – this is the baseline the HR team is working to improve |
The test for any key metric
“If this number changes, does it tell me something I need to act on?” If the answer is no – or “it depends on other things” – it is a diagnostic metric or a vanity metric, not a KPI. Move it to a supporting data view rather than your active tracking dashboard.
Ready to start your OKR Journey for FREE?
7 Reasons Why Key Metrics Are Important
- ✓
The performance of a data-driven organization needs to be constantly monitored and optimized scientifically to remain successful. It requires a careful selection and monitoring of key metrics that are relevant to their organization.
- ✓
Key metrics help you measure progress and create action plans to optimize your operations.
- ✓
They help you verify performance, quantify the growth of your organization in key areas, and pinpoint issues.
- ✓
They help you identify the important factors that contribute to your success and let you reinforce those areas to sustain your growth.
- ✓
Key metrics enable you to achieve your fiscal goals and ensure the success of your strategy.
- ✓
They provide actionable insights that can help you improve your business performance, goal-setting, and achievement of goals.
- ✓
Key metrics help you make better decisions based on facts and data and steer your organization and operations in the right direction. Failing to measure these key metrics can lead to bad decisions and, ultimately, failures.
5 Key Metrics to Track: Examples and Importance
There are many key metrics that an organization may need to track for an overall understanding of performance in various key areas. Organizations are unique, and depending on important critical objectives, the choice of key metrics varies. Following are some examples of key metrics.
Sales Growth Rate
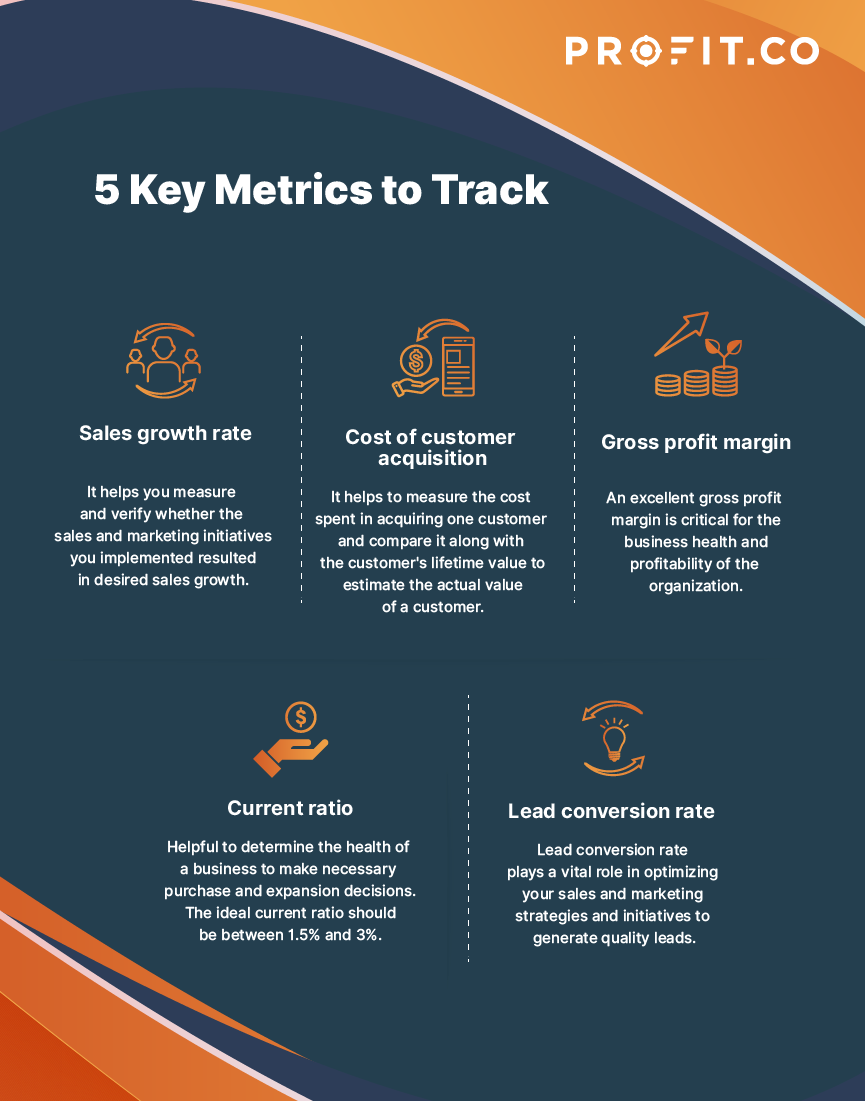
Every company exists to sell products or services. So, the organization’s growth is directly linked to the growth in sales. The sales growth rate is a key metric that measures the increase in the number of sales between two months or years. This comparison helps you measure and verify whether the sales and marketing initiatives you implemented resulted in desired sales growth. Sales growth rate is one of the essential KPIs to incorporate into your sales reports and dashboards to validate the effectiveness of your branding, sales strategy, marketing strategy, and product launches.
Cost of Customer Acquisition
The customer acquisition cost is a key metric that measures the cost spent in acquiring one customer. However, the cost of customer acquisition cannot be calculated by simply dividing the cost spent in a particular period by the number of customers acquired during the same time. This is because a customer may buy products worth $20 or $2000; the customer may also buy any number of times at various points of time. The worth of a customer varies according to how much he/she spends purchasing from you in the long term. So, the cost of customer acquisition should be measured along with the customer lifetime value. Ideally, the cost of customer acquisition is good when the customers are retained and when they make multiple purchases, and the total value of the purchases is far more than the cost spent on acquiring one customer.
Gross Profit Margin
The primary objective of any business is to generate profits, and having a good gross profit margin is key for the business health and profitability of the organization. Gross profit margin is a key indicator to measure your business’s financial performance. Gross profit margin shows you the profit you get from your total revenue after subtracting the costs incurred during the production. This key metric is derived by subtracting the cost of goods sold from the total revenue of your business, divided by the total revenue. Ideally, the gross profit margin of a company should provide adequate profits after covering all the operating costs.
Current Ratio
Acquiring new assets and purchasing business-critical equipment and facilities require healthy liquidity. Only if you have liquidity then can you raise funds to make these purchases. Creditors approached for a loan will also consider the loan only based on the ability to repay by measuring the liquidity of the organization using the key metric, ‘current ratio’. To calculate the current ratio, you need two metrics – current liabilities and current assets. Current assets are liquid assets that can be converted into cash within a year. Similarly, current liabilities or debts that you can repay within a year. The current ratio is obtained by dividing current assets by current liabilities. The ideal current ratio should be between 1.5% and 3%.
Lead Conversion Rate
Your marketing team may be conducting successful campaigns and generating a healthy number of leads. But the number of leads you get is meaningless if most of them don’t purchase from you. So, the lead conversion rate is an important key metric that determines the effectiveness of your sales team and their ability to convert leads into customers. It can also help you verify whether your marketing efforts are generating quality leads or not. Lead conversion rate plays an important role in optimizing your sales and marketing strategies and initiatives to generate quality leads. Lead conversion rate can be calculated by dividing the total number of conversions by the total number of leads generated, multiplied by 100. The more your leads convert into sales the more effective your sales and marketing teams are.
Key Metrics by Business Function: Examples Across Sales and HR
The five general key metrics above illustrate the concept. In practice, the key metrics that matter most are function-specific – a sales team’s critical indicators are structurally different from an HR team’s, even within the same organisation. The sections below provide the most commonly tracked key metrics for two core business functions, with definitions and real usage context for each. For a broader view of OKRs vs KPIs and how they complement each other in a goal framework, the full guide covers how each connects to organisational strategy.
Sales Key Metrics
Sales key metrics measure whether the organisation is acquiring, converting, and retaining revenue at the rate required to meet its growth objectives. The most decision-relevant sales metrics combine activity data (pipeline volume, outreach) with outcome data (closed revenue, retention).
| Key Metric | What It Measures | Leading or Lagging? |
|---|---|---|
| Monthly Recurring Revenue (MRR) | Total predictable revenue generated each month from active subscriptions or contracts | Lagging |
| Trial-to-Paid Conversion Rate | Percentage of free trial users who convert to paying customers – a leading indicator of revenue growth | Leading |
| Average Sales Cycle (days) | Time from first contact to closed deal – shorter cycles indicate better qualification and sales process efficiency | Leading |
| Pipeline Coverage Ratio | Total pipeline value divided by revenue target – a 3x ratio is typically considered healthy for most B2B sales teams | Leading |
| Net Revenue Retention (NRR) | Revenue retained from existing customers after accounting for churn, downgrades, and expansion – above 100% means growth from existing customers alone | Lagging |
In practice at Meridian Software
Kavya Nair’s sales team tracks trial-to-paid conversion rate weekly (leading indicator) and enterprise ARR quarterly (lagging indicator). The leading metric gives the team enough signal to intervene – adjusting onboarding, outreach, or product positioning – before the quarterly ARR target is missed. Without the leading indicator, the team would only discover a problem at quarter-end when it was too late to course-correct.
HR Key Metrics
HR key metrics measure whether the organisation is attracting, developing, and retaining the talent it needs to execute its strategy. The most actionable HR metrics are those that give managers time to intervene before attrition, disengagement, or capability gaps become performance problems.
| Key Metric | What It Measures | Leading or Lagging? |
|---|---|---|
| Voluntary Attrition Rate | Percentage of employees who leave voluntarily in a given period – high voluntary attrition signals culture, management, or compensation issues | Lagging |
| Employee Net Promoter Score (eNPS) | How likely employees are to recommend the organisation as a place to work – a leading indicator of voluntary attrition | Leading |
| Time to Hire (days) | Average days from job posting to accepted offer – longer cycles indicate sourcing, screening, or decision-making inefficiencies | Leading |
| Performance Review Completion Rate | Percentage of scheduled reviews completed on time – low completion rates indicate manager bandwidth issues or low process priority | Leading |
| Internal Promotion Rate | Percentage of open senior roles filled by internal candidates – a measure of talent development effectiveness and a leading indicator of retention | Leading |
In practice at Clearfield Group
Priya Sharma tracks voluntary attrition (lagging – confirms employees have left) and eNPS (leading – signals flight risk before departure). The eNPS trend allowed her to identify and intervene with at-risk employees in Q2, contributing to attrition falling from 13.4% to 10.8% annualised. The lagging metric told her where the organisation had been; the leading metric told her where it was going.
The most common key metric selection mistake: tracking only lagging indicators. Lagging metrics confirm what happened. Leading metrics give you time to change what will happen. Every key metric dashboard should include both types for every function it covers.
Final Thoughts
Organizations can have a great strategy and objectives aligned with every department. The strategy remains ineffective unless the objectives are assigned to key results with measurable metrics that are periodically tracked. Key metrics play a crucial role in every organization’s success. They trace the performance of initiatives, help managers define what success looks like, and ensure that the team is moving in the right direction. Profit.co’s OKR software comes preloaded with over 400 KPIs and metrics that can help you measure your progress and meet your business’s short- and long-term goals.
Learn more about how Profit.co can help your team
Metrics – Frequently Asked Questions
You can identify key metrics relevant to your business by choosing KPIs linked to your business goals. Apply the test: “If this number changes, does it tell me something I need to act on?” If the answer is yes, it is a candidate key metric. Also distinguish between leading indicators (which predict future outcomes and give you time to act) and lagging indicators (which confirm what has already happened). A strong key metric set includes both types.
Key business metrics are used to measure the performance of business-critical initiatives, processes, or objectives. They are tied to specific targeted goals, measured against predetermined targets, and used to make management decisions. Unlike general metrics, key metrics are not necessarily standalone measurements – they can be derived by combining multiple metrics to produce a meaningful business indicator.
Metrics are standalone units of measurement that indicate the overall business health of your organization, but not a complete picture or an aspect of an organization’s performance. In contrast, key metrics act as benchmarks and indicators for various aspects of the performance of an organization. They are usually tied to specific targeted objectives and can be derived by combining multiple metrics. KPIs and key metrics are used interchangeably in most business contexts – technically, a KPI adds a performance target against which the key metric is scored. For the full comparison, see OKRs vs KPIs.
The seven types of metrics are: Goal metrics (measure strategy and performance goals), Quantitative metrics (numerically measured using formulas), Qualitative metrics (based on subjective human judgment), Actionable metrics (tied directly to specific actions and decisions), Vanity metrics (look positive but don’t indicate business progress), Informational metrics (provide background context without determining actions), and Key metrics (business-critical indicators tied to specific objectives and targets).
A leading indicator is a key metric that predicts a future outcome – it changes before the outcome you care about changes, giving you time to act before a problem becomes a result. A lagging indicator confirms an outcome after it has occurred – it is useful for reporting and retrospective analysis but does not give you time to intervene. For example, eNPS is a leading indicator of voluntary attrition (it signals flight risk before employees leave), while voluntary attrition rate itself is a lagging indicator (it confirms employees have already left). Strong key metric dashboards track both types for every function.