Introduction
Metrics dashboards are an asset to businesses as they help to track the progress toward goals accurately. These dashboards enable centralized and easy-to-use interfaces for monitoring key performance indicators (KPIs) and other important data, making it easy to identify trends and patterns that impact the business.
Dashboards can also help to improve communication and collaboration within a team or organization by providing a common language of understanding and can be used to automate the reporting process, saving time and reducing the risk of errors.
Let’s discuss metrics dashboards, their importance, and how to build and customize your dashboard.
What Are Metrics?
Metrics are quantitative measures that track and evaluate performance and progress and help identify areas for improvement. Metrics can measure many things, including financial performance, customer satisfaction, employee engagement strategies and operational efficiency. Metrics are vital to effective and smart decision-making.
Metrics provide an objective way to evaluate results for smarter decision-making.
What is a Metrics Dashboard?
A metrics dashboard is an intuitive visual tool that easily tracks key performance indicators (KPIs). It provides an overview of the data in one place, ensuring quick comparison and analysis.
Metrics dashboards consist of charts, graphs, tables, or other visuals that make it easier to understand trends and data patterns. Besides tracking KPIs and metrics, these dashboards allow effective collaboration since all team members can access the same dashboard view.
Importance of Metrics Dashboard
There are numerous benefits of using a metrics dashboard. The centralized access to data empowers data-driven decisions that enhance performance.
The insights from dashboard metrics enable tracking the progress towards your goals. You can leverage KPIs to measure how well you are achieving your objectives. The dashboard ensures easy access to these metrics, making it easier to assess progress and take the necessary action.
Multiple teams within an organization can also share information quickly and collaborate more effectively on projects. Ultimately, using a metrics dashboard is an excellent way to measure success and maintain a competitive edge accurately.
Are you looking for a flexible OKR management tool to transparently track your KPIs and goals? You can get started on Profit.co today completely free!
How to Build a Metrics Dashboard
Choosing reliable and updated data sources is crucial when building a metrics or KPI Dashboard. Having the right data provides meaningful insights into key performance indicators and other focus areas for your business.
You can source data from external sources such as web analytics tools and market research surveys. Remember to include internal sources like financial records and customer databases for accurate analysis.
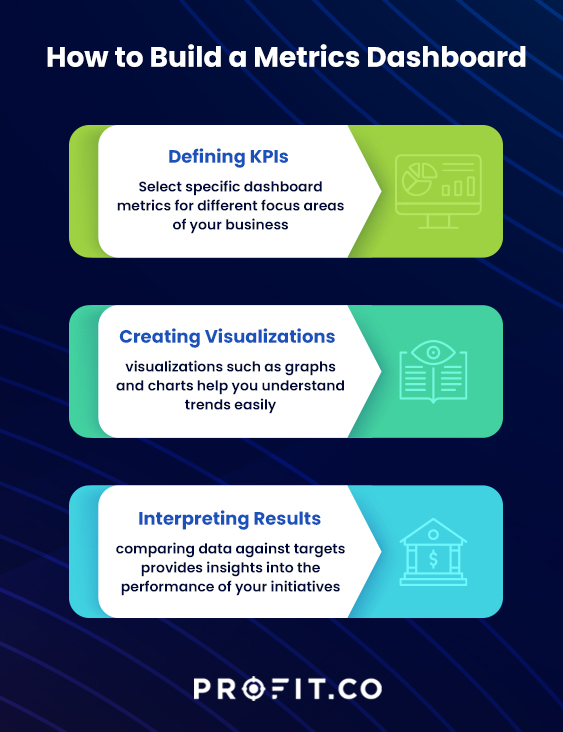
- Defining KPIs
Once you identify reliable data sources, the next step is defining the KPIs to track using the dashboard. Identifying the most critical metrics for your business or organization, such as revenue, customer retention, or website traffic. Select specific dashboard metrics for different focus areas relevant to your business.
- Creating Visualizations
With the right KPIs, it’s easy to create visualizations such as graphs and charts on the dashboard. These visualizations help you understand trends in the data without manually analyzing every metric individually.
- Interpreting Results
After adding the necessary components to your metrics dashboard, you can look for trends across various KPIs. Comparing these figures against targets provides real-time insights into the performance of your initiatives.
In business, the idea of measuring what you are doing, picking the measurements that count like customer satisfaction and performance… you thrive on that.

How to Customize Your Metrics Dashboard
The first step when customizing your metrics dashboard is organizing it in a way that makes sense for you and your team. Consider the information you need to include and how to group it so your team members can easily find related data points.
You can organize the dashboard metrics into operational efficiency and customer satisfaction categories. You can also manage them by individual KPIs in each category, depending on the level of detail you need. Adding search functions and filters is wise to allow swift access to specific data sets.
- Selecting the Right Metrics
After organizing your dashboard into different sections, you need to prioritize the metrics based on importance. It’s best to choose the crucial metrics based on relevance and accuracy.
- Visualizing Your Data
Once you have the relevant metrics in each dashboard section, you can create visualizations. The visuals you choose depend on the information you need to present.
Metrics Dashboard Examples
You can use different metrics dashboards, depending on the metrics you intend to track. For instance, if you want to monitor marketing performance, you can leverage popular tools such as Google Analytics.
With a robust tool such as Profit.co’s comprehensive dashboard, you can track metrics from all aspects of your business.
FAQs
- What is a metrics dashboard?
A metrics dashboard is an interactive visual representation of KPIs and other relevant data. It simplifies identifying trends, patterns, and improvement opportunities.
- How can I create a custom metric dashboard?
- Creating a custom metric dashboard involves several steps, including:
- Selecting the suitable data sources
- Defining key performance indicators (KPIs)
- Creating visuals such as charts and graphs
- Interpreting results from analysis over time
- Organizing the information in a way that makes sense for you and your team
- What are the benefits of using metrics dashboards?
The main benefit of using a metrics dashboard is simplifying complex data. Visualizing the important KPIs saves you time and resources by eliminating the need to analyze each metric manually.
These dashboards also promote collaboration between different teams. Everyone remains updated on performance, making it easier to achieve the overall goals.
Conclusion
Creating and customizing your own is the best way to enjoy a metrics dashboard. Innovative platforms such as Profit.co OKR Software is easy to use and comprehensive, so you don’t need additional tools. Following the steps will ensure maximum engagement and gain actionable insights to propel your business toward success.