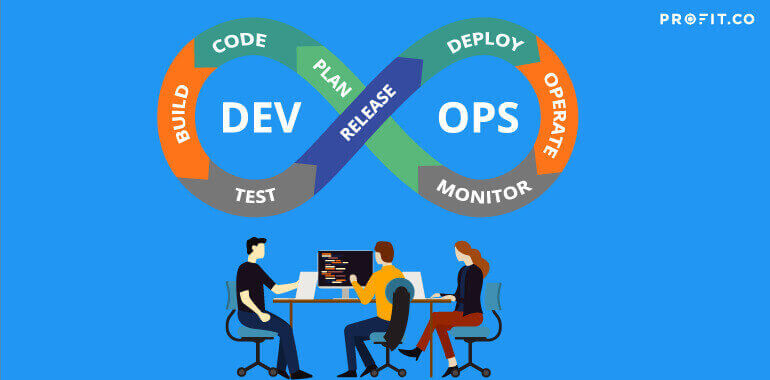
DevOps is a combination of “development” and “operations” which incorporates both agile practices and tools to increase an organization’s ability to deliver applications and services faster than traditional software development processes to be more responsive to the ever-changing consumer needs.
DevOps strives to streamline an organization’s technical execution ability to develop and improve software features, quickly and efficiently. Devops paves the way for the digital transformation of industries. Devops drives business outcomes as it transforms the way business delivers software with a constant emphasis on delivering user value.
The overall pace of software development has increased with DevOps and teams are now automating integration and testing, and deploying software in the cloud with quick timelines and continuous delivery. With DevOps, there’s more to monitor now, from integration, provisioning, to deployment, and so teams can align DevOps monitoring strategies to OKRs to effectively monitor different aspects of the project.
OKRs, or Objectives and Key Results, is a goal-setting framework that can help highlight priority items in your department and organization and offer focus and alignment for teams and companies. OKRs implemented to track the success of DevOps initiatives, communicates the objectives in a consequential way to your organization.
Using OKRs to help drive progress in your DevOps department can make a huge impact in focus and productivity.
In this article, we’ll take a look at some of the examples of OKRs for DevOps that capture the priorities of the department as well as the key KPIs and metrics that should be kept in mind when creating quarterly targets and outlining initiatives. Read these examples, and use them as a launch point to identify your own business’s priorities and create OKRs to drive progress in your DevOps department.
#1: Sprint Planning
The purpose of sprint planning is to define what can be delivered in the sprint and how that work will be achieved. The product owner describes the objective(or goal) of the sprint and what backlog items contribute to that goal.
| Objective | Improve the sprint planning process |
|---|---|
| Key Result 1 | Have acceptance criteria defined for at least 90% of the stories in the backlog |
| Key Result 2 | Size the backlog items at least 3 days before sprint planning (KPI – Lead Time for backlogs) |
| Key Result 3 | Achieve the Sprint Goal confidence voting of at least 4 |
 Objective
Improve the sprint planning process
Target Date: Q1-2022
Visibility: All Employees
 Key Results
Have acceptance criteria defined for at least 90% of the stories in the backlog
Size the backlog items at least 3 days before sprint planning
Achieve the Sprint Goal confidence voting of at least 4
#2: Sprint Execution
The outcome of Sprint Execution is a potentially shippable product increment, formed from a list of product backlog items by meeting the team members’ definition of done. Efficiency in sprint execution leads to faster time to market.
| Objective | Improve sprint execution |
|---|---|
| Key Result 1 | Deviation in Sprint Burndown Chart doesn’t exceed 15% |
| Key Result 2 | Reduce carry over story points every sprint from 8 to 0 across PODs |
| Key Result 3 | Spike stories to minimize estimation variability by 10% |
Objective
Improve sprint execution
Target Date: Q1-2022
Visibility: All Employees
Key Results
Deviation in Sprint Burndown Chart doesn’t exceed 15%
Reduce carry over story points every sprint from 8 to 0 across PODs
Spike stories to minimize estimation variability by 10%
#3: Tech Debt
Technical debt is the calculation of future costs attributable to known design or architectural flaws in the product that needs to be fixed. Accounting for stories gives enough time to develop code that is maintainable, extensible, or reusable that helps to reduce tech debt in the long run.
| Objective | Strive for technical debt neutral development |
|---|---|
| Key Result 1 | Implement API led connectivity strategy for technical debt management |
| Key Result 2 | No additional story points are added to tech debt every sprint |
| Key Result 3 | Reduce Tech Debt Ratio (TDR) from 20% to 5% |
Objective
Strive for technical debt neutral development
Target Date: Q1-2022
Visibility: All Employees
Key Results
Implement API led connectivity strategy for technical debt management
No additional story points are added to tech debt every sprint
Reduce Tech Debt Ratio (TDR) from 20% to 5%
#4: Product Development
Product development is an iterative logical process that aims to build a programmed software product to mark a unique personal or business goal, process, or objective.
| Objective | Improve performance of the application |
|---|---|
| Key Result 1 | Reduce the LCP (Largest Contentful Paint) from 4367ms to 2500 ms |
| Key Result 2 | Maintain FID (First input delay) to be less than 100 milliseconds |
| Key Result 3 | Maintain CLS (Cumulative Layout Shift) to be less than 0.1 |
Objective
Improve performance of the application
Target Date: Q1-2022
Visibility: All Employees
Key Results
Reduce the LCP (Largest Contentful Paint) from 4367ms to 2500 ms
Maintain FID (First input delay) to be less than 100 milliseconds
Maintain CLS (Cumulative Layout Shift) to be less than 0.1
#5: Code Quality
Code quality refers to the usefulness and maintainability of the code in the long term, helping to measure the efficiency of engineers and to reduce the tech debt.
| Objective | Make app sustainable through improved code quality |
|---|---|
| Key Result 1 | Implement SonarQube for inspecting code quality by Q1 |
| Key Result 2 | Refactor legacy code in 2 modules every sprint to replace repetitive lines of code |
| Key Result 3 | Reduce style book violations upto 20% by configuring a linter in the pipeline |
| Key Result 4 | Maintain cyclomatic complexity of the code at less than 10 |
Objective
Make app sustainable through improved code quality
Target Date: Annual-2022
Visibility: All Employees
Key Results
Implement SonarQube for inspecting code quality by Q1
Refactor legacy code in 2 modules every sprint to replace repetitive lines of code
Reduce style book violations upto 20% by configuring a linter in the pipeline
Maintain cyclomatic complexity of the code at less than 10
#6:POD Velocity
Velocity is a key DevOps metric that measures the amount of work a team can deliver during a sprint.
| Objective | Improve POD speed without compromising on quality |
|---|---|
| Key Result 1 | Minimize variability in story point estimation by 10% every sprint |
| Key Result 2 | Reduce average defects per release from 5 to 2 |
| Key Result 3 | Achieve sprint velocity of 80 points |
Objective
Improve POD speed without compromising on quality
Target Date: Q1-2022
Visibility: All Employees
Key Results
Minimize variability in story point estimation by 10% every sprint
Reduce average defects per release from 5 to 2
Achieve sprint velocity of 80 points
#7: Continuous Testing
Preventing defect leakage thereby identifying bugs early in the testing phase improves the quality of the testing process to improve quality and so on.
| Objective | Improve testing process to reduce defect leakage |
|---|---|
| Key Result 1 | Increase functional test coverage from 85% to 99% per project |
| Key Result 2 | Increase automated testing scripts from 65% to 90% post release |
| Key Result 3 | Decrease average mean time to identify a defect early in the testing phase from 60 mins to 30 mins |
Objective
Improve testing process to reduce defect leakage
Target Date: Annual-2022
Visibility: All Employees
Key Results
Increase functional test coverage from 85% to 99% per project
Increase automated testing scripts from 65% to 90% post release
Decrease average mean time to identify a defect early in the testing phase from 60 mins to 30 mins
#8: Continuous Integration (CI)/ Continuous Delivery/ Deployment (CD)
CI/CD is a method to frequently deliver apps to customers by introducing automation into the stages of app development.
| Objective | Improve deployment process |
|---|---|
| Key Result 1 | Create parallel testing environments by M1 to enable CI/CD |
| Key Result 2 | Decrease lead time to deploy from 8 hours to 30 mins |
| Key Result 3 | Not more than 2 queued builds during business hours |
| Key Result 4 | Increase the capacity of pipeline to handle simultaneous deployments from 2 to 5 |
Objective
Improve deployment process
Target Date: Annual-2022
Visibility: All Employees
Key Results
Create parallel testing environments by M1 to enable CI/CD
Decrease lead time to deploy from 8 hours to 30 mins
Not more than 2 queued builds during business hours
Increase the capacity of pipeline to handle simultaneous deployments from 2 to 5
#9: Configuration Management
Configuration management is the process in which organizations and development teams oversee new software updates to ensure they are working as designed when bugs are fixed, new features are introduced and old features are decommissioned.
| Objective | Increase efficiency with a defined configuration process |
|---|---|
| Key Result 1 | Proactive identification of configuration errors through 3 CMS audits |
| Key Result 2 | Increase the frequency of physical verification of CMS contents from 1 to 3 per quarter |
| Key Result 3 | Reduce release downtime cost from $50k to $12k |
Objective
Increase efficiency with a defined configuration process
Target Date: Annual-2022
Visibility: All Employees
Key Results
Proactive identification of configuration errors through 3 CMS audits
Increase the frequency of physical verification of CMS contents from 1 to 3 per quarter
Reduce release downtime cost from $50k to $12k
#10: Release Management
Plan for OKRs that would strengthen the release management process by increasing the number of isolated releases, decreasing the number of emergency patches, and the number of rollbacks during the progress.
| Objective | Strengthen the release management process |
|---|---|
| Key Result 1 | Decrease the downtime during each release cycle from 30 mins to 5 mins |
| Key Result 2 | Decrease outages caused by a release from 2 to 0 |
| Key Result 3 | Decrease number of rollbacks from 3 to 0 per quarter |
Objective
Strengthen the release management process
Target Date: Annual-2022
Visibility: All Employees
Key Results
Decrease the downtime during each release cycle from 30 mins to 5 mins
Decrease outages caused by a release from 2 to 0
Decrease number of rollbacks from 3 to 0 per quarter
Conclusion
While your own business’ and department’s OKRs might look a little different depending on your priorities and initiatives, these Objective and Key Results serve as a good starting point to get you thinking about the goals you have for the upcoming quarter.
When tracking key DevOps metrics, a result that seems progressing well on its own could look completely different when aligned and tracked alongside with OKRs. Careful tracking of these devops OKRs can ensure not only greater efficiency in development and production, but more importantly, its alignment to the company’s objectives, thereby leading to delighted end-user experience. Embrace DevOps OKRs, and you could see vast improvements in application deployment and feedback.
Take a look at other departments’ priorities, as well as the corporate-level goals. What role does DevOps need to play to help these goals succeed?
For more information on how to write great OKRs, and more examples in other departments, don’t forget to check out our blog!
Profit.co is the best OKR software to get started with your OKR journey. Signup Now