Market research is fundamental to a good pitch or strategic plan, but the effectiveness of your research depends on how you conduct it. While knowing the market value of your industry is a good start, a detailed analysis of your fit within it will help you make solid, data driven business decisions. Establishing your total addressable market can not only help you win investors, but will also help you understand the growth potential of your business, and can drive your strategic decisions in more profitable directions.
What is your total addressable market?
Your total addressable market is how much of the market your business has the potential to capitalize on. It’s usually expressed in a dollar figure (revenue), but can also be calculated by your estimate of the number of customers you have the potential to attract. In a pitch, the estimate of your total addressable market is one of the things that helps convince investors that your business, when scaled properly, will make their investment worthwhile. But it’s important to make sure your calculation is data-driven and realistic, reflecting what your actual opportunities are rather than what you hope they might be.
Approaches to calculating total addressable market

There are three main ways to calculate total addressable market: top-down, bottom-up, and value-created:
- In a top-down calculation, you begin with the total market value of your product or service based on industry research and reports, then narrow that number down based on your specific business model.
- In a bottom-up approach, you begin with existing sales data and extrapolate from it to find your total addressable market.
- In a value-created approach, you determine the value your product or service brings to customers, and from there estimate how much of that value you can capture in revenue.
Here’s a more detailed breakdown of these three approaches, using the example of a blockchain development company that offers custom blockchain solutions for the financial services industry.
1. Top-Down
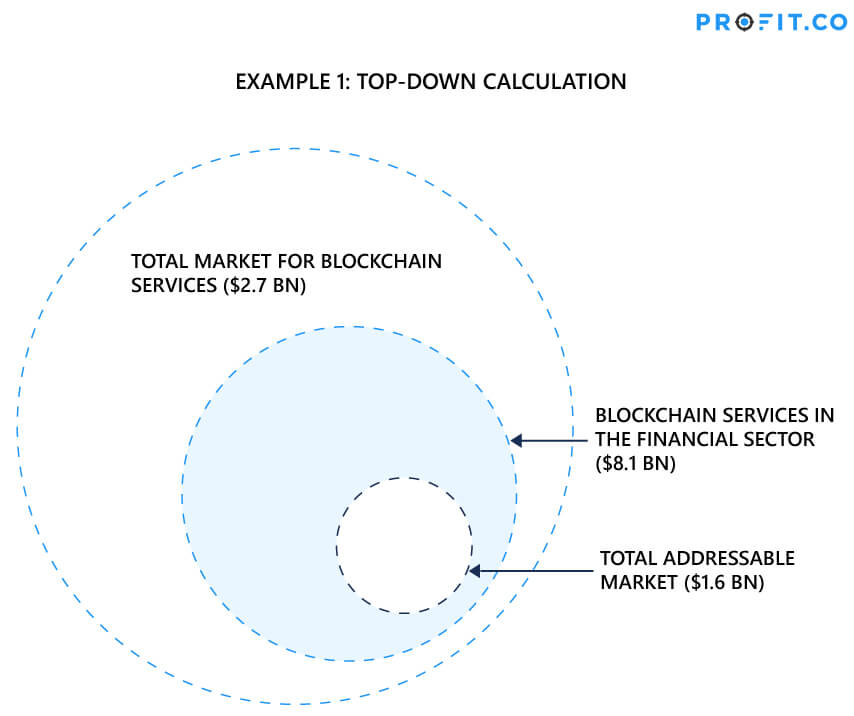
A top-down approach is one that uses existing market research to generate an estimate—so this approach might be a good choice for a company that is still in the development phase and doesn’t have much sales data yet. The downside of this approach is that often, data gathered for these surveys is self-reported. If you’re relying on statistical reports, you risk relying on inaccurate data.
Additionally, businesses with disruptive solutions can end up changing their own total addressable market. Uber, for example, created a service that not only competed with the existing market for chauffeured rides, but expanded it by offering a cheaper alternative to those who might not otherwise pay for one. If you’re offering something unique, a top-down approach can limit the way you think about your total addressable market.
In the blockchain example, a report from IDC projected worldwide spending on blockchain solutions to be $2.7bn USD in 2019. The forecast also stated that 30% of that spending would come from the financial sector; since our blockchain company is providing financial services, this narrows down their total addressable market to $810M. Estimating that their specific range of solutions comprises 20% of the blockchain tech market, the total addressable market for the company is $162M.
However, keep in mind that in all of these examples, there’s more than one way to calculate the total addressable market. For example, a blockchain company selling financial solutions could also calculate their total addressable market as a portion of the financial services application market, estimated at $79bn in 2018. Pwc’s Global Fintech Report for 2019 indicates that 41% of leaders in finance think that blockchain technology will drive change—so perhaps only 41% of financial companies would be open to investing in blockchain solutions, leaving a $32bn market share. Additionally, maybe only 20% of these companies can realistically incorporate blockchain technology in the first place, narrowing the number down further to $6.4bn.
There’s a huge difference between an estimated total addressable market of $162M and a total accessible market of $6.4bn. It’s important to decide on the market that you think most realistically fits with your business model and goals.
OKR #1 – Top-down approach to establish total addressable market
In this OKR, we’ll try to create an estimate of TAM using the top-down approach.

2. Bottom-Up

In a bottom-up approach, you use data from past sales to predict your future revenue streams. Using this approach is helpful if you have been in business for long enough to have sales data, or if potential customers have expressed interest in your product already. A bottom-up approach can also help you identify other markets for your business if you have multiple products and services.
A blockchain development company already in operation might provide custom financial solutions for approximately $10,000 per project. If they’re a small company with only a few developers on staff, maybe they are looking for an investor to help them scale—in this case, it might be best to use existing sales to calculate their total addressable market. For example, the CEO is looking to add a marketing and sales team to help them reach untapped markets, and given their market share, there are an estimated 15,000 businesses that are likely to buy their product. This gives them a total addressable market of $150M.
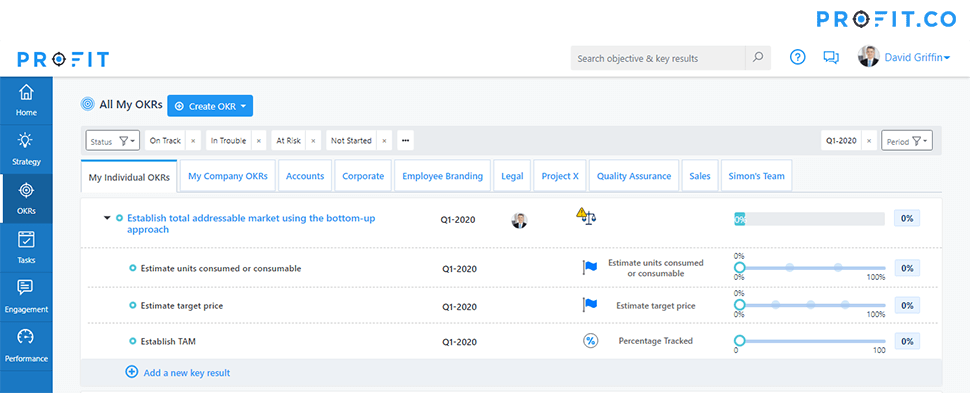
OKR #2 – Bottom-up approach to establish total addressable market
In this OKR, we’ll try to create an estimate of TAM using the bottom-up approach.
3. Value-Created

A value-created approach is useful when companies are looking to add products or services that might save customers money or help them increase revenue. The calculation for this approach is an estimate of how much of your customers’ savings or additional revenue you’ll be able to capture.
Say our blockchain development company has a solution with the potential to save a financial services company up to 20% of their administrative costs. If the total expenditure on these admin costs in the financial services market is $30bn, and the blockchain company hopes to capture 5% of these savings in revenue, their total addressable market is $300M.
OKR #3 – Value-created approach to establish total addressable market
In this OKR, we’ll try to create an estimate of TAM using the value-created approach.

Research methods: how to conduct research for TAM calculations
If you aren’t sure which calculation method to use, start by doing some exploratory research. Your research will depend on what stage of growth your business is in; for example, in the development phase, research will usually come from industry reports and analytics, but a business in operation might conduct surveys, focus groups, or use their own analytics to come to conclusions about their market. If possible, it’s a good idea to do both, so you can contextualize any findings in your own business within your understanding of the larger market.
After some exploratory research, one calculation might stand out as being the most accurate or useful. When it does, target your research efforts. With primary research, this might look like additional focus groups or looking at more specific analytics. In secondary research, this might look like searching multiple industry reports for similar statistics. Keep in mind that you can also combine top-down and bottom-up approaches for a more well-rounded analytical perspective.
Calculating Serviceable Available Market and Serviceable Obtainable Market

After you’ve calculated your total addressable market, it’s a good idea to make your data even more specific by calculating the serviceable available market and serviceable obtainable market. While the total addressable market is the pool of revenue you’ll draw from, the serviceable available market narrows this down in terms of the specifics of what you’re selling and who you’re selling to. The serviceable obtainable market factors in your competition, and predicts revenues based on the percentage of the market share you can realistically capture.
If you think of the total addressable market as a lake with all the potential fish you might catch, the serviceable available market might be the type of fish you’re catching based on the lure you’re using. The serviceable obtainable market would be the amount of those fish you expect to actually come home with at the end of the day.
In our blockchain development company example, take the first estimate of a total addressable market of $1,620M, based on a top-down calculation. It’s possible that the specific solution that the blockchain development company offers is mostly getting interest from smaller financial services companies. If they comprise 50% of this total market, then the serviceable obtainable market might be only $810M. Given the competition, the blockchain development company may estimate they can capture 5% of that market, for a serviceable obtainable market of $40.5M.
OKR #4 – Understand overall business potential
In this OKR, we’ll try to understand the overall business potential to help us with our strategic direction.

Strategic avenues for a TAM analysis
Even if you’re not pitching to investors, this type of market analysis can be the spark that drives the engine of your strategic plan. Doing research into which markets you might fit into can help you identify saturated markets, new markets, and hidden markets in your industry. Knowing where these markets are and how they are predicted to change over time can help you make smarter, data-driven decisions about where to focus your energy. Understanding the total addressable market, serviceable available market, and serviceable obtainable market not only means understanding the limitations of your business, but understanding the possibilities as well.