Market share provides valuable insights into a company’s competitiveness and success in the market and can be used to inform decisions about product development, marketing, and pricing strategies.
Understanding and tracking market share is essential for your business to remain competitive. Let’s explore market share and dive further into the concepts that coincide with it.
What is the Total Market Size?
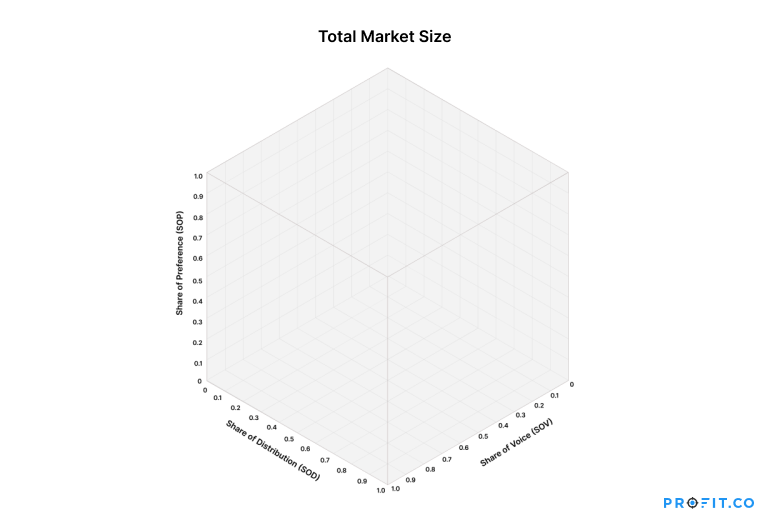
Total market size refers to the entire size or value of a particular market or industry, usually measured in monetary terms. It represents the total amount of goods or services sold within a specific market or industry over a certain period. Knowing the total market size can help companies understand the potential growth opportunities in a particular market or industry and provide insights into market trends, customer preferences, and the competitive landscape.
Share of preference, share of voice, and share of distribution are three key factors contributing to a company’s market share. The cube below represents how these three factors interact to determine a company’s market share. An axis represents each share, and the cube visualizes the volume of the total market size.
Total Market Size = Total Revenue Generated by the Industry or Market
The market share equation for a product or company is as follows:
Market Share of a Product/Company = Share of Preference X Share of Voice X Share of Distribution
What is Market Share?
Market share is the portion or percentage of total sales within a specific market captured by a particular company or product. One way to visualize market share is that market share is a piece of a company’s revenue pie in the marketplace or a percentage of the total marketplace value. For example, if ten companies sell a particular product in a market, and one company sells 30% of the total product sold, that company has a 30% market share.
Market share can be an essential metric for companies because it provides insight into their competitiveness and success within a particular market. It can also help companies identify areas where they may need to improve their marketing, pricing, or product offerings to increase their market share.
To calculate your market share, you need to determine your company’s total business sales revenue for a given period. Then, divide that value by the total sales revenue of the entire industry for that period. The resulting percentage is your market share.
The market share formula is as follows,
Market Share = (Total Business Sales / Total Industry Sales) X 100
Let’s take the sporting goods industry, for example. If the global sporting goods industry is worth $53B, and a company in that industry has $5B in revenue, then that company’s market share would be approximately 9.4% (calculated by dividing $5B by $53B and multiplying by 100).
Sports Goods Industry Market Share Example
Total Business Sales = $53B
Total Industry Sales = $5B
Market Share = ($5B / $53B) X 100 = 9.4%
Market Share of Company = 9.4%
By optimizing the share of preference, the share of voice, and the share of distribution, companies can increase their market share and grow their business. An organization’s business strategy can have a clear objective to fulfill the market share.
Let us look at each of these components of the market share equation in detail.
Don’t buy market share. Figure out how to earn it.

Share of Preference
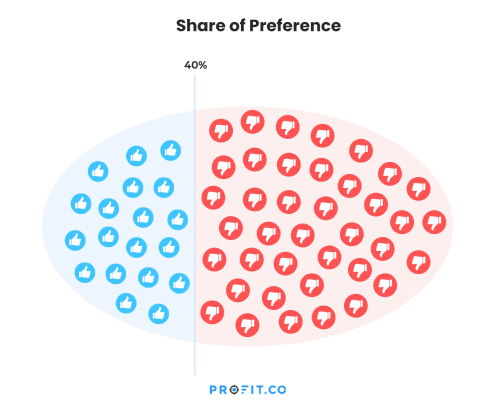
The first axis in the total market size is the share of preference.
Share of preference or brand preference is a metric that measures the percentage of consumers who prefer a particular product, service, or brand over its competitors in a given market or demographic. It represents the proportion of total customers who choose a specific product or brand when making a purchase decision. When a company has a high share of preference, it indicates that it is the preferred choice among customers in its target market.
Some metrics to track preference share include net promoter score, customer satisfaction, customer retention, user engagement, and churn rate.
Share of preference is used widely in market research leading to an effective marketing strategy, benchmarking studies, and product development. Share of preference provides businesses with competitive intelligence and helps them make sound business decisions.
Research indicates there is a direct correlation between the share of preference and market share. In the case of smartphones, Apple’s high share of preference has contributed to its dominance in the market. According to Gartner, Apple sold almost 18 million more smartphones in the last quarter of 2020. Many customers prefer iPhones over Samsung phones, giving Apple a larger market share and dominating the smartphone industry.
However, other factors, such as pricing, product quality, and marketing efforts, can also influence market share. Organizations should keep an eye on their competitors’ market share and how their preference is evolving to understand if they are gaining or losing ground and need to adjust their strategy. Optimizing the share of preference is vital for companies to thrive during economic distress. According to a Gartner report, recent economic uncertainty has created a 30% decrease in customers’ ability to decide on a purchase. Nurturing a high preference share could help circumvent these challenges and protect your market share. If customer loyalty is strong, they will remain loyal to companies even during economic lulls.
Prioritizing positive customer interaction with your product is an excellent strategy for improving your share of preference. In the case of a SaaS company, it’s essential to focus on delivering a great trial experience and user experience, as these factors can significantly impact customer satisfaction and loyalty. Companies can achieve this by providing easy-to-use and intuitive trial software, clear instructions and tutorials, and responsive customer support.
In addition, focusing on user experience can ensure that your existing customers continue to be satisfied with your product and are more likely to recommend it to others. Regularly soliciting feedback from customers and using this feedback to make improvements to your product will enhance your company’s share of preference.
Ready to learn more about market share?
Share of Voice
The second axis in the total market size is the share of voice.
Share of voice is a marketing metric that measures a company’s or brand’s visibility and presence in the market compared to its competitors. It refers to the percentage of overall advertising or promotional activity within a particular industry or category attributed to a specific product, brand, or company. Share of voice in marketing refers to your brand’s visibility in the marketplace, allowing you to dominate consumers’ thoughts.
Brand leaders use digital marketing and advertising, social media mentions, and keyword searches linking to the company website to expand their share of voice. Share of voice is useful because it helps you measure the referral traffic, understand and cultivate competitive brand awareness.
To understand and address the competition, marketers can compare data across domains, different channels, customer personas, and voice drivers. Share of voice metrics include hashtags, impressions, organic traffic, and other digital marketing KPIs. Forbes predicts that in 2023, companies will focus on integrated marketing strategies, AI strategies, and personalized marketing to stay relevant in the marketplace.
Share of voice can increase brand awareness, brand loyalty, and purchase intent, thus, increasing market share. It is not necessarily how much your company spends on advertising but the quality of the advertisements you invest in. SaaS companies may use the share of voice as a key performance indicator (KPI) to track the success of their marketing campaigns and assess their overall brand health. By monitoring their share of voice over time, they can identify trends, measure the impact of specific marketing initiatives, and adjust their strategies as needed to improve their market position and drive growth.
To calculate the share of voice, a SaaS company can use a social listening tool or media monitoring service to track the volume of online conversations related to its brand and its competitors. They can then compare their share of mentions to their competitors to evaluate their relative visibility and impact in the market.
Share of Distribution
The third axis in the total market size is the share of distribution.
Share of distribution is the percentage of a product or company’s total revenue generated through distribution channels, such as partners, resellers, or affiliates. Simply put, the share of distribution refers to the opportunities for your consumers to buy your product
The share of distribution is substantial because it helps the company understand its product availability and how to reach more customers. Calculating the share of distribution can help companies evaluate the effectiveness of their distribution strategy and identify areas where they may need to adjust their approach.
The share of distribution can also impact pricing strategy and provide insights into the distribution channel. Data on the share of distribution can help discover new areas of growth and allow for efficient allocation of resources. According to Forbes, despite 70% of distribution companies experiencing growth in 2022, companies need to remain innovative to keep pace with competitors and grow.
A high distribution share company may reach many customers through partners, resellers, or affiliates, but that does not mean that those customers are loyal to the brand or will continue buying from the company in the future. A company needs to strike a balance among these metrics and understand the interrelated to make informed business decisions. If your company has a lower share of voice or preference, prioritizing a high distribution share is a popular strategy among companies with similar setbacks. Companies such as IBM, Gillette, Eastman Kodak, Procter & Gamble, Xerox, General Motors, Campbell’s, Coca-Cola, Kellogg, and Caterpillar prioritize a high distribution share. Their market shares have been their blessing and their curse—their curse because they must make their decisions and manage their operations with much more care than their competitors.
Tracking distribution share goes beyond product availability by retailers. For SaaS companies, you can utilize different metrics to track the distribution share for SaaS and digital products, such as the number of subscribers, integrations, partners, countries and regions, languages, and certifications
Share of distribution analysis allows for benchmarking and identifying new opportunities, sales forecasting, resource allocation, and partner management. Proper research and action can expand the distribution share, leading to a larger market share.
What are Some Examples of The Market Share Equation in Action?
Now that we understand what each axis share is and how they interact, let’s apply what we know. Let’s examine some hypothetical examples to understand how the market share equation works.
Example 1
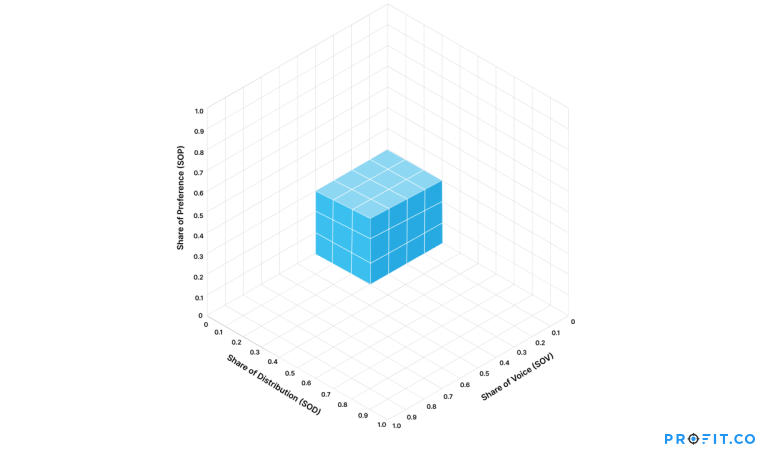
In the example above, the market share or penetration is 0.036.
Share of Market for a Product/Company = Share of Preference X Share of Voice X Share of Distribution
Share of Preference = 0.3
Share of Voice = 0.4
Share of Distribution = 0.3
Share of Market = (0.3 X 0.4 X 0.3)
Share of Market = 0.036
The share of preference is three or 0.3, the share of voice is four or 0.4, and the share of distribution is three or 0.3. After multiplying each axis (0.3 X 0.4 X 0.3), the market share is 0.036. Another way to visualize the market is by counting the number of cubes, which in this example is 36 cubes, and multiplying that number by .001.
Example 2

In the example above, the market share or penetration is .084.
Share of Market for a Product/Company = Share of Preference X Share of Voice X Share of Distribution
Share of Preference = 0.7
Share of Voice = 0.4
Share of Distribution = 0.3
Share of Market = (0.7 X 0.4 X 0.3)
Share of Market = .084
The share of preference is 0.7, the share of voice is 0.4, and the share of distribution is 0.3. After multiplying each axis, (0.7 X 0.4 X 0.3), the market share is .084.
Due to the relatively high preference share, you will have a more significant market share than in the previous example. However, the market share is still stifled by the low share of voice and distribution, making the market share still marginal compared to its potential within the overall market size.
Example 3

In the example above, the market share or penetration is 0.25.
Share of Market for a Product/Company = Share of Preference X Share of Voice X Share of Distribution
Share of Preference = 0.8
Share of Voice = 0.8
Share of Distribution = 0.4
Share of Market = (0.8 X 0.8 X 0.4)
Share of Market = 0.25
The share of preference is 0.8, the share of voice is 0.8, and the share of distribution is 0.4. After multiplying each axis, (0.8 X 0.8 X 0.4), the market share is 0.25.
The share of voice and share of preference both have two large axes, making the figure very tall. However, due to the share of distribution being only 0.4, the market share is limited to 0.25.
Market Share And The Pepsi Challenge
Let’s explore how the different shares influence market share in the highly-competitive cola industry with the following examples.
Share of Preference
A classic example of share preference is the preferred cola product of a customer. Coca-Cola and Pepsi are top competitors in the field, with fervent customer loyalists on both sides. The competition is so iconic that PepsiCo created a campaign based on the rivalry in 1975 called The Pepsi Challenge. The Pepsi Challenge consisted of customers blind taste-testing Pepsi and Coca-Cola to see what tasted better. Pepsi wished to expand its share of preference and succeeded. Customers overwhelmingly chose Pepsi as their fan favorite. By focusing on taste and consumer preferences, Pepsi was able to win over many customers and expand its share of the cola market.
Coca-Cola responded by changing its formula to a sweeter recipe, which ultimately didn’t fare well with customers. The switch led loyal customers to abandon their preference for Coca-Cola, resulting in the company eventually returning to the original formula.
Overall, the Pepsi Challenge is an excellent example of how a company can focus on share preference to increase market share and dominate a market. By understanding what customers want and delivering a product that meets their needs and preferences, companies can build a loyal customer base and establish themselves as a leader in their industry by measuring marketing KPIs.
Share of Voice
The success of The Pepsi Challenge also allowed Pepsi to increase its share of voice in the market, as more customers were talking about and recommending the brand to others. The Pepsi Challenge aimed to change customers’ minds about the product through the share of preference but simultaneously used marketing strategies to increase its share of voice. The campaign title itself allowed for Pepsi to be highlighted as the more popular choice pre-victory. The challenge became a marketing success through an intense and deliberate campaign, allowing Pepsi to dominate the cola landscape and become culturally significant. The Brand Awareness Metric indicated the campaign’s success.
Share of Distribution
If a Pepsi loyalist goes to a retailer where Pepsi is unavailable, and Coca-Cola is, they must compromise their brand loyalty. Despite the impact of the Pepsi Challenge or any other campaign from their perspective, they cannot purchase a Pepsi because it is simply unavailable to them.
Either they can purchase a Coca-Cola or an alternative drink, but no matter what, Pepsi loses out on business because of the distribution share. There is no opportunity for the customer to buy the product if they don’t have access to it.
Conclusion
Measuring, managing, and understanding your market share is essential to growing your company. Share preference, distribution, and voice are vital in company management and growth tools. These metrics guide you in managing and organizing your teams while establishing objectives and results.