


Why grade OKRs?
OKR grading is actually a step or a precursor towards your end of quarter reflection, which is a major exercise as part of any OKR program in general. Grading OKRs kind of establishes a common platform to evaluate how OKRs are being practiced across different employees, departments, and groups. If you call a group of people, sit in a room and talk about how each one did, how do you assess everyone in the room? Grading allows you to speak in a language that everyone understands. It’s a lot easier to have a commonly understood way of rating and talking about it. So when you have that common method and when somebody says “I’m 0.9 or I’m 90%,” while the other one says “0.6”, you have a relative way of knowing where each person, or department, or sometimes a special initiative stands.
OKR grades are really a reflection of how things went in the past quarter, reduced to a single number, or maybe if you look at it at a particular department level, it could be an average across three, four, or five OKRs that were executed by that department. That’s why you would grade OKRs.
How do you grade OKRs?
There are couple of approaches:
- Simply based on percentage of achievement
- Bucketed into areas of achievement
Profit.co supports both these approaches:
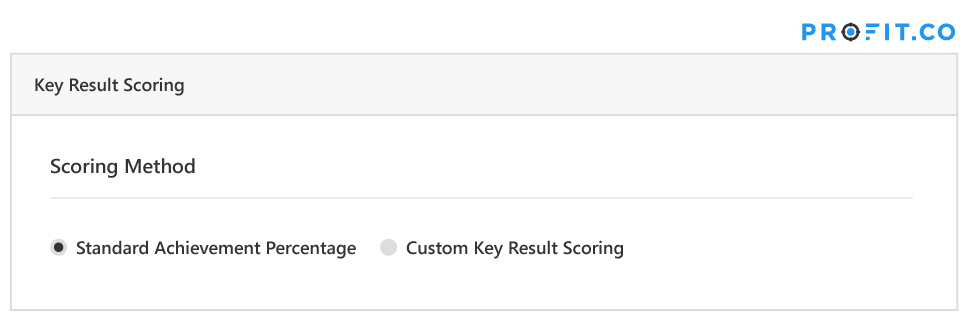
On top of these basic options, Profit.co also allows you to customize the way your grades are represented in your OKRs and aggregated above.
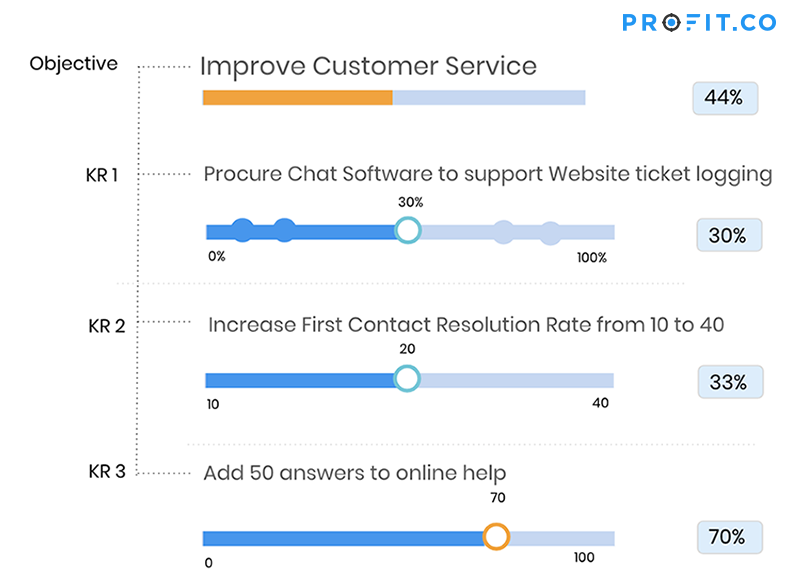
Let’s look at this particular Improve Customer Service OKR example. In this case, there are three key results. Profit.co offers a pretty simple OKR grading feature, which is just based on completion percentage. Now, you can simply leave it as is.
In general, in the OKR world, the score ranges that are generally accepted are:
- 0 to 30% → Failed to make significant progress
- 30% to 70% → Progress made, but fell short of the finish line
- 70% to 100% → Delivered as planned
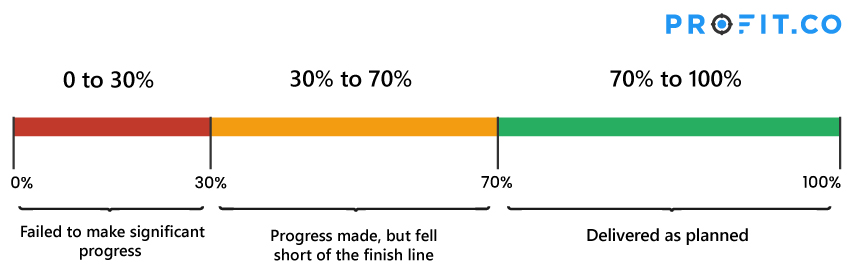
This is how grading is handled in the OKR world, and color coded as shown.
Profit.co supports something very similar, although it’s not really color-based, but uses an icon to indicate score in real time. Profit.co uses colors to indicate the in between confidence of the KR owner.
This is the standard grading, which is enabled by default. You don’t have to do anything. As you keep making progress, the individual KR level progress is calculated. The objective is automatically calculated based on an average or a weighted score of the KRs under that objective. If you do indeed want to implement something similar to let’s say the scoring or grading based on like colors or let’s say some other method, Profit.co has a unique different approach here. We actually call it like the custom key result scoring.
You can actually have four types of bases scales to support your scoring:
- 1 → 0 to 1
- 5 → 0 to 5
- 10 → 0 to 10
- 100 → 0 to 100
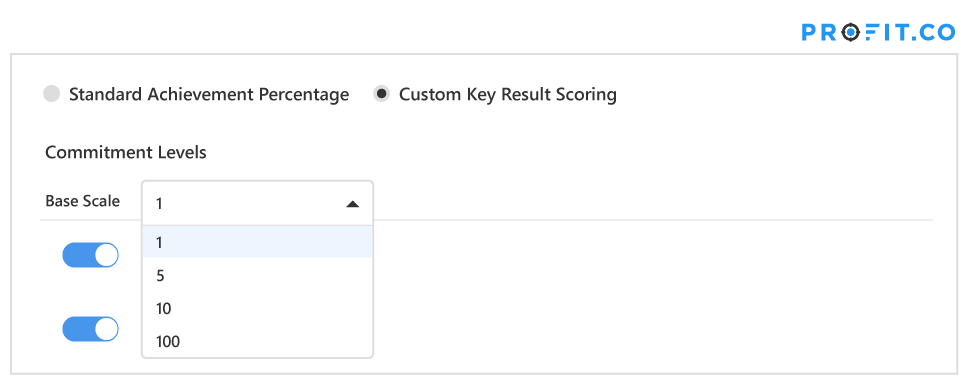
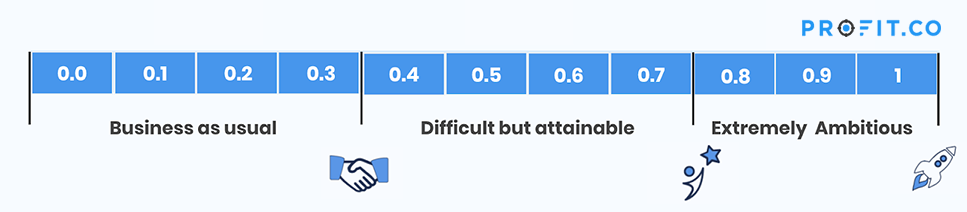
Now, assuming we take a base scale of 1, which many people normally do, you could actually define your ranges as to your definition of achievement. We offer like three buckets, which is again pretty standard within the industry. You can turn off a level if you want, but it’s best to use all 3 buckets.
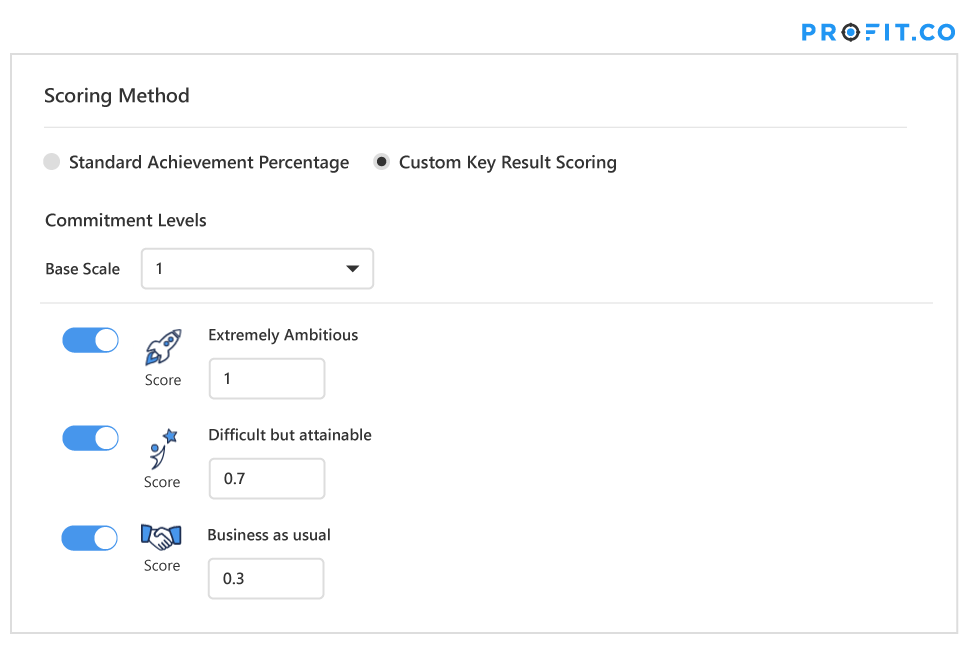
In this example, we call it:
- Business as usual when you cross 0.3,
- Difficult, but attainable when you cross 0.7
- Extremely Ambitious when you reach 1.0
This is how you would normally, let’s say bucket your key results based on their scores. You can customize this for your business. We have seen CEOs go berserk and say “Hey, what do you mean by 0.3 being good or not necessarily good, but borderline it’s okay?” It sounds crazy.
We’ve seen clients using these buckets:
- Business as usual when you cross 0.7
- Difficult, but attainable when you cross 0.85, and
- Extremely ambitious when you reach 1.0
Which means that until you hit the 0.7 mark, you’re not getting to the business as usual level, that’s the implication of having a definition of these, let’s say buckets of achievement levels.
Now, so in this case, we’ve got this and we enable custom key result scoring. If I go back to that same OKR, it will look like this, with this new scoring method:
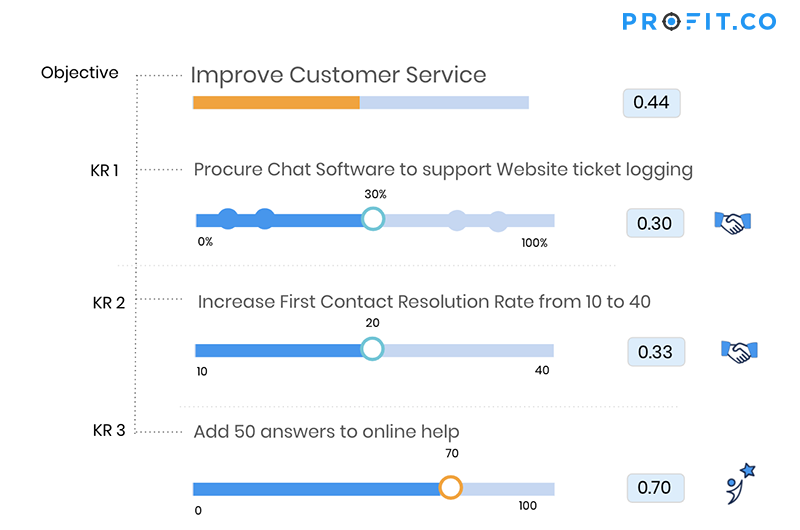
This is how at the individual KR level, we grade the key result rather and collectively, at the objective level, the score is indicative of the progress of the objective.
Again, just to quickly summarize, we have a pretty simple grading system which is just percentage tracked based. Then, you have a slightly sophisticated grading scale, where you can actually create buckets of achievement levels, which are typically categorized into three buckets:
- Business as usual
- Difficult but attainable and,
- Extremely ambitious.
You can customize your levels, which will make a key result fall into one of these buckets. Based on that, profit.co will score your key result and show appropriately.
How do you share your grades?
In general, the OKR methodology promotes transparency and the OKR score is one of those things that needs to be completely transparent and available everywhere.
Profit.co automatically calculates a summary score at the following levels based on what levels of OKRs are enabled in your organization:
- Corporate OKRs
- Department OKRs
- Team OKRs
- Individual OKRs
This is available for everybody to view. You can actually go here to all departments’ OKRs.
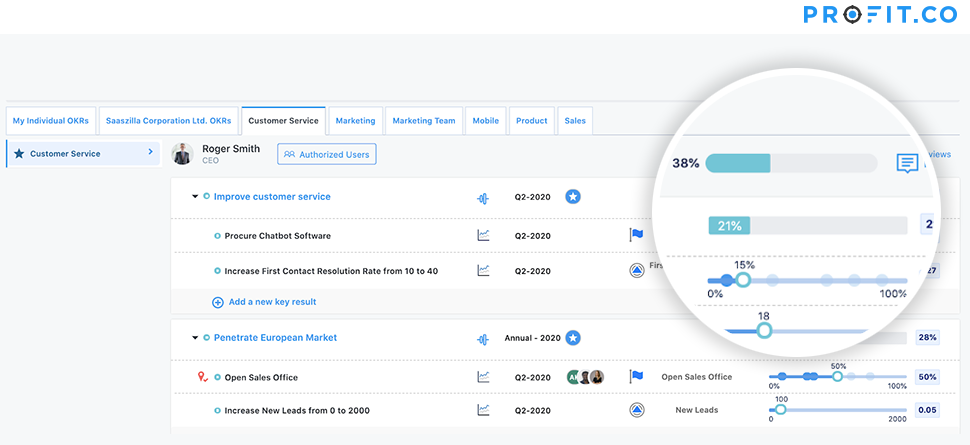
This is again a pretty open, transparent system, built in line with the principles of OKRs. You actually look at the team score of 38% here. If I want to know what customer support is doing, I just need to access that department’s OKRs and I’ll see the grade in real time. If I go to the corporation, I can see the OKRs at that level. Again, the system is pretty transparent. It’ll let everyone who has access to the system come and see how the scores and the grades are visible to everybody else in the company.


