TLDR:
A Gantt chart is a visual project management tool that maps tasks against a timeline, helping teams plan, schedule, and track progress. It shows task durations, dependencies, milestones, and resource allocation in one place. Widely used across industries, Gantt charts help improve coordination, identify bottlenecks early, and ensure projects stay on schedule
Projects are the drivers of change in every organization, whether their goal is to introduce new products or undergo massive digital transformations. This is why project managers need all the help they can get to deliver their projects successfully.
One invaluable project management tool is the Gantt chart. It helps visualize every task and milestone in a project to keep you organized. Let’s look at what a Gantt chart is, how to create it, and its benefits for your project.
Those who plan do better than those who do not plan, even though they rarely stick to their plan.

Key Takeaways
- Gantt charts are visualization tools for project planning and scheduling.
- They offer a bird’s eye view of your project tasks’ duration, resources, and sequence.
- They also help monitor projects in terms of milestones, overlapping tasks, and budget allocations.
- Gantt charts are most popular in infrastructure projects, software development, and product design.
- Gantt chart software ranges in complexity and application, with specialized features for different industries.
What is a Gantt chart?
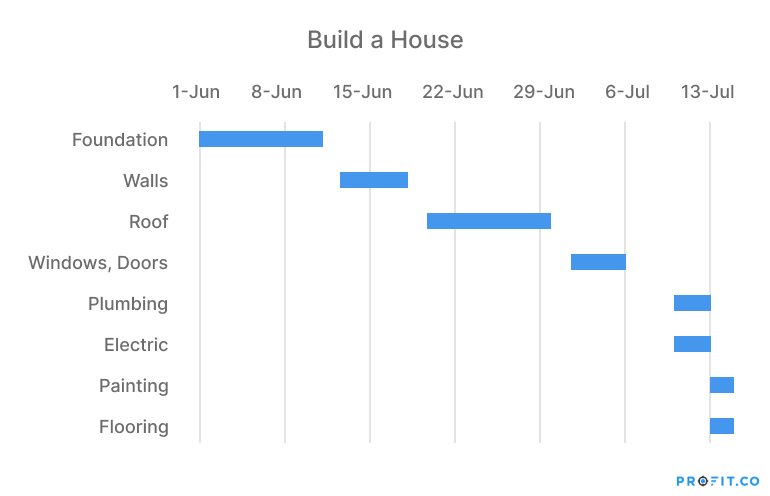
Simply put, a Gantt chart is a graph that shows project activities against time. Its made up of three parts: an outline of tasks, a timeline, and a progress bar.
Under tasks, every activity in the project appears in sequence. Under the timeline, each task’s progress appears as a horizontal bar. In the example below, you can break down the house building project into specific tasks, from the foundation to finishing. Each assignment then links to a schedule for the month of June.
Where Do Gantt Charts Come From?
Gantt charts are as old as the late 1800s, but Henry Laurence Gantt revolutionized them in the 1910-20s. He discovered that it was more effective to plan projects based on time rather than output.
With the advent of computers in the 1980s, Gantt charts moved from paper to software, which allowed for more complex and elaborate project schedules. Gantt charts are now one of the most popular project management tools available today.
Benefits of Gantt Charts
The key benefits of Gantt charts in project management are:
1. Identifying Task Sequences
A Gantt chart reveals which tasks you can do simultaneously or those which can’t begin until others end. This streamlines your project schedule as you identify and eliminate bottlenecks.
2. Range Of Projects
Virtually any project that needs a schedule can use a Gantt chart. While they’re prevalent in infrastructure projects like building roads and bridges, Gantt charts are helpful for software development projects, product design, digital marketing campaigns, fundraising, and much more.
3. Complexity
Some projects can be quite complicated: they may incorporate multiple teams in multiple locations or have changing deadlines. Gantt charts help project managers to work around these challenges without wasting resources.
4. Gantt chart Software
Project managers can create Gantt charts using Microsoft Excel spreadsheets or go for specialized software like Microsoft Project, TeamGantt, Wrike, and GanttPro.
5. Waterfall versus agile projects
The main difference between waterfall and agile projects is the flow of tasks. Waterfall projects feature one job after another in a linear time frame. Agile projects are built around sprints, which are more about incremental milestones and stakeholder feedback at every stage. A Gantt chart is the ideal scheduling tool for these types of projects.
How to Create a Gantt chart
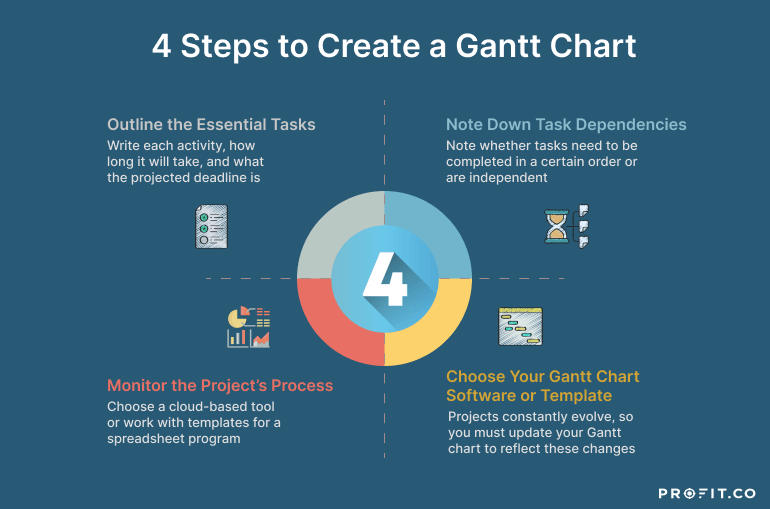
You can create a Gantt chart in four main steps, regardless of the Gantt chart software you choose. Let’s use the house building example above.
1. Outline the Essential Tasks
List all the activities needed for the entire project from start to finish. Next, estimate how long each activity will take to complete in days, weeks, or months. Keep the delivery date in mind while planning each task’s duration.
For example, building a house includes laying the foundation, installing windows and doors, painting, and flooring. Some tasks will take longer, such as the foundation, while others take a couple of days, like installing the floor.
2. Note the Task Dependencies
Project tasks are either sequential or parallel. Sequential tasks must occur one after another, like building the foundation, walls, and roof. Parallel tasks can happen simultaneously with other tasks, like plumbing and electricity installations.
3. Choose Your Gantt Chart Software or Template
Once you have a clear list, time estimate, and task sequence, it’s time to use your Gantt chart program. Choose a cloud-based tool to allow for collaboration on the project or work with templates for Excel or other spreadsheet programs.
Profit.co’s task management software can help you organize the tasks that need to go on your Gantt chart, as well as connect each task to a higher-level company objective or key result. You can get started on Profit.co completely free today!
4. Monitor the Project’s Process
Projects constantly evolve, so you must update your Gantt chart to reflect these changes. For example, delays in delivering construction materials to the site impact all other tasks regardless of whether they’re sequential or parallel.
The Gantt chart helps figure out how to make up for the delay and still finish the building project on schedule. This could mean bringing in an extra plumber or electrician to save installation time.
Top Reasons to Use a Gantt chart
Projects benefit from Gantt charts because they:
- Show clear milestones
- Enable adjustments once the project begins
- Spot problems or challenges early on
- Support collaboration with project teams
- Provide the proper resource allocation for every team member
Gantt Chart Use Cases
Gantt charts are common in the following project management contexts:
- Tailored resource planning for hospitals to assign the right physicians to the right patients or departments
- Automated flagging for delayed tasks based on preset rules for building projects
- Individual task planning and monitoring for production teams on a daily, weekly, and monthly basis
- Linking tasks to milestones for sprint projects like video game development
Conclusion
Project managers who handle small and large-scale projects rely on Gantt charts for scheduling and resource allocation. A Gantt chart is an essential roadmap tool that offers a quick way to monitor a project at a glance.
Gantt charts are handy for time-sensitive projects like software upgrades, product launches, and infrastructure construction. Whatever your industry, use Gantt charts as part of your project management strategy today.
For more information on how Profit.co can help you manage your projects and tasks alongside your most important company OKRs, book a free demo with our experts today!
A Gantt chart is a visual timeline that displays project tasks, their durations, and progress, helping teams manage and track project activities effectively
The key components include:
- Task list
- Timeline
- Progress bars (showing duration and completion)
- Milestones and dependencies
They help plan schedules, track progress, manage dependencies, allocate resources, and identify potential delays early.
- Sequential tasks must be completed in order
- Parallel tasks can be performed simultaneously
You can create one by:
- Listing all tasks
- Estimating durations
- Defining dependencies
- Using a tool or template to visualize and track progress
Common tools include spreadsheet software like Excel and specialized platforms such as Microsoft Project, TeamGantt, Wrike, and GanttPRO
Yes, although traditionally used for waterfall projects, Gantt charts can also support Agile workflows by tracking sprints, milestones, and dependencies.
They provide clear visibility into timelines, improve collaboration, enable better planning, and help keep projects on track