What is a KPI report? It is a Key performance indicator (KPI) that allows leaders within an organization to quickly and easily review, analyze, and compare different key metrics of their business. They can compare them to organizational goals to measure how well the company is doing, not only from a profit point of view but also how well you do from a personnel perspective. KPI reporting is important because it helps you improve in areas of opportunity while leveraging areas of strength.
If you aren’t already using KPIs and KPI reports, you may be wondering how to get started. We’ll go through the basics behind KPI reporting, why they’re important, and look at how you can accurately track your performance over time.
What are the benefits of KPI Reports?
KPI reporting is important because it provides an explicit and accurate picture of a business’s performance, well-being, and growth potential. Using several specific KPIs is a far better solution for measuring business growth and success than simply basing it on one measurement, such as annual revenue. While gross revenue is critical, there is more to success than this one metric.
Why are KPI Reports so crucial to your business?
You can measure your results
One of the important attributes of KPIs is measuring. This visual measure allows you to judge the success or failure of the work you are analyzing. When you create a target goal, it is only natural to want to track progress toward that goal. The great thing about KPIs is you can measure almost anything, including
- New hires
- Turnover
- Cost per hire
- Absenteeism
- Revenue Per Employee
A KPI is something that is actionable. In other words, you can influence the results by changing something that impacts your particular KPI results. A KPI should be measurable and quantifiable. You can also use different KPI reports as comparisons to see if one area of your business is affecting the other. A good example would be turnover vs Time since the last promotion. When comparing these two reports you may find that your turnover is due to consistent reviews that result in annual raises.
What’s measured improves

KPIs help you set business goals
KPIs help an organization work towards a common goal. KPIs allow an organization to break down complex information in a way that makes it easy to understand. A goal target starts low and slowly builds on it over time, and consistently communicates the progress to keep everyone moving forward. The last thing you want to do is set your targets so high that achieving them is impossible.
Setting KPIs can also help you learn more about your business. Considering the KPIs you want to track may lead to additional insight into your business operations. The impetus to look deeper into the finer details can lead to important discoveries that may not have happened otherwise.
Incentivize your team
KPI incentives are a common way for an organization to improve and drive results in a short period. For this to be successful, the goal must be clearly stated and quantifiable while ensuring accurate reporting. KPI data available to employees can empower them to improve their personal performance, improving the organization’s results. A common incentive you might see is reaching a hiring goal right before a big uptick in traffic. For retail, this may be right before the holiday season. An organization may give out gifts or discounts for reaching the desired goal.
It helps you find the flaws in your business strategy
Managers can use KPIs to identify areas of opportunity within their business strategy. They can use them to identify employee satisfaction, engagement rating, employee pay, and early turnover. KPIs allow managers to recognize these issues quickly so that they have little to no impact on the business. Companies can also resolve employee issues and concerns by analyzing feedback from employees to check whether the expectations of the employees are being met or not.
KPIs point out the strengths in your business strategy.
You can find strengths just like you can uncover opportunities with KPI reporting. You can use this information to enhance the performance of your business and promote your business are: Finding strengths allow you to repeat business strategies or duplicate similar positive results for future endeavors.
Saves business expenses
KPIs help you identify areas where you can reevaluate your goals to help cut future costs. HR hiring and training can cost you lost time and money if new hires are not trained and compensated well. An organization may find that offering a sign-on bonus, better pay, and/or more effective training could save money in the long run.Types of KPI reports
Different types of KPI reports
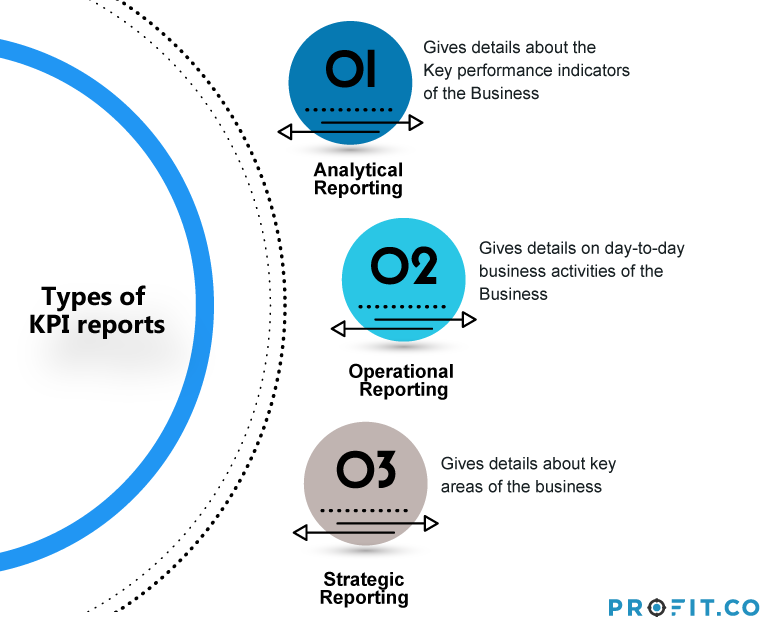
The three types of KPI reports that help an organization measure different metrics within their business are:
1. Analytical reporting will show details behind the KPIs. You will see this type of reporting used across all areas of a business. Analytical reporting is used to compare peaks and troughs within the KPI data. If you want historical measures you will want a static version of this type of reporting. Other analytical reporting like interactive reports allows the user to break down the individual metrics.
2. Operational reporting is the day-to-day activities that make a business run. The information provided in this reporting allows the user to take action in real-time to impact that day’s business. An example of this would be scheduling employees based on their rate of pay to ensure that a business doesn’t exceed its payroll budget.
3. Strategic reporting is considered a leadership tool that allows a team leader to quickly determine how the organization is performing in key areas. This type of reporting will show the owners of a business and the shareholders how well the company is performing against its goals.
How to create a KPI Report?
There are 3 steps to creating a KPI report. Following these steps will guide you to creating an effective report for your business to help you drive results.1. Create an overview
This can be in the form of an outline that aims to set the expectation of the report. An example would be something that answers the following questions:
- Does your report have an objective or a goal?
- Who will see and utilize this report?
- How do you want this report to be used?
- When will it be released for review?
Keep your overview simple. You want it to be easy for all levels of the organization to read and understand.
Want to get started on intuitive and agile metric-driven software today?
2. Establish your KPIs and aggregate your data
Once you have created your objective, you will have a better idea of what KPIs you should be focusing on. KPIs should be geared toward answering questions such as:
- Did you meet your hiring goal?
- Did you keep early turnover and turnover low?
- Is employee morale high?
- Did we stay within our payroll budget?
The next obstacle will be getting the data to bring these KPI reports to life. The data should be reliable and thorough. If the integrity of the data is in question or the data is incomplete your data won’t provide a sound indication of actual performance. If your organization already has a system for gathering measurements you will just need to pull from their data. Look for external indicators of demand. An example of this may be hiring goals set based on how busy the holiday season is predicted to be.
3. Creating the report
There are many tools you can use to create and manage your KPI reports. One method is simply with Excel spreadsheets. This involves manually entering the data into the spreadsheet and formatting tables. You’ll also likely want to generate charts and graphs to track KPI performance each month, quarter, or year. However, feeding in all of the data and formatting tables can be tedious and time-consuming.
Alternatively, you can use a performance management tool that makes KPI reporting easier and includes a host of other useful functions. Profit.co offers OKR software to help you focus on your goals and measure your progress. With the performance management tool, a few of the many things you can do are:
- Instantly create OKRs with built-in step-by-step guides
- Start with pre-defined templates
- Use any of the 400+ KPIs included in the software
- Track your team’s progress with the company dashboard
- Link tasks with key results