


Before you embark on your quest to steer your organization towards sustained success, knowing and defining what success looks like is important. So, what does success look like? Many popular concepts in life are really simple, and this is not any different.
The way we would like to position the definition of success here in the enterprise-scale is by creating a sustainable growth matrix with business results on one axis and employee engagement/satisfaction on the other axis.
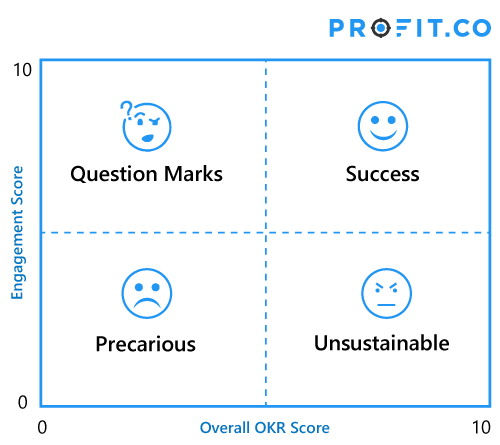
On the horizontal axis, we have the overall OKR score which represents what the business has achieved over the defined period of time. This number is transparent and available to everybody. If you follow the true principles of OKRs, everyone will know what’s going on here. OKR Scores can be on many scales depending on your choice. The OKR score shown here is on a 10 point scale.
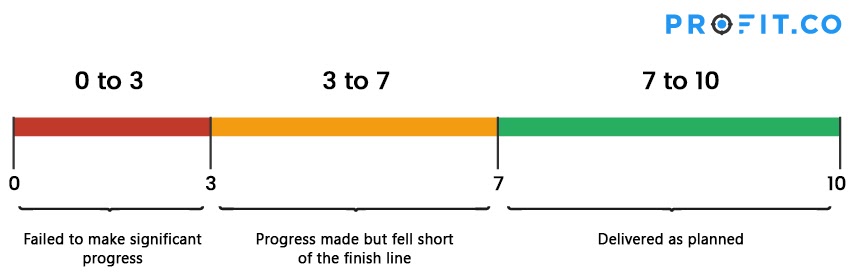
In general, in the OKR world, the score ranges that are generally accepted are:
- 0 to 3 → Failed to make significant progress
- 3 to 7 → Progress made but fell short of the finish line
- 7 to 10 → Delivered as planned
On the vertical axis, we have the employee engagement score. The employee engagement score is computed from an eNPS survey. eNPS is the short form for employee net promoter score, which originated from NPS or net promoter score. You ask one simple question — “Will you refer this company to your friends, to join and work?” The answer is typically on a 5 point or 10 point scale. The engagement score is simply an average of all the responses, either at the company level or at the department level. But the eNPS calculation is a bit more involved and is shown in the picture below.
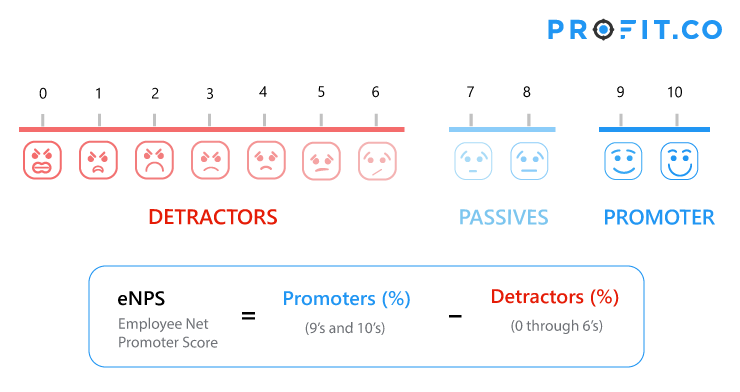
The eNPS score itself can theoretically be in the range of -100 to +100. But you do tend to see a lot of “passives” and hence the score won’t be anywhere near these extremes. In any case, eNPS is not what we are going to use here, but instead simply the average of the raw score.
Now we will see how you can put all your different departments in this matrix and understand where they actually lie with respect to each other.
Where is your company/department positioned?
When you take your company’s overall OKR score and the engagement scores and plot that on the matrix you’ll know if you are on a sustainable growth trajectory or if you need to make changes to your organization, business processes, etc to get you onto that path. We will be looking at approaches to getting your business on this sustainable growth path.
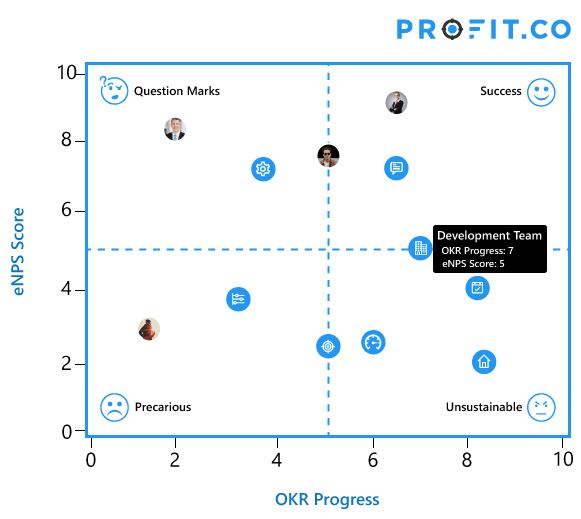
A good way to get started is to plot your departments or business units in this matrix and see how they fare. The “whole” is made of many “parts” and understanding how the parts are doing will help us get the whole company towards the success/sustainable growth path.
Precarious
If a department or a team or a group has low OKR scores, and also low engagement scores, then you know that they are in a precarious situation. They’re not really achieving the business results, and the employees are not motivated at all. While this quadrant buckets everyone as “precarious”, the situation is going to be even worse as you go closer to 0 on both of these axes. But, that’s the quadrant you are in. If the business results are not to be seen, and the employees are also very negative, you’re sitting and looking at a pretty grim situation here. You have a problem you have to address. Something’s gotta change.
Question Marks
Now, let’s walk up a little bit and see. Okay. So, the engagement score is very high, but the OKR scores are still low. What that means is, the business results are not there, but people are happy. This could mean:
- The targets set through the OKR process were really tough, and the department employees are superstars and know that they’ve got the toughest challenges. They also know that they need to keep their end of the bargain and the department will see better results in the coming quarters. This is a bad situation that could become good soon. Watch carefully.
- Another possible explanation is that these employees are ignorant and have no clue. They’ve got goals but aren’t making good progress. But, still they seem to be pretty happy. So, begs the question, why are these people happy when their numbers are so low? And pushes you to investigate further and figure out what adjustments need to be made. The OKR process didn’t really produce the desired outcomes. Employees are in business as usual mode and haven’t realized that things have changed. Something’s gotta change. Obviously, you want to preserve their engagement situation, but you need to figure out what is actually going on and ensure that they achieve the business results expected of them.
Unsustainable
Now, on the bottom right is where you have a high achievement score on the OKRs, but your engagement score is low. This means either people are being overworked or driven hard to get the right results, and they are not happy. That needs to be looked into and addressed. You want to keep the achievement levels high, and figure out how you can make them happier, because it might be due to many reasons — compensation, managerial culture, work hours, etc. It may just be that they are working over their regular hours to get to their tough target, and don’t feel like they are compensated enough.
Success
The 4th quadrant is the sustainable growth or success quadrant. That’s where you have good OKR scores as well as good engagement scores. Now, this is where every business has to strive to be. That’s what we would define as the success quadrant. This is what success looks like — business is achieving its goals while employees are highly engaged and motivated. In your plot, you can see where the company is and where each department is placed in. But if all your departments are placed in the success quadrant, your company is obviously going to be right there.


