


TL;DR
A KPI dashboard is a visual tool that displays key performance indicators (KPIs) using charts and graphs on a single screen, helping teams monitor performance and make data-driven decisions quickly.It simplifies complex data, provides real-time insights, and improves collaboration across departments. KPI dashboards can be strategic, operational, tactical, or analytical, each serving different business needs.
An effective KPI dashboard focuses on essential metrics, is easy to understand, and supports better decision-making through clear, actionable insights
A KPI Dashboard is a visualization tool that converts KPIs, raw data, and metrics to simple forms such as graphs and charts.
Marketers should apply a scientific approach to data in the current digital world. Key Performance Indicators or KPIs are modern tools that help run a business effectively. They use measurable values to show how close you are to accomplishing your strategic goals.
KPI dashboards project all essential KPIs from modern analytics on one screen. Team members can link different results to be able to address any issue within minutes.
Let’s explore what KPI is, KPIs dashboards, some examples, and how to design the best KPI dashboard template.
Measurement is the first step that leads to control and eventually to improvement.

What are KPIs, and Why Are They Important?
A KPI is a quantifiable value that shows how an organization performs depending on the target objectives. The most suitable KPIs depend on the section of the business you’re monitoring and your industry.
KPIs are an essential component of any business’s success. There’s no better way to identify and manage performance issues before they snowball into even larger problems.
Utilizing KPIs efficiently requires you to select the appropriate KPIs. You then have to link them to develop a logical data story.
OKRs vs. KPIs
Key Performance Indicators at the most important metrics and targets that you must track in order to monitor the health and success of your business. Meanwhile, OKRs (Objectives and Key Results) are actionable goals. OKRs can be measured using KPIs. When KPIs have a baseline value, target value, assignee, and deadline, they become key results. Many people try to compare OKRs vs. KPIs, however these two business tools work alongside each other and don’t replace one another.
Are you looking for a flexible OKR management tool to transparently track your targets and goals? You can get started on Profit.co today completely free!
Ready to start your OKR Journey for FREE?
What are KPI Dashboards?
A KPI dashboard streamlines KPIs so your team can quickly analyze and compare them. They help to assess data and come up with actionable insights. They simplify large data sets into understandable formats, ensuring data-driven decisions that benefit the business.
With the help of KPI dashboard software, you can convert data into productive insights and analytics. The software ensures data entry in one specific system or links external data sources.
Why Do You Need a KPI Dashboard?
Most Key Performance Indicators affect each other, so comparing them helps determine successful goals. You can use low-level and high-level KPIs to see how the smaller goals assist in achieving the bigger ones. You can identify potential issues and get insights into the overall performance.
Types of KPI Dashboards
KPI dashboards can take a strategic or operational approach. Operational dashboards highlight daily outputs, productivity, and processes for smooth business operations. The information helps you address issues before they start affecting performance.
Strategic dashboards focus more on the future. They try to predict any challenges that may prevent your business from attaining its strategic goals.
1. Executive KPI Dashboard
An executive dashboard examines essential success factors to track long-term business strategies. It helps to compare KPIs with the business goals.
For example, hospital groups covering large geographical areas can use the executive KPI dashboard template for efficient operating systems. For better planning, they have a clear view of all essential data, such as patient flow.
2. The Operational Dashboard
Operational dashboards track the current state and present the data in simple, easy-to-understand formats. The design encourages interactivity and shows progress in relation to the goals.
For instance, a police force can use an operational dashboard to ensure efficiency. The dashboard can monitor crime rates, police report volumes, and track locations.
3. The Tactical Dashboard
A tactical dashboard monitors progress towards particular goals. You can monitor your progress for more informed decisions if you know your aim.
The interactivity helps to determine what works and what doesn’t. Teams can distinguish what changes they need and where to apply them.
For example, a company specializing in customer intelligence can leverage a tactical dashboard template. It’s simple so they can make faster, better decisions using data such as purchase and browsing behavior and interactions on various digital channels.
4. The Analytical Dashboard
An analytical dashboard has large data sets that analysts use to support the executives. It gives a detailed overview of the essential data to drive decisions.
For instance, a packaged goods company can use an analytical dashboard to monitor daily operations. It shows when, where, and what people purchase. It’s a vital tool when forecasting market-share growth for better planning.
Uses and Benefits of KPI Dashboards
KPI dashboards ensure seamless operational processes by providing context to the bigger picture. Your dashboard reporting capabilities depend on the KPI dashboard software you select.
Profit.co allows you to create custom KPI Boards to track your most important metrics from across the organization. To learn more about how Profit.co can help you transparently track your KPIs, book a free demo with our experts today!
Customizing KPI dashboards based on the department makes it possible for all team members to have full transparency into the team’s most important metrics and targets.
Other outstanding benefits are:
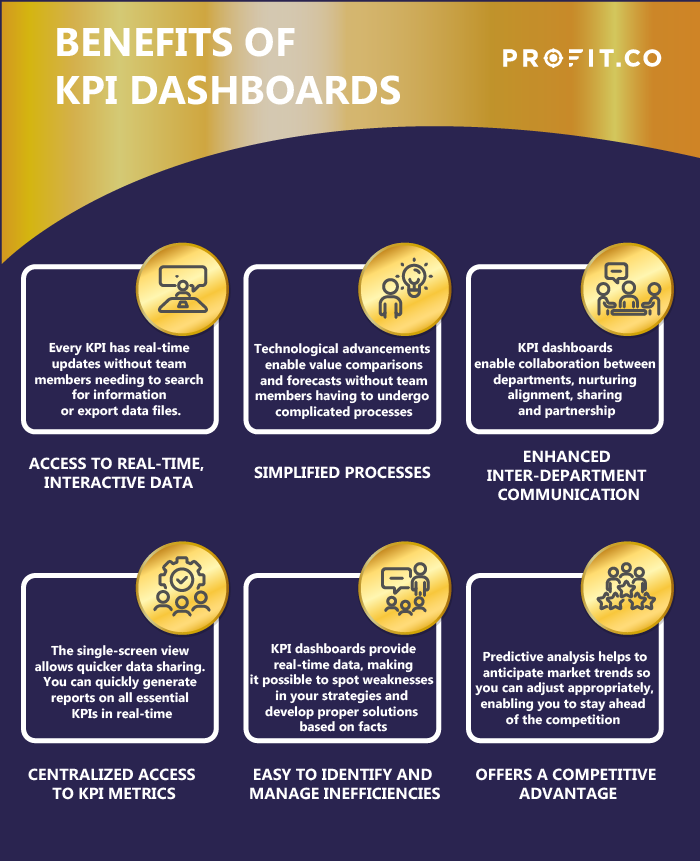
a) Access to real-time, interactive data
On KPI dashboards, every KPI has real-time updates without team members needing to search for information or export data files.
These live dashboards help to compare various elements through updated analytical insights. This interaction between factors allows you to filter data to get the most realistic view of your business.
b) Simplified processes
Technological advancements such as AI have gifted us with intelligent predictive analytics tools. These tools enable value comparisons and forecasts so that businesses can predict the future more accurately without team members having to undergo complicated processes.
c) Enhanced inter-department communication
KPI dashboards enable collaboration between departments for a well-aligned company. It’s an excellent way to nurture sharing and partnership, leading to more valuable decision-making.
d) Centralized access to KPI metrics
The single-screen view allows quicker data sharing. You can quickly generate reports on all essential Key Performance Indicators in real-time.
e) It’s easy to identify and manage inefficiencies.
KPI dashboards provide real-time data, making it possible to spot weaknesses in your strategies. It becomes easy to develop proper solutions based on facts.
f) A competitive edge
KPI dashboards offer accessible, intuitive, and reliable tools to analyze your data for helpful insights. Predictive analysis also helps to anticipate market trends so you can adjust appropriately. It’s among the best ways to stay ahead of the competition.
How to Design the Best KPI Dashboard for Your Business
A KPI dashboard centralizes mission-critical data. An effective dashboard should show your current position and the actionable insights to enhance performance and growth.
Here are some tips to make your dashboard an invaluable tool:
1. Maintain your dashboards on one page or screen
A KPI dashboard aims to give you a quick, clear overview of your business and potential weak points. Adding too many details and multiple pages will take you longer to peruse the dashboard, which beats the purpose.
2. Track only the most vital KPIs to help you achieve your strategic and operations goals
If you maintain your dashboard on one page or screen, you’ll be more likely to focus on only the most essential information.
3. Select a proper and accessible method to display the dashboard
For the dashboard to serve its purpose, it needs to be accessible. If you’re using any KPI dashboard software, ensure that all team members who need the dashboard can access the software.
4. Simplify the dashboard for easy comprehension and navigation
Instead of cramming as much information as possible on a single page, organize the data logically and neatly.
According to Bernard Marr, a world-famous influencer in business and technology, most organizations fail to report most strategic information in a relevant way. They spend more time selecting and tracking KPIs without considering how to communicate the analytics.
It’s essential to ensure the dashboard is simple so that the team can understand the insights.
5. Focus on delivering coherent information
Avoid using elaborate designs to make the dashboard aesthetically exciting if the details are non-essential. Stay away from excess coloration or decoration. All dashboard components should have a purpose.
How to Design a Best-in-Class KPI Dashboard Template
1. Use charts or other visualization formats for metric performance
Charts and visualizations are a quick, easy way to interpret data. They summarize large data sets, making them easy to understand and are very helpful when making data-driven decisions.
2. Include fields for qualitative performance analysis
Qualitative analysis fields provide more contexts for the data. They help to elaborate the KPI metrics’ performance and recommend future actions. For instance, they explain how and why revenue got lost to help you decide what to do in the future.
3. Ensure the ability to explore more information on every metric
It’s always a great idea to include where the tracked KPI metrics originate from and how to calculate them. For instance, you should be able to track why expenses increase in one particular department instead of the whole organization.
Tracking KPIs is an essential part of any successful business. The best way to monitor your KPIs is using a transparent and up-to-date KPI dashboard.
A KPI dashboard is a visual interface that displays key business metrics and performance indicators in real time, helping organizations track progress toward their goals.
They provide real-time insights, simplify data analysis, improve decision-making, and help identify performance issues before they escalate
The main types include:
- Strategic dashboards – Focus on long-term goals
- Operational dashboards – Track daily activities
- Tactical dashboards – Monitor progress toward specific objectives
- Analytical dashboards – Provide deep data insights for analysis
KPIs measure performance metrics, while OKRs define goals and outcomes. KPIs are often used to measure the success of OKRs.
A good KPI dashboard is:
- Simple and easy to understand
- Focused on key metrics only
- Visually clear (charts/graphs)
- Accessible to relevant teams
- Designed to provide actionable insights


