


Objectives and Key Results (OKR) software, when correctly deployed, is an immensely powerful tool that can be used to guide an organization towards success. However, the way that the OKR software industry has evolved has caused many company leaders to approach the framework with many preconceived notions.
These notions include the idea that OKRs are synonymous with task management, or performance management. Both of these perceptions can cause issues with a company’s OKR implementation.
One question that many individuals new to OKRs ask is: “Will OKRs improve the performance of underperforming teams or underperforming employees?”
It is a common question many people ask while testing waters with OKRs. It’s important to note that the OKR framework isn’t a performance management methodology. However, OKRs can be used to help employees make better use of their time, effort, and skill. OKRs are a great way to get the most out of your team and therefore improve performance– but the approach you take to this performance improvement is very important.
The Business Process Equation
From a bird’s eye view, a business has several core business-processes, as well as a set of tools to create output. These outputs, in turn, lead to meaningful outcomes for the business. Many business leaders are eager to learn how to write good OKRs and how to ensure performance improvement because many of us are biased towards outputs or inputs. Leaders tend to wonder if they have the right people, and if those people are doing the right tasks.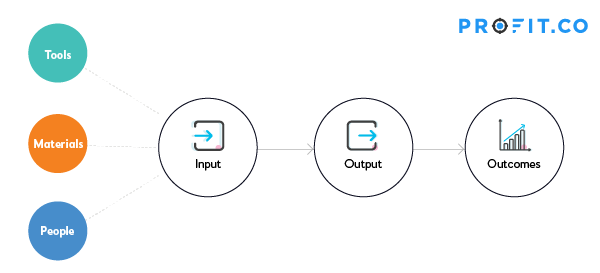
What happens when you are focused on Output?
Consider the following scenario: A finance director is monitoring the activities of his credit control team using a software dashboard. The actions of each credit controller are broken down into measurable tasks. In theory, each task triggers another task that should lead to effective credit control management and help the organization’s overall cash flow. The cash position of the organization is a significant focus of the executive team. They have a few hundred medium-sized clients with varying degrees of late payments. The dashboard shows that all tasks are completed. Despite the dashboard’s promise that the company is checking all the right boxes, the organization still struggles with significant cash flow problems. In this hypothetical example, the cause of this cash issue is that the company manages one large client outside the purview of the credit control team. This one client accounts for 50% of the organization’s problem debt. However, because the dashboard is geared towards measuring outputs and tasks, management misses this detail and are left scratching their heads. While this example might seem extreme and easily mitigated by effective management communication and cross-functional collaboration, it is often not as simple as that to fix. The larger an organization gets, and the more elaborate its silos and departmental structures, the more dependent it becomes on systems and reporting to inform the executive team of its progress towards its mission. The finance team can happily report that it is meeting or exceeding its performance standards, and all tasks are being conducted according to the plan. Regardless, the company will still be struggling. Companies that focus on output alone aren’t helping solve the issues in their organization, or guaranteeing they will find success with OKRs.What happens when you focus on Employees?
To properly understand the dangers of hastily-implemented OKR solutions, let’s look at another example. Our cash-strapped client in the previous example has shifted their focus from tasks to the people responsible for keeping credit risk under control. The organization took the view that a task focus had not delivered the right data framework, and they are now hoping for a more active approach. This time, the approach is more biased towards employee development. There is a heavy emphasis on skill alignment and ensuring that goals are cascaded down from the executive leadership team to individual team members. It sounds great in theory. The problem is that the very same issues exist with this approach as with the previous task focus. They are just masquerading under a different set of metrics. Developing an employee’s skill set sounds like an arguably good idea. Yet, it does not take too much creativity to imagine why it could be extremely counterproductive to focus only on employee skill without a holistic data set. Let us assume that this company has an ambitious expansion plan. Their path to success is deemed to be mostly dependent upon the performance of its incumbent sales team. They are a field sales team that was inherited from a recent merger. The data suggests that this team is collectively underperforming in a specific part of the sales cycle. The HR function acts upon this data and recommends an aggressive and expansive learning and development program to upskill the team. Nothing about this so far should seem particularly controversial. Yet, just like in the credit control example, the metrics fail to identify that the critical fundamental opportunity for rapid improvement would not be found by training. In this particular example, the incumbent sales organization was made up of expensive field agents, and the company would have been better served by replacing them with high volume, lower cost telesales specialists. Both of these examples are relatively simplistic, and one would hope that any organization would be able to avoid these issues. And yet, due to the very nature of how complex organizations can become, easily-solvable issues can remain hidden from the vision of the solvers. These are examples of how data can be misleading when the OKR framework has been constructed around the wrong focus. The larger and more complex an organization gets, the more important it is for the OKR framework and chosen OKR software to be used correctly, and for business leaders to be well-versed on how to do OKRs.Where in this equation do you set your OKRs?

Business Process Interactions
Processes do not exist in isolation. There are many interconnections between processes. One process’s output or outcome will be the input for another process. For example, the outcome of the “lead generation” process is “qualified leads.” “Qualified leads” is the input to the “sales process.” You will have to visualize this interconnection, understand the different outcomes, and set key results for the appropriate people based on that. For example, look at the sales process below.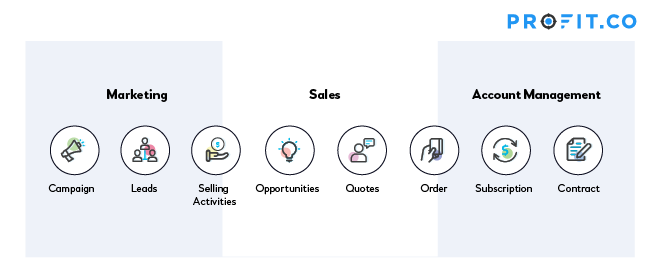
The Google Problem
Knowing the difference between inputs, outputs, and outcomes– and which ones you should measure– is an important part of maintaining the quality and relevance of your OKRs. You have to make sure that your OKRs make sense for the specific business function you are working with. Additionally, you need to make sure there’s a culture match between the types of OKRs you set, and the team you’re setting them for. To understand the importance of this step, consider the tech titan Google. Google is one of the most well-known proponents of the OKR framework’s merits, proudly utilizing it as a methodology to drive success. However, using Google’s OKRs as a case study for OKR best practices carries any number of challenges for those organizations seeking to emulate their success. Consider this statement from Don Dodge in 2010 about the way Google sets and tracks its goals: “Achieving 65% of the impossible is better than 100% of the ordinary” Organizations have taken this as a mantra for goal setting within their OKR programs. It’s another version of the “Shoot for the moon, and even if you miss, you’ll land among the stars” philosophy. And on the surface, it seems both credible and praiseworthy in its aspirational approach. And yet, unchecked, this Google goal emulation philosophy may do more harm than good within an organization. Think about an organization that may have evolved with well moderated, conservative, and regularly achievable goals. A team that’s used to seeing 100% OKR progress each quarter might become disillusioned when they are suddenly underachieving on all of their goals. Committing to such an ambitious goal-setting technique before employees have been properly trained on the rules of the framework is a gamble. A misguided software vendor might encourage one method that is completely out of alignment with the company’s culture. A workforce that has become used to receiving praise for 100% goal attainment may not feel that “65% of the impossible” is a success, and might lose steam before they can even reach that threshold.The GLUT Effect
What do Google, LinkedIn, Uber, and Twitter have in common?
Aside from being category giants within their industries, they are all famously passionate advocates of OKRs. These companies are often quoted in the OKR world as aspirational models for other organizations to aspire to.Is this a problem?
Potentially yes.The GLUT companies indeed adopted OKR software in extremely effective ways, but they had many additional and arguably unrepeatable factors perpetuating their success. Copying the OKR approaches of these high-profile success stories is unlikely to yield comparable successes for your organization. The lack of a more holistic approach to goal-setting and OKR vendor selection and implementation could lead to disappointment. To be successful with your OKR implementation, it requires and deserves a far more consultative approach.Here are some examples to help you understand the OKR outcomes & output
| Objective #1 | Improve product stability | |
|---|---|---|
| KR 1 | Decrease production exceptions from 2000 to 200 | Output |
| KR 2 | Achieve an uptime SLA of 99.9% | Outcome |
| Objective #2 | Build a high-performance team | |
|---|---|---|
| KR 1 | Launch OKR driven PMS solution by Q1 | Output |
| KR 2 | Increase on time delivery rate of system features from 85% to 98% | Outcome |
| Objective #3 | Make the website more intuitive for our customers | |
|---|---|---|
| KR 1 | Conduct 30 web-based user testing sessions | Output |
| KR 2 | Address top 5 UX issues causing cart abandonment | Output |
| KR 3 | Decrease the number of clicks to place an order from 8 to 2 | Outcome |
| KR 4 | Increase in average basket size from $39 to $65 | Outcome |


