


Published Date: March 30, 2026
TL;DR
The hockey-stick effect, where project progress flatlines for weeks and then spikes sharply at or after a deadline, is not a team-behavior problem. It is a design problem in measurement systems. Most Project Portfolio Management tools rely on binary task completion: zero credit until a task is finished and full credit only upon completion. This creates a progress view that hides work in progress, masks schedule variance, and delays the opportunity for early corrective action. It also assumes all tasks are equal, ignoring differences in priority and duration. As a result, completing several short, low-impact tasks can make a project appear nearly complete, even while a critical, long-duration task remains untouched. The solution is a weighted status methodology that recognizes work in progress before the deadline arrives, while also accounting for task priority and duration.
Let’s look at a familiar scenario. The senior leadership review is underway. The portfolio dashboard shows a project at 38% progress. No flags. No alerts. The PMO head presents the slide. The steering committee notes it and moves on. Two weeks later, the same project is at 75%. No breakthrough sprint happened. No major delivery event occurred. What happened is that the due date arrived, and a cluster of team members bulk-closed the tasks they had been sitting on for days.
Nobody in the room is surprised. Everyone has seen it before. The project manager breathes a sigh of relief. The PMO quietly updates the deck. And the pattern repeats on the next project, and the one after that. This is the hockey stick effect. And it is not an execution problem. It is a measurement system design problem.
What is the Hockey Stick Effect?
The hockey stick effect is a project progress pattern in which reported completion remains flat for most of the timeline and then rises sharply near or at the deadline, creating a curve resembling a hockey stick. This pattern does not reflect how work actually happens. Instead, it reflects how progress is measured, typically through binary completion that ignores work in progress, masks schedule variance, and delays the opportunity for early corrective action. It also assumes all tasks are equal, ignoring differences in priority and duration. How it shows up visually
When plotted on a timeline, the hockey stick effect becomes immediately clear. Progress appears stagnant for weeks, then suddenly spikes at the end, giving the illusion of last-minute acceleration rather than continuous execution. Here’s what that looks like in a typical project progress graph:
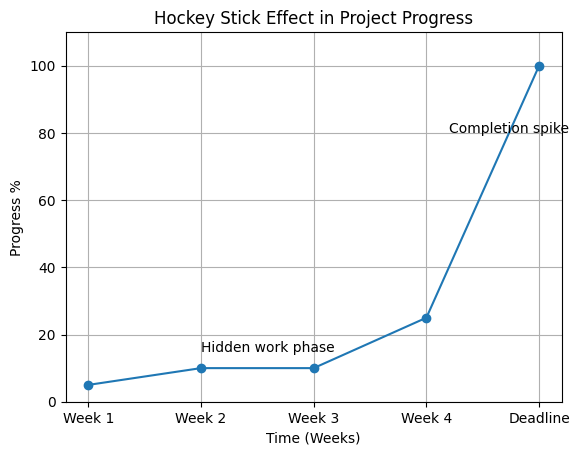
Weeks of flat or slowly moving progress. Then a sharp vertical jump at or immediately after the deadline. The handle and the blade. The hockey stick. It is one of the most consistent patterns in enterprise project reporting and one of the least examined.
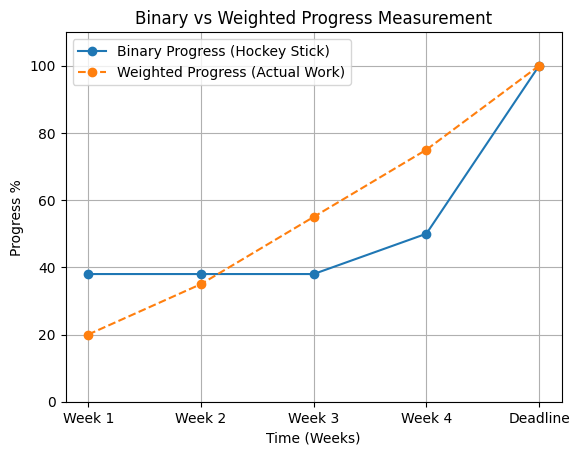
However, the hockey stick curve is not a reflection of how work progresses. It reflects how progress is measured. To understand the gap, we need to compare two fundamentally different approaches: binary progress and weighted progress.
Binary progress reports completion only when a task is fully done. Everything in progress is treated as zero. Weighted progress assigns partial credit based on stages or effort, making work visible as it progresses toward completion.
When these two approaches are plotted side by side, the difference becomes obvious. One hides execution until the deadline. The other reveals it as it happens.
Why It Happens: The Binary Task Problem
In most Project Portfolio Management tools, including many market-leading platforms in their default configuration, task progress is binary. A task is either complete or it isn’t.
A team member who has spent three or five days on a task contributes exactly zero percent to the project’s progress figure until the moment they mark it complete.
The consequence is structural and predictable:
- Progress figures flatline while work is actively in flight
- The moment tasks are closed, usually at or after the deadline, progress spikes
- The spike size is proportional to how many tasks were simultaneously in progress but unclosed
This creates two compounding problems that go beyond cosmetic dashboard issues.
1: Status discipline varies by person, not by project.
On a milestone with ten tasks across ten different owners, you have ten different update behaviors producing a single aggregate number. A high-discipline team member updates daily. A low-discipline one updates in batches. The milestone progress figure reflects neither; it reflects whoever closed tasks most recently.
2: The spike masks the signal that matters.
In Earned Value Management, the Schedule Performance Index measures how much value is being delivered relative to the plan. When tasks are binary and unclosed work contributes nothing, SPI appears artificially depressed during execution, then corrects sharply upward when the batch closes, masking true progress until the very end.
By the time the spike appears, the window for cost-effective corrective action has already closed. A project that shows 38% progress on Monday and 75% on Friday didn’t accelerate. It was being measured incorrectly the entire time.
The Exact Mechanics of How Progress Is Calculated
Most project managers report progress. Very few can precisely explain how their tool derives it. Here is the calculation logic that produces the hockey stick, using a real project structure as a reference:
Four-milestone project. Reported progress: 38.5%
| Milestone | Total Tasks | Completed | In Progress | Scheduled | Milestone Progress |
|---|---|---|---|---|---|
| 1 — Initiation | 30 | 30 | — | — | 100% |
| 2 — Planning | 70 | 20 | 50 | — | 29% |
| 3 — Development | 60 | — | — | 60 | 0% |
| 4 — Testing | 40 | 10 | — | 30 | 25% |
Project progress = (100 + 29 + 0 + 25) ÷ 4 = 38.5%
The problem is sitting right there in Milestone 2. Fifty tasks are currently being worked on. Under the binary model, those fifty tasks contribute nothing. The moment each is marked complete, the milestone will jump from 29% to 43%, 57%, 71%, 86%, or 100% in whichever batch each team member decides to submit. The spike is already loaded and waiting. The measurement system was built into it.
The Wrong Fix: Time-Duration Progress
This instinct often comes from a valid concern: not all work is equal in duration. For example, if a project has three tasks of two days each and one task that spans two months, completing the three short tasks would show 75% progress under simple task-count methods, even though the majority of effort still lies ahead. Duration seems like a logical way to correct that imbalance.
The problem is fundamental. According to the Project Management Institute and its Earned Value Management framework, effective progress tracking depends on a clear distinction:
| Metric | What it tells you |
|---|---|
| Planned Value (PV) | Where you planned to be |
| Earned Value (EV) | Where you actually are |
Time-based progress breaks this model by assuming that time elapsed equals work completed. That assumption forces Earned Value to mirror Planned Value. As a result, the Schedule Performance Index stays artificially perfect at 1.0 until the task actually misses its deadline.
This is exactly what you do not want. SPI is valuable because it provides early warning, days or weeks in advance, that execution is slipping. Time-based progress removes that signal entirely.
It does not fix the hockey stick effect. It replaces it with something worse: a smooth curve that looks accurate, but hides risk until it is too late. Duration matters, but using time elapsed as a proxy for progress is not the answer. Forcing EV to equal PV does not improve visibility. It disables your early warning system.
The Right Fix: Weighted Status Progress
The methodology that addresses the hockey stick without destroying EVM integrity is weighted status progress — assigning a defined percentage of credit to each task status, so that in-flight work contributes meaningfully without claiming full completion credit. PMI formally recognizes several fixed-formula approaches in PMBOK 7th Edition.
| Method | How It Works | Best For |
|---|---|---|
| 0/100 Rule | Zero credit until done; 100% on completion | Short tasks, binary deliverables, governance-heavy work |
| 50/50 Rule | 50% credit on start; 50% on completion | Most enterprise projects, recommended default |
| 20/80 Rule | 20% on start; 80% on completion | Long-duration tasks with late deliverables |
| Custom Weighted Status | Each status is mapped to a defined % | Enterprise orgs with multi-stage workflow semantics |
Applying the 50/50 rule to the same project above recalculates Milestone 2 from 29% to 64%, because the fifty in-progress tasks now contribute 50% credit each. Project-level progress moves from 38.5% to 47.3%.
The number more accurately reflects the actual state of work. And the spike at completion will be proportionally smaller, because progress will have accrued incrementally as work progressed, rather than all at once when tasks close.
The Governance Rule That Makes It Work
Weighted status progress introduces one new risk: if every project manager in an enterprise portfolio configures their own status weights differently, the portfolio rollup becomes meaningless. Milestone 2 on Project A might use 30% for In Progress. Milestone 3 on Project B might use 70%. The aggregate portfolio progress figure becomes an apples-to-oranges comparison.
The fix is governance, not feature restriction:
- Org-level default configuration: defined by the PMO, applied across all projects as the baseline standard
- Methodology rationale documentation: why specific weights were chosen, mapped to PMI fixed-formula standards for defensibility in governance reviews
- Project-level override permissions: available to senior PMs for specialized projects, with explicit documented justification
This follows the PRINCE2 manage-by-exception principle: establish a standard at the portfolio level, allow projects to deviate only with documented justification and appropriate authority.
What Changes When the Hockey Stick Is Eliminated
| Scenario | Binary Task Model | Weighted Status Model |
|---|---|---|
| 50 tasks in progress, none closed | Milestone shows 29% | Milestone shows 64% |
| Team member working Day 3 of 5 on a task | Contributes 0% to progress | Contributes 50% to progress |
| Portfolio review, project “looks healthy” | SPI artificially set to 1.0 until deadline | SPI reflects genuine delivery velocity |
| Deadline approaches with tasks unresolved | Sudden spike when tasks close | Progress has been accruing — spike is proportionally smaller |
| PMO credibility | Dashboard figures require verbal explanation at every review | Dashboard figures reflect business reality without context needed |
Fix the Hockey Stick in Your Portfolio
Quick Audit: Does Your Portfolio Have a Hockey Stick Problem?
| # | Question | Yes | No / Partial |
|---|---|---|---|
| 1 | Have you seen projects jump more than 15 percentage points in a single week without a major delivery event? | ||
| 2 | Does your PPM tool use binary task completion — zero credit until done, full credit on close? | ||
| 3 | Does your portfolio SPI remain close to 1.0 for extended periods then correct sharply at deadline? | ||
| 4 | Do team members typically update task status in batches rather than in real time? | ||
| 5 | Does your PMO regularly need to verbally explain why a progress figure doesn’t reflect what the team is actually doing? |
Three or more “Yes” answers means the hockey stick effect is active in your portfolio — and the measurement system is hiding schedule variance until it is too late to act on it cost-effectively.
The hockey stick effect describes the pattern where project progress flatlines for an extended period, then spikes sharply at or immediately after a deadline, producing a progress timeline that resembles a hockey stick on its side. It is caused by binary task completion models that give zero credit for work in progress, mask schedule variance, and delay the opportunity for early corrective action. It also assumes all tasks are equal, ignoring differences in priority and duration and gives full credit only when a task is formally closed.
Because it is built into the measurement system design, not caused by team negligence. When the tool gives no credit for work in progress, tmasks schedule variances and delays early corrective action. It also assumes all tasks are equal, ignoring differences in priority and duration. Team members have no incentive to update status continuously; the number doesn’t change until they close the task. The system incentivizes batch-closing at the deadline. Fixing the behavior without fixing the measurement model produces no durable change
The 50/50 rule is a PMI-recognized fixed-formula progress method that assigns 50% credit when a task is started and 50% credit when it is completed. It acknowledges work in flight without claiming full credit for completion, reducing hockey-stick spikes while preserving meaningful Schedule Performance Index signals
Time-duration progress assumes time elapsed equals work accomplished, which collapses Earned Value into Planned Value and forces Schedule Performance Index to equal 1.0 regardless of actual delivery velocity. This eliminates the early warning signal that EVM provides. A team genuinely behind schedule will appear on track until the deadline passes
If each PM configures their own status weights, the portfolio rollup becomes an inconsistent comparison, some projects using 30% for In Progress, others using 70%. The governance fix is an org-level standard defined by the PMO, applied as the default across all projects, with project-level overrides requiring documented justification


