

The OKR Fulfillment Score condenses objective and key result progress into one comparable number for a person, team, or department. You can now open a trend panel directly from that score to see how it has moved across the selected period.
Table of Contents
What is the OKR Fulfillment Score?
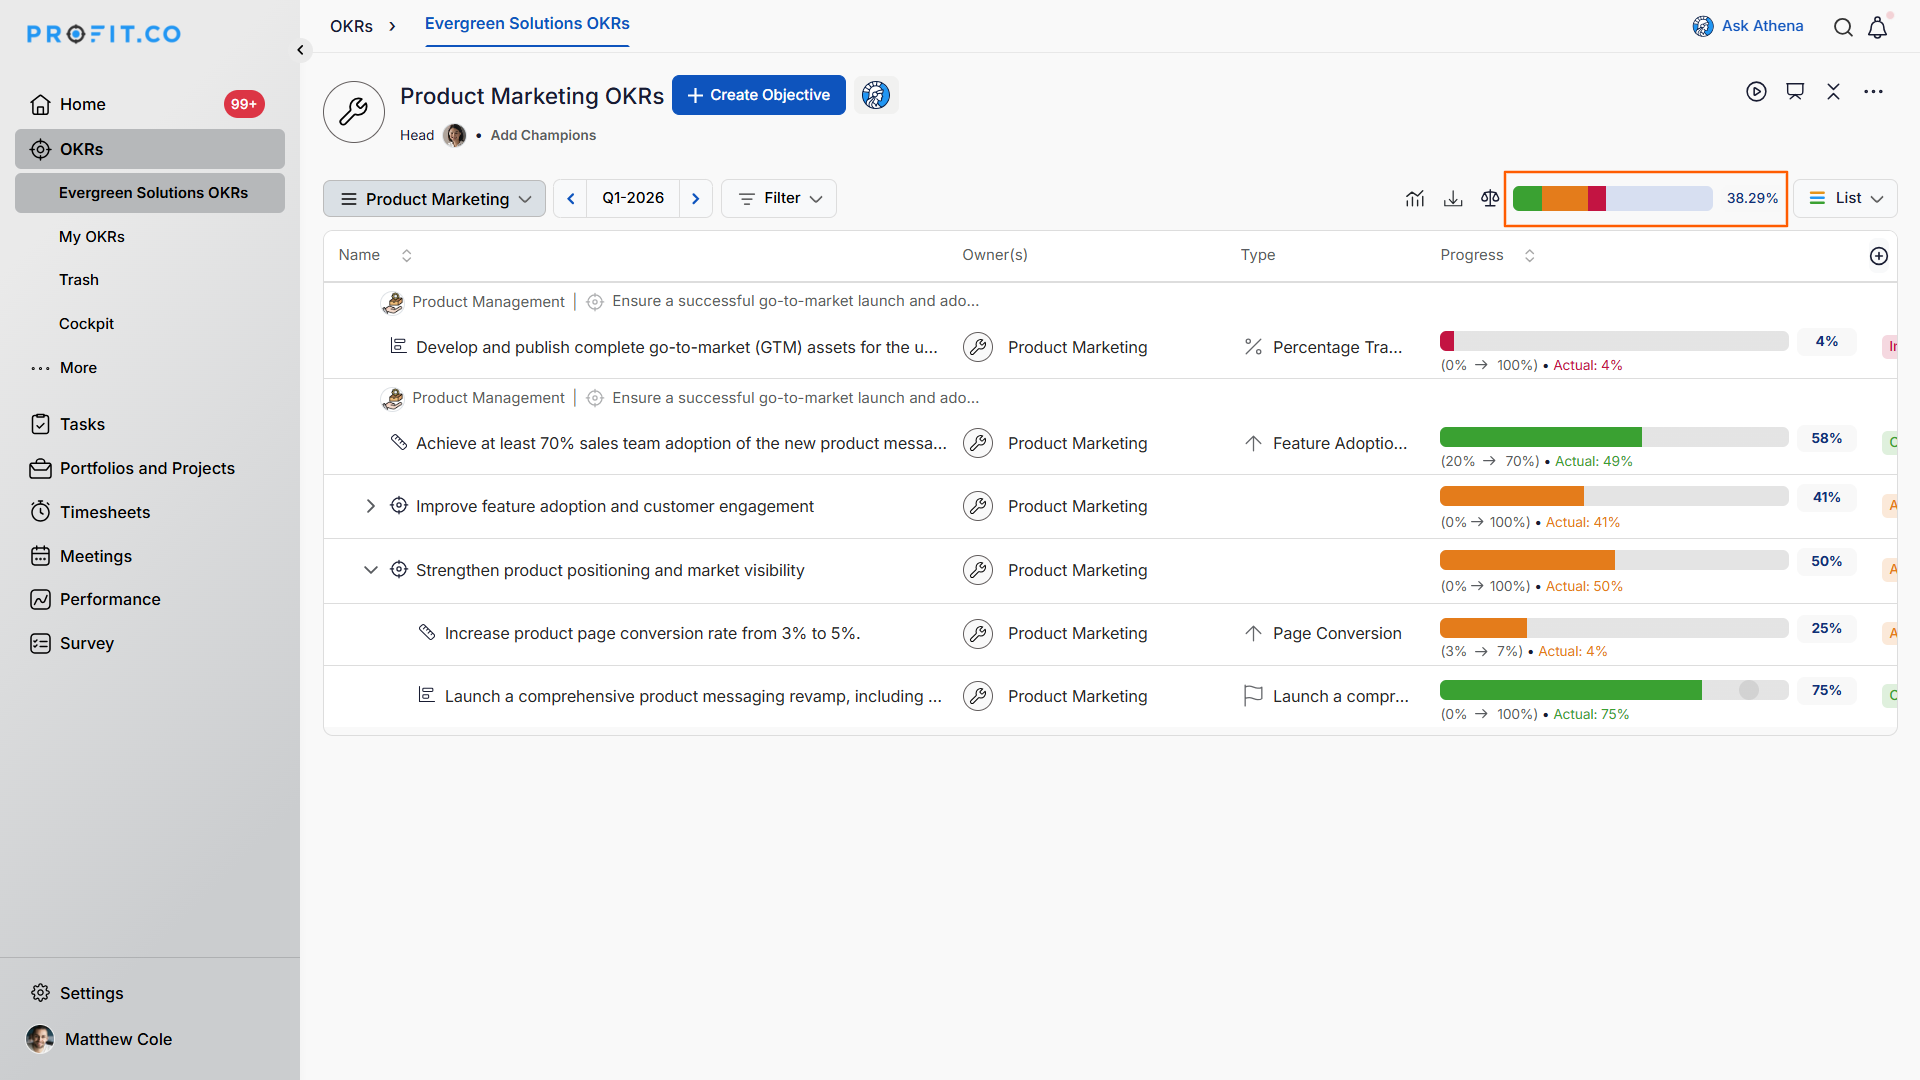
The OKR Fulfillment Score is the average progress of every Objective and assigned Key Result within a defined scope, such as a person, team, or department. If a Key Result sits under an Objective in the same department, its progress already flows into that Objective's score, so only the Objective is counted. Key Results assigned in from another department count on their own, separate from their parent Objective.
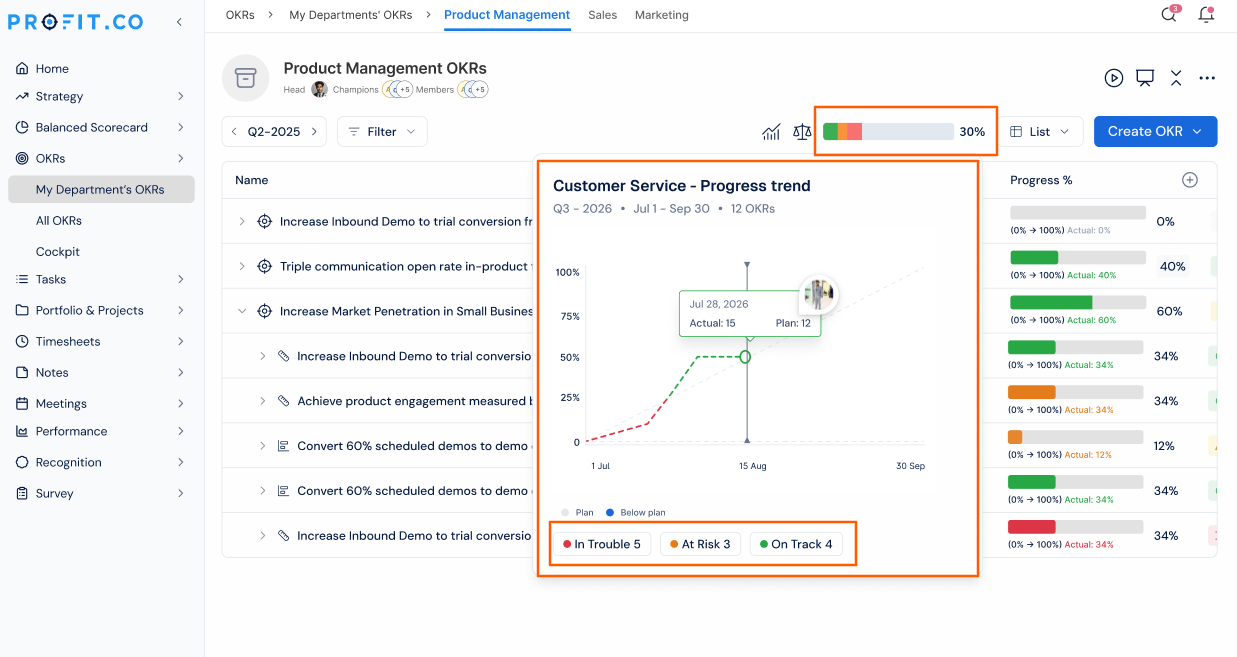
The fulfillment bar that displays this score is clickable. Clicking it opens a trend panel showing how the score has tracked over the selected period, available to anyone who can already view the OKR list.
Why the OKR Fulfillment Score Matters
A single fulfillment number lets HR and leadership compare Objectives and Key Results against the same standard, instead of judging each department's progress in isolation. This keeps accountability and alignment consistent across the organization.
Before the trend panel, the score only showed a snapshot, so you could not tell whether a department was recovering or slipping without pulling a separate report. Now the Progress view plots actual fulfillment against the plan over time, and a single click on a status count in the panel footer filters the OKR list to the at-risk items, without opening the filter control separately.
How It Works
Step 1: Open the OKRs List
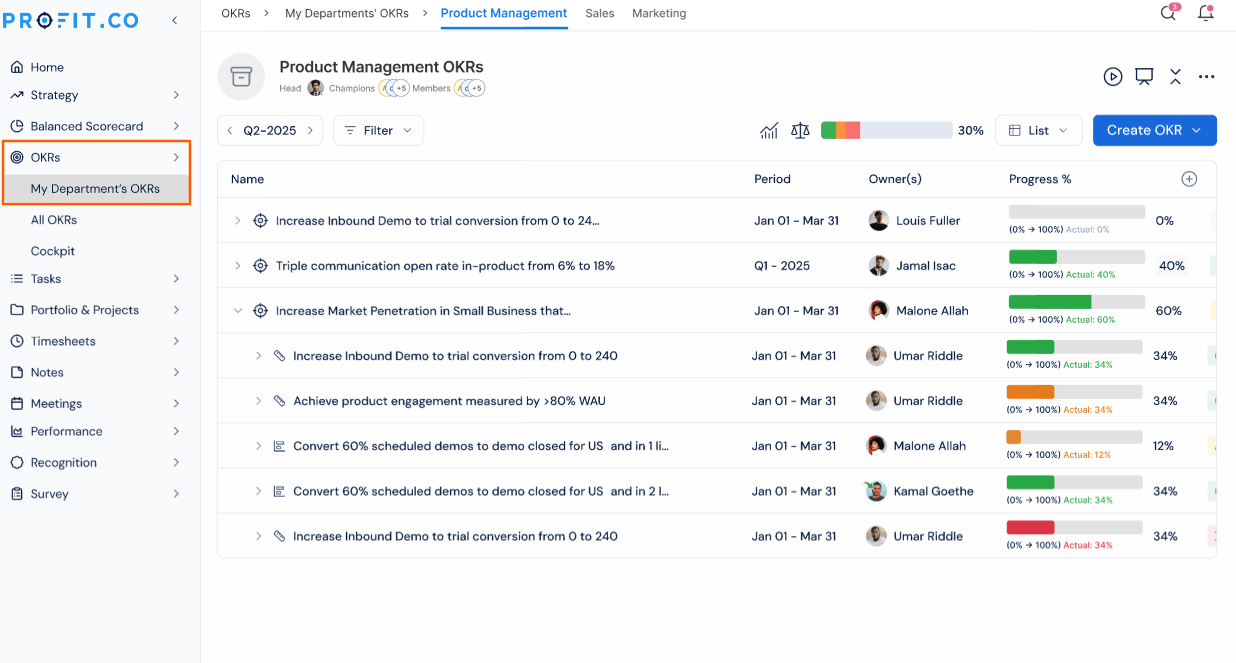
- Navigate to OKRs from the left navigation panel.
- Click the fulfillment bar for the scope you want to review.
The panel shows two views:
- Progress — shows how actual fulfillment has tracked against the plan across the period. The actual line is plotted up to the last check-in date; the plan line continues to period end.
- Status mix — shows how many OKRs were in each status on each date across the period.
The x-axis reflects the check-in frequency configured — for example, a monthly check-in cadence displays the chart with month labels (Jan, Feb, Mar, and so on).
OKR Fulfillment Score Scenarios and Their Outcomes
| Scenario | What Happens |
|---|---|
| You open the fulfillment trend panel. | Profit.co displays historical progress and status data only. It does not change the OKR's current progress, weight, or status. |
| You view the Progress tab after missing recent check-ins. | The actual fulfillment line stops at the last recorded check-in date. The plan line continues to the end of the review period. |
| You switch to the Status mix view. | Profit.co plots how many OKRs sat in each status on every date across the selected period. This shows how the status mix shifted over time. |
| You click a status count in the panel footer. | Profit.co filters the OKR list to show only the items in that status. The trend panel's underlying data stays unchanged. |
| You review OKRs configured with a different check-in cadence. | Profit.co labels the trend panel's x-axis using that cadence. A monthly cadence, for example, shows Jan, Feb, and Mar labels. |
Calculation Logic Explained
The fulfillment score is calculated using the formula below, applied to every Objective and assigned Key Result in scope.
Formula: OKR Fulfillment Score = (Total objective progress + Total assigned key result progress) / (Number of objectives + Number of assigned key results)
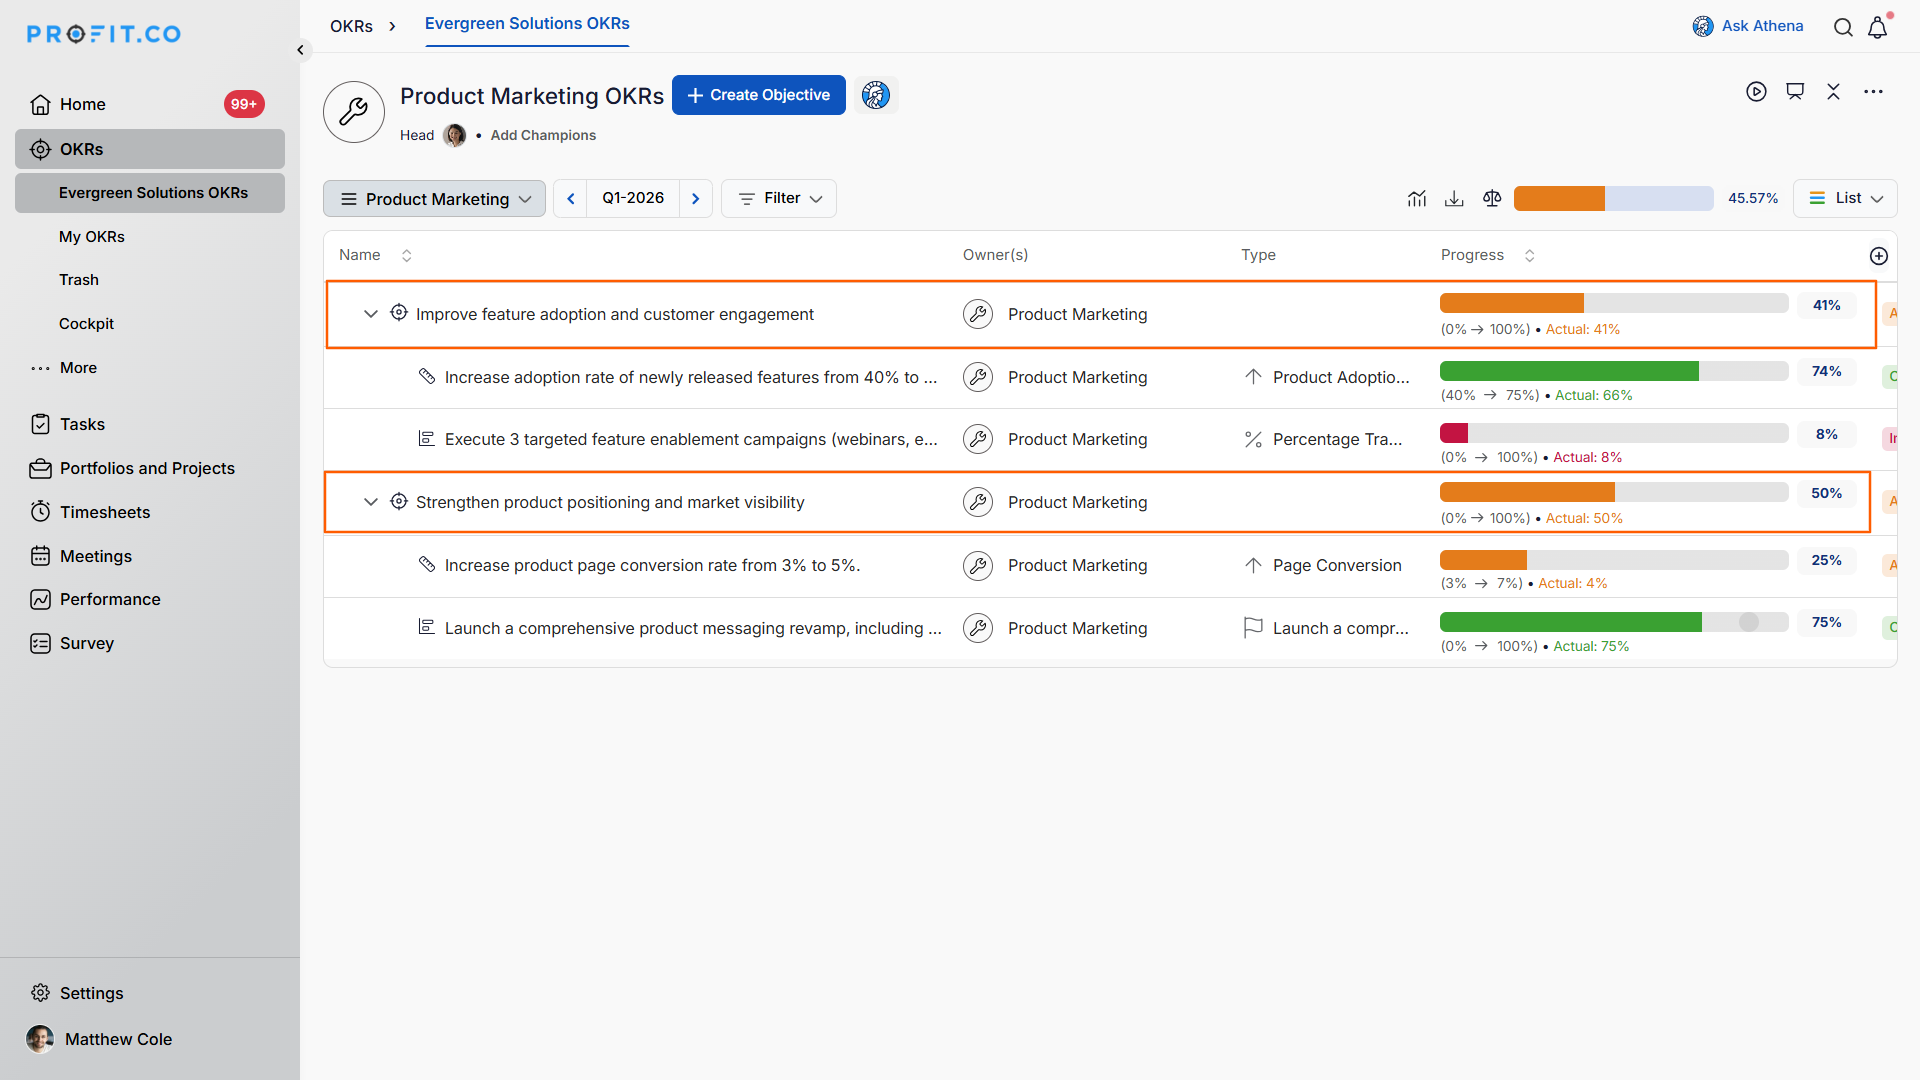
Consider the Product Management Team has two Objectives:
- Objective 1 progress: 41%
- Objective 2 progress: 50%
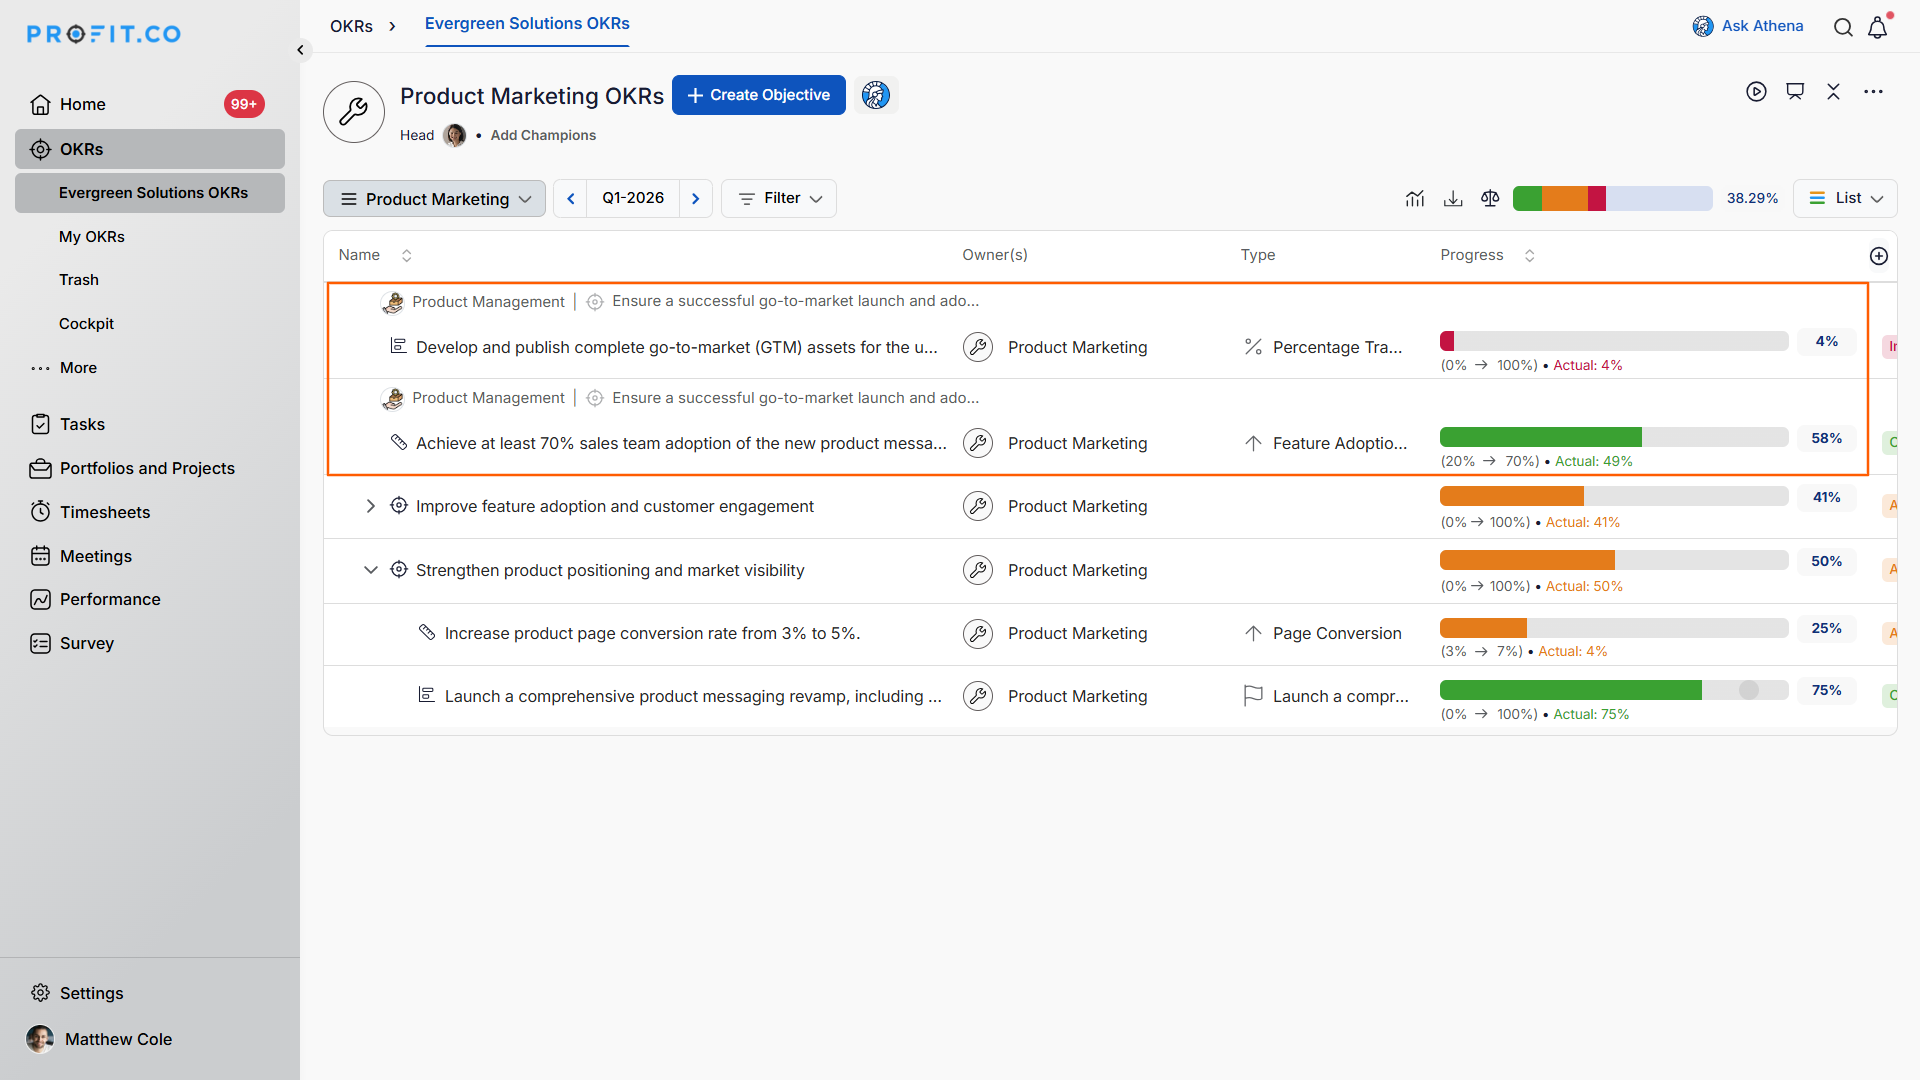
The Product Management Team has assigned two Key Results to the Product Marketing Team:
- Assigned Key Result 1 progress: 4%
- Assigned Key Result 2 progress: 58%
| Component | Value |
|---|---|
| Total of Objective progress | 41% + 50% = 91% |
| Total of assigned Key Result progress | 4% + 58% = 62% |
| Number of Objectives | 2 |
| Number of assigned Key Results | 2 |
Hence, OKR Fulfillment Score = (91 + 62) / (2 + 2) = 153 / 4 = 38.2%
Note
When weighting is enabled, the score reflects weighted progress instead of a simple average, and the fulfillment slider shows a vertical line marking the total assigned weight.
Best Practices for the OKR Fulfillment Score
- Turn on weighting only for Objectives where certain Key Results carry more strategic importance, since the score recalculates using weighted values instead of a simple average once enabled.
- Check the vertical weight indicator on the fulfillment slider before publishing an OKR, since it flags any under or over-assignment against the total weight.
- Review the trend panel's Progress view before quarter-end, since the actual line only extends to the last check-in date and cannot project movement beyond it.
- Use the Status mix view instead of exporting a separate report when you only need a quick read on status distribution over time.
- Click directly into a status count when triaging at-risk OKRs, since it filters the list immediately without opening the filter panel separately.
Related Articles
Frequently Asked Questions
No. It uses the same access as the OKR list, so anyone who can already view the list can open it.
No. The formula and worked example above still determine the score. The update only adds the trend panel on top of the existing calculation.
Yes. Both views live inside the same trend panel, so you can toggle between them without reopening it.
Execute your strategy with confidence
Connect OKRs, tasks, and teams in one place with Profit.co
