In this guide
- Key Takeaways
- What Is an X-Matrix?
- What Does the X-Matrix Solve?
- Hoshin Kanri and the X-Matrix
- The Four Quadrants of the X-Matrix
- What is Cascading in the X-Matrix?
- How to Create an X-Matrix: A Step-by-Step Guide
- What is Relationship Mapping?
- Strong, Medium, Weak Relationships
- Weighting: Bringing Objectivity to Prioritization
- Vertical vs Horizontal Formats
- Common Pitfalls for Beginners
- X-Matrix Strategy
- Best Practices for a First Implementation
- Conclusion
- Frequently Asked Questions
Key Takeaways
- The X-Matrix is the one-page visual that makes Hoshin Kanri actionable.
- It connects business drivers, annual objectives, initiatives, and ownership in a single framework.
- Cascading the X-Matrix aligns company and department goals.
- Relationship mapping shows how strongly initiatives support objectives.
- Both vertical and horizontal formats have their uses. Choose based on readability needs.
What Is an X-Matrix?
An X-Matrix is a one-page strategic planning tool used in Hoshin Kanri to connect an organisation’s long-term business drivers, annual objectives, key initiatives and accountable owners in a single visual framework. Each element in the matrix is linked to the elements it supports, creating a clear line of sight from strategy to execution.
The X-Matrix (also written as X Matrix, x-matrix, or Hoshin X-Matrix) is used in Hoshin Kanri strategic planning. It captures four types of information: long-term business drivers (what the organisation is trying to achieve over 3-5 years), annual objectives (specific targets for this year), initiatives (the projects that will deliver those targets), and owners accountable for each initiative.
Outside Japan, the tool is also called the hoshin matrix, hoshin planning matrix or Hoshin X-Matrix. All refer to the same structured framework, adapted slightly across industries and organisational cultures.
Profit.co’s Hoshin Kanri module digitises the X-Matrix: business drivers, annual objectives, initiatives and owners all live in the same platform. When an initiative updates its status, the connection to the objective it supports is immediately visible, so the “line of sight” from action to strategy stays live, not just on the planning document.
What Does the X-Matrix Solve?
If you’ve ever sat in a strategy review meeting with ten different slide decks, each using a different structure for goals, you’ll know the frustration and how good work gets lost in translation.
The X-Matrix was designed to solve that.
In Hoshin Kanri, it’s the single visual that connects long-term business drivers to the annual objectives, the key initiatives, and the people responsible for delivering them. Everything fits in one place. Not required to flip through multiple documents to figure out what connects to what.
For beginners, the challenge isn’t just learning the layout, it’s learning to read it, use it, and adapt it for your organization.

We cannot solve our problems with the same thinking we used when we created them.
–Albert Einstein
Hoshin Kanri and the X-Matrix: Where the Matrix Fits in the Process
Hoshin Kanri is a Japanese strategic planning methodology that translates an organisation’s long-term vision into specific annual objectives, initiatives and individual accountabilities. The X-Matrix is its primary visual tool: the single document that captures all four planning elements, business drivers, annual objectives, initiatives and owners, and the relationships between them on one page.
The Hoshin Kanri X-Matrix (also called the hoshin matrix or hoshin planning matrix) is the central document of the Hoshin Kanri planning cycle. It sits between the strategy development phase (where long-term business drivers are set) and the execution phase (where initiatives are assigned and tracked). The matrix makes that connection visible in one structured view.
Where the X-Matrix Sits in the Hoshin Kanri Cycle
| Hoshin Kanri phase | What happens | X-Matrix role |
|---|---|---|
| 1. Vision and direction | Senior leadership defines the 3-5 year breakthrough objectives and strategic direction | Business drivers (X1) are entered in the south quadrant |
| 2. Annual planning | The organisation translates the long-term direction into specific objectives for the current year | Annual objectives (X2) are entered in the east quadrant and linked to business drivers |
| 3. Initiative selection | Teams identify the high-level projects that will deliver the annual objectives | Initiatives (X3) are entered in the north quadrant and linked to annual objectives |
| 4. Accountability assignment | Owners are designated for each initiative, with a distinction between primary owners and supporters | Owners (X4) are entered in the west quadrant and linked to initiatives |
| 5. Cascading | Company-level objectives become the starting point for department-level X-Matrices | A new X-Matrix is built at each level, with the company’s annual objectives becoming the next level’s business drivers |
| 6. Review and adjustment | Progress against the plan is reviewed monthly or quarterly | The X-Matrix is updated to reflect actual progress and any changes to priorities |
The X-Matrix is not a one-time planning document. In Hoshin Kanri, it is a living reference that the organisation returns to throughout the year, at every review, the question is not just “are we on track?” but “is the work we are doing still connected to the strategy we committed to?”
Profit.co’s Hoshin Kanri module digitises the X-Matrix: business drivers, annual objectives, initiatives and owners all live in the same platform. When an initiative updates its status, the connection to the objective it supports is immediately visible, so the “line of sight” from action to strategy stays live, not just on the planning document.
The Four Quadrants of the X-Matrix
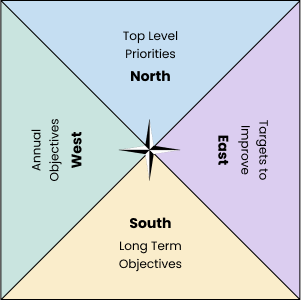
At its core, the X-Matrix is made up of four interconnected sections arranged in a cross or “X” pattern.
X1 – Business Drivers
These are the long-term strategic imperatives that define where the organization is heading over the next 3-5 years. Examples might include improving quality, reducing costs, increasing market share, or enhancing safety. In the X-Matrix, they form the “south” position, the anchor for everything else.
X2 – Annual Objectives
Annual objectives sit on the “east” side of the matrix. These are specific, measurable targets for the current year that directly advance the business drivers.
X3 – Initiatives or Priorities
Initiatives occupy the “north” side. These are the high-level projects or programs that will deliver the annual objectives. They’re not daily tasks, but substantial, outcome-driven efforts.
X4 – Owners
On the “west” side are the people accountable for each initiative. The X-Matrix makes ownership explicit, showing both the primary owner (responsible for delivery) and supporters (contributing to success).
Here is a quick summary:
| Quadrant Position | Content (Typical) |
|---|---|
| North (Top) | Improvement Projects / Initiatives |
| East (Right) | Metrics (KPIs), sometimes Owners |
| South (Bottom) | Long-term / Breakthrough Objectives |
| West (Left) | Annual Objectives |
How to Read the X-Matrix
The beauty of the X-Matrix is in its visual relationships. Lines or dots mark where one element supports another.
- From X1 to X2: Which annual objectives advance each business driver.
- From X2 to X3: Which initiatives deliver each annual objective.
- From X3 to X4: Who is responsible for each initiative.
By following these connections, you can trace any initiative back to the business driver it supports. It’s a clear “line of sight” from action to strategy.

What is Cascading in the X-Matrix?
Once you can read these relationships at a single level, the real power comes from connecting multiple X-Matrices across your organization. One X-Matrix is powerful. Multiple, connected X-Matrices create true organizational alignment.
Cascading means taking the company-level X-Matrix and using it as the starting point for the next level down, usually departments or business units.
Here’s how it works:
- Rotate the Matrix The company’s annual objectives (X2) become the “north” or left-hand priorities in the department’s matrix.
- Department Sets Initiatives The department defines its own initiatives (X3) that directly support those objectives.
- Assign Owners Department initiatives get their own primary owners and supporters, ensuring accountability at every level.
Most organizations stop at two levels: company and department. This keeps the process manageable while still ensuring alignment.
Solve your specific planning challenges and get your team moving in the same direction
How to Create an X-Matrix: A Step-by-Step Guide
Creating an X-Matrix is the process of populating four strategic quadrants, business drivers, annual objectives, initiatives and owners, and mapping the connections between them. The goal is a single-page visual that makes the line of sight from action to strategy explicit.
To create an X-Matrix: start with the south quadrant by listing 3-5 long-term business drivers, then populate the east quadrant with annual objectives that advance those drivers, then identify the initiatives in the north quadrant that will deliver each objective, then assign owners in the west quadrant, and finally map the relationships between all four elements using symbols.
The 6 Steps to Building Your First X-Matrix
| Step | Action | Common mistake | Output |
|---|---|---|---|
| 1. List your business drivers (X1, South) | Identify 3-5 long-term strategic imperatives: the outcomes the organisation must achieve over the next 3-5 years. | Listing too many drivers (more than 5) dilutes focus and makes the matrix unmanageable | X1 south quadrant populated |
| 2. Define annual objectives (X2, East) | For each business driver, define the specific, measurable targets for this year. Annual objectives should be concrete enough to know at year-end whether they were achieved. | Confusing drivers (multi-year) with objectives (this year). Drivers are the destination; objectives are this year’s progress toward it. | X2 east quadrant populated |
| 3. Identify initiatives (X3, North) | List the major projects or programmes that will deliver the annual objectives. Keep to significant, outcome-driven efforts, not individual tasks. | Including too many initiatives or listing tasks rather than strategic programmes | X3 north quadrant populated |
| 4. Assign owners (X4, West) | Name the primary owner for each initiative (accountable for the outcome) and supporters (contributing to it). Use a clear symbol to distinguish the two. | Assigning ownership without the owner’s involvement. Undiscussed accountability is not real accountability. | X4 west quadrant populated |
| 5. Map the relationships | Draw the connections between all four elements. Mark each intersection as strong, medium or weak to show how strongly an initiative supports an objective. | Marking every intersection as “strong.” If everything is equally important, nothing is. | Relationship matrix complete |
| 6. Review and validate with the team | Review the completed matrix with leadership. Check for: objectives with no initiative support (gaps), initiatives with no objective link (orphans), and overloaded owners. | Treating the matrix as final at this point. The review step is where misalignments surface. | Validated, approved X-Matrix |
What role do project sponsors play in the X-Matrix project pipeline?
In many X-Matrix implementations, particularly in larger organisations, project sponsors appear as a separate accountability layer in the west quadrant (X4). A project sponsor is the executive who champions an initiative at the leadership level, they are not the primary owner (who manages day-to-day delivery) but the person with the authority to remove obstacles and ensure the initiative stays resourced. In the X-Matrix project pipeline, sponsors appear alongside primary owners with a distinct symbol (often a triangle or “S” marker vs the primary owner’s circle or “O” marker).
Creating an X-Matrix manually takes time. Profit.co’s Hoshin Kanri module provides a structured digital X-Matrix template: add your drivers, objectives, initiatives and owners directly in the platform, map relationships with one click, and cascade to department-level matrices automatically.
What is Relationship Mapping?
Not all initiatives contribute equally to an objective. The X-Matrix captures this by marking the strength of each relationship. Relationship mapping is how the X-Matrix captures this reality by marking the strength of each connection between initiatives and objectives.
What are Strong, Medium, Weak in Relationship Mapping?
- Strong relationship: The initiative is a primary enabler of the objective.
- Medium relationship: The initiative has a significant but secondary effect.
- Weak relationship: The initiative provides only indirect support.
This mapping serves three purposes:
- It highlights under-supported objectives.
- It shows where initiatives might be misaligned.
- It helps focus conversations about priorities.
Weighting: Bringing Objectivity to Prioritization
When everything feels important, weighting helps decide where to focus. Execution priority is required for team clarity.
In many Hoshin Kanri implementations, each initiative is scored on three factors:
- Impact – How strongly it contributes to a business driver.
- Accountability – Whether the person is the owner or a supporter.
- Complexity – The effort, time, and resources required.
A scoring system helps leaders see which initiatives are high-impact, high-complexity and which may not justify the investment. Common scales include 1-3 (simple), 1-5 (moderate detail), or 1-9 (high precision), though some organizations prefer 4-12 point systems. Choose the scale that matches your team’s comfort with numerical analysis.
How to Choose Between Vertical & Horizontal Formats
The original X-Matrix is vertical, with the quadrants arranged so that reading certain connections requires tilting your head or rotating the document. While this compact format works for printouts, it can cause what some call the “neck twist problem” during live reviews.
| Format | Pros | Cons |
|---|---|---|
| Vertical | Compact and fits easily on one page. Matches traditional Hoshin Kanri training materials. | Harder to read in meetings, requires physical rotation or awkward screen viewing. Less intuitive for people new to the format. |
| Horizontal | Easier to read on screens or in group settings. Facilitates live discussion without rotating the view. | Can require more space, doesn’t always fit neatly into a single printed page. Slightly departs from the traditional visual, which may confuse those trained in the vertical style. |
If your team reviews the X-Matrix frequently in meetings, the horizontal format often wins for accessibility. If your priority is compactness and traditional form, stick with vertical.
What are the Common Pitfalls for Beginners Using the X-Matrix?
- Over-cascading Trying to push the matrix down to too many levels at once.
- Neglecting updates Letting the plan go static undermines its value.
- Unbalanced relationships Too many weak links indicate misalignment.
- Too many drivers More than 3-5 can dilute focus.
X-Matrix Strategy: How the X-Matrix Closes the Strategy-to-Execution Gap
An X-Matrix strategy is a Hoshin Kanri planning approach in which all strategic elements, long-term direction, annual priorities, initiatives and accountability, are captured and connected in one visual document. Its purpose is to eliminate the gap between strategic intent and operational execution by making every connection between action and strategy explicit and visible.
The X-Matrix closes the strategy-to-execution gap in three ways: it forces explicit prioritisation (you can only put so much in the matrix), it makes accountability public and specific (each initiative has a named owner), and it creates a line of sight from every initiative back to the business driver it supports.
Three Ways the X-Matrix Strengthens Strategy Execution
1. It forces focus
The physical constraint of the X-Matrix, four quadrants on one page, is not a limitation, it is a discipline. Most organisations have too many strategic initiatives. The matrix’s format limits the number of business drivers to 3-5, annual objectives to 3-5, and initiatives to a manageable set. When everything cannot fit on the page, the conversation about what to cut is the most valuable strategic conversation in the room.
2. It makes alignment visible rather than assumed
When a team member can trace their work to the strategy, alignment becomes real, not aspirational. The X-Matrix makes this trace visible: every initiative is mapped to the objectives it supports, and every objective is mapped to the driver it advances. If an initiative does not connect to anything, the matrix reveals that immediately.
3. It separates accountability from responsibility
The X-Matrix distinguishes between primary owners (accountable for the initiative’s outcome) and supporters (contributing to it). This distinction, rarely made explicit in traditional planning documents, prevents the diffusion of responsibility that allows important initiatives to drift. When accountability is named, the review conversation becomes specific: “this initiative is behind, what does the owner need?”
Profit.co’s Hoshin Kanri software makes the X-Matrix strategy executable: initiatives connect to OKRs and KPIs, owners receive automatic update reminders, and leadership sees the full line of sight from strategy to execution in real time.
What are the Best Practices for a First Implementation?
- Limit the number of business drivers.
- Post it where teams can see it or keep it in a shared workspace.
- Review regularly with monthly or quarterly check-ins to keep it relevant.
- Engage the owners to get more commitment.
- Use relationship mapping actively by discussing what they mean.
Conclusion: A Tool You’ll Actually Use
The X-Matrix is more than a diagram, it’s a way to keep an organization pointed in the same direction, from long-term strategy to daily action. By showing the connections between drivers, objectives, initiatives, and owners on one page, it eliminates guesswork and keeps priorities visible.
Whether you stick with the vertical format or adapt to a horizontal view, the real value comes from using the X-Matrix as a living, regularly reviewed map not just a planning artifact.
For beginners, the key is to start simple, cascade thoughtfully, and revisit often. Done right, the X-Matrix turns strategy from a document into an everyday guide for execution.
Struggling with strategic alignment in your organization?
Frequently asked questions
An X-Matrix is a visual tool used in the Hoshin Kanri methodology to capture and communicate strategic objectives and the means to achieve them. The Matrix allows for a comprehensive view of the organization’s strategic goals, the tactics to reach these goals, the metrics to measure progress, and the individuals responsible for achieving these objectives.
Cascading creates alignment by connecting company-level and department-level X-Matrices. The company’s annual objectives become the starting point (usually the “north” position) for department matrices. Each department then defines its own initiatives that directly support those objectives and assigns specific owners. This process ensures that every level of the organization is working toward the same strategic goals while maintaining clear accountability.
Relationship strength shows how much an initiative contributes to an objective. A strong relationship means the initiative is a primary enabler of the objective. A medium relationship indicates significant but secondary impact. A weak relationship shows only indirect support. This mapping helps identify under-supported objectives, highlight potential misalignments, and focus leadership conversations on the most critical priorities.