The strategy-to-execution gap isn’t one problem. It’s five problems wearing the same name.
The strategy-to-execution gap is the measurable distance between what a leadership team plans and what the organization delivers. Most organizations treat it as a single failure when it is in fact five distinct gaps that open at different points in the strategy-to-execution chain: the translation gap (strategy never converts to quarterly OKRs), the alignment gap (OKRs set but sprint work not anchored to them), the visibility gap (progress invisible until it is too late to course-correct), the portfolio gap (projects funded that do not move active key results), and the feedback loop gap (execution data never flows back to inform the next planning cycle). Closing all five structurally, through cascading OKRs, connected project portfolios, automated progress tracking, governance discipline, and structured learning cycles, is what separates organizations that deliver on strategy consistently from those that improve their planning without improving their results.
Table of Contents
In this article
- What the Strategy-to-Execution Gap Actually Is
- Why “More Execution Focus” Doesn’t Close It
- Gap 1: The Translation Gap
- Gap 2: The Alignment Gap
- Gap 3: The Visibility Gap
- Gap 4: The Portfolio Gap
- Gap 5: The Feedback Loop Gap
- The Five Gaps at a Glance
- How to Diagnose Which Gaps Are Open
- Worked Examples
- How Profit.co Closes All Five Gaps
- FAQ
Key Takeaways
- The strategy-to-execution gap is not one problem, it is five: translation, alignment, visibility, portfolio, and feedback loop. Each opens at a different point in the execution chain and requires a different closing mechanism.
- The most common misdiagnosis is treating the gap as an execution failure: it is a structural failure. Teams are executing. The architecture connecting execution to strategy is broken.
- The translation gap is the first to open and the hardest to detect: OKRs look active, but none of them trace to a company-level strategic priority.
- The portfolio gap is the most expensive: by mid-year, the majority of active projects in most organizations are serving last year’s priorities rather than this year’s.
- The feedback loop gap ensures the same structural failures repeat every quarter: OKR scores are produced but never diagnosed, so the next cycle inherits the same broken assumptions.
- Profit.co closes all five gaps in one platform: OKR cascading and alignment panels for translation and alignment; check-in discipline tracking and deviation indicators for visibility; tollgate-linked portfolios for the portfolio gap; and five KR progression models plus CRADI governance for the feedback loop.
1. What the Strategy-to-Execution Gap Actually Is
The strategy-to-execution gap is the measurable distance between what a leadership team plans and what the organization actually delivers. It forms not because the strategy is wrong and not because the teams are failing, but because the chain connecting strategy to execution is structurally broken at one or more of five specific points.
Every organization running OKRs has experienced the frustration: the annual strategy is well-articulated, the goals are documented, the quarterly reviews happen, and yet the strategy feels distant from the work happening week to week. That feeling is not a culture problem or a motivation problem. It is a structural diagnostic: somewhere in the chain between the boardroom and the task board, the connection broke.
The chain runs in four stages:
- Annual strategy: The direction the organization has decided to pursue in this planning cycle.
- Quarterly OKRs: The measurable 90-day commitments that translate the annual direction into team-level action.
- Sprint goals and projects: The work being funded, sequenced, and executed to move the OKRs.
- Daily tasks: The individual actions that aggregate into sprint output.
Each hand-off between stages is a potential gap. When all five gaps are present simultaneously, and they often are, the organization runs what looks like an execution system while operating, structurally, in four disconnected time cycles. Understanding why most organizations struggle to align strategy with operations requires naming which of the five gaps is actually open, not just recognizing that something is wrong.
2. Why “More Execution Focus” Doesn’t Close It
The standard organizational response to a strategy-to-execution gap is to demand better execution. More focus. More urgency. More accountability. This response fails because it applies the same intervention to five different structural problems.
When the gap is a translation problem, strategy was never converted to quarterly OKRs, adding execution urgency produces faster movement in the wrong direction. When the gap is a visibility problem, no one can see that OKRs are lagging until the quarterly review, adding accountability without early-warning systems produces blame without correction. When the gap is a portfolio problem, projects are consuming resources that don’t serve any active key result, driving execution harder accelerates drift rather than reversing it.
The three most common interventions that do not close the gap: more alignment meetings (adds reporting overhead without changing the structural disconnection), new tools added on top of existing systems (two systems requiring manual reconciliation is itself a gap-widening mechanism), and better dashboards (visibility without a correction mechanism reveals the problem more clearly without fixing it). Closing the gap requires treating the five sub-problems as what they are: five separate structural failures, each with a specific mechanism. Strategy execution frameworks that bridge the gap share one design principle: a single data layer where OKRs, project portfolios, and performance tracking share the same information, rather than three separate systems stitched together by manual reporting.
3. Gap 1: The Translation Gap
Where it opens: Between annual strategy and quarterly OKRs.
Primary cause: No cascading architecture exists to convert annual strategic direction into measurable 90-day commitments at team level.
Only 16% of knowledge workers report that their company effectively sets and communicates goals. This statistic understates the structural problem: the issue is not that goals are poorly communicated, but that goals are frequently set in isolation from the strategy they are supposed to advance. Teams author their quarterly OKRs based on their own priorities, their departmental remit, and whatever project commitments are already running, not based on the company’s stated strategic direction for the year. When the strategy pivots in April, the OKRs authored in January continue running unchanged. This is the translation gap. Strategy and OKRs co-exist without ever connecting. Understanding why smart enterprises still struggle with alignment almost always leads back to this structural point: OKRs are authored as goals, not as translations of direction.
Diagnostic signal: When a senior leader reviews the current quarter’s OKRs, they cannot trace each Objective to a company-level strategic priority without significant inference.
Closing mechanism: A top-down cascading architecture where company objectives generate department-level OKRs, which generate team-level OKRs. The cascade is not a reporting hierarchy, it is a translation chain. Each level down converts direction into a more specific, measurable, owned commitment. For teams working on shared deliverables across departments, bottom-up alignment allows teams to align their objectives and key results upward to a Key Result created by another department, lifting the restriction that previously blocked cross-departmental alignment on shared strategic outcomes.
4. Gap 2: The Alignment Gap
Where it opens: Between quarterly OKRs and sprint goals and projects.
Primary cause: Sprint planning and project funding decisions are not anchored to active key results.
The alignment gap is subtler than the translation gap because it can hide behind a healthy-looking OKR program. Teams are checking in. Scores are being recorded. Reviews are happening. But the work being executed in sprints is not connected to the OKRs being tracked. Sprint goals are derived from feature backlogs and technical debt queues rather than from the key results teams are committed to moving. The result: OKR scores reflect activity rather than outcome, and check-ins become a reporting ritual rather than a progress signal. How OKRs align with projects requires treating key results as the gate criteria for project funding, not as a parallel tracking layer running alongside project execution.
Diagnostic signal: When a project manager lists the active projects in their portfolio, fewer than 70% have a named key result they are directly moving. The remaining projects are funded by inertia, sponsor relationships, or prior commitments, not by strategic need.
Closing mechanism: Structural linkage between OKRs and the project portfolio, so every active project is mapped to at least one key result, and projects with no KR connection become visible and deprioritizable. The visual alignment panel, showing upward alignment and contributing OKRs as distinct cards with directional diagrams, makes the linkage (or the gap in linkage) immediately navigable without cross-referencing separate systems. The stacked rollup progress bar on parent OKR rows surfaces the health distribution of all contributing work at a glance, flagging alignment failures before they compound.
5. Gap 3: The Visibility Gap
Where it opens: Between ongoing execution and leadership’s real-time view of progress.
Primary cause: Check-in discipline is low; no early-warning mechanism exists between quarterly reviews.
The visibility gap is the one most frequently confused with an execution problem. The work is happening. People are busy. But the signal about whether strategy is on track doesn’t surface until the quarterly review, which arrives nine to eleven weeks after the quarter started. By the time a red OKR appears in the review, the options for recovery are narrow and expensive. Missing a check-in in week four is recoverable. Discovering in week ten that check-ins were missed in weeks four through nine is not. Always-on strategy requires continuous visibility, a live signal about whether execution is on track against plan, not a snapshot captured once per cycle.
Diagnostic signal: The organization’s first signal that a key result is off track arrives at the quarterly review, not mid-quarter. Check-in completion rates are below 80%. When a manager asks “how is this KR tracking?” the answer requires navigating to a separate system or asking a team member, the information is not surface-visible in the course of normal work.
Closing mechanism: Multiple mechanisms in parallel, because visibility failures compound: check-in discipline tracking at the manager level (direct and indirect reports, check-in status sorted worst-first, visible on the homepage without any navigation); plan deviation indicators on the check-in panel (showing planned value for the check-in date alongside actual, color-coded green for on-track and red for behind); planned vs actual progress comparison at the project level (side-by-side with a plain-language variance label); dependency graph view showing all upstream and downstream OKR relationships on a single canvas; and configurable threshold alerts that fire automatically when a project attribute, health status, budget utilization, EVM metrics, crosses a defined threshold, delivering notification through Action Center, email, or webhook the moment the condition is met.
6. Gap 4: The Portfolio Gap
Where it opens: Between this year’s strategic priorities and this year’s funded project portfolio.
Primary cause: Project funding decisions are driven by inertia and sponsor seniority rather than by connection to active key results.
When a COO reviews a project portfolio at mid-year and finds the majority of active projects serving last year’s strategic priorities rather than this year’s, that is the portfolio gap in full expression. It is not a strategic failure, the strategy changed. It is a translation failure, no one recalibrated the portfolio when it did. The projects that started in January were scoped, resourced, and committed under a previous strategic direction. When direction shifted in Q2, the portfolio continued executing Q1 priorities at full cost. By the time the mid-year review surfaces the misalignment, six months of execution budget has been spent on the wrong things. The hybrid OKR+PPM framework addresses the portfolio gap by making key results the gate criteria for project funding, so every active project earns its resources by moving a measurable outcome, not by inertia.
Diagnostic signal: At mid-year, the percentage of active projects mapped to current-quarter key results is below 70%. The portfolio review produces a list of project statuses, not a view of strategic return. Projects are deprioritized based on delivery performance, not on strategic relevance.
Closing mechanism: Mandatory tollgate selection on project creation (no project can be created without a defined stage-gate structure); tollgate-based project progress calculation (three modes available, by milestone completion, by milestone completion finalized on governance approval, or by tollgate approval only) so that progress figures reflect governance reality rather than just task activity; portfolio capacity heatmap showing over-allocated and under-utilized resources at a glance; project stage and health widgets by portfolio in the Cockpit, so executives can identify which portfolios carry the most risk without opening each one individually. For the portfolio optimization gap most companies miss, quarterly OKR rescoring against live project data is the mechanism that catches misalignment in weeks rather than after nine months.
7. Gap 5: The Feedback Loop Gap
Where it opens: Between execution results and the next planning cycle.
Primary cause: OKR scores are produced but not diagnosed; lessons from the closing cycle never feed into the assumptions shaping the next one.
The feedback loop gap is the quietest of the five, and the most damaging over time. At the end of each quarter, OKR scores are recorded. A team scoring 0.4 on a key result expected to reach 0.7 has produced a fact: the gap exists. What most organizations do next is move on: start the next quarter, author new OKRs, reset the cycle. What most organizations fail to do is ask why. Was the target miscalibrated from the start? Did a dependency fail? Did the team’s work actually advance the right outcome, or did the key result measure the wrong thing? Without that diagnosis, the next quarter’s OKRs are authored on the same structural assumptions as the last ones. The pattern repeats. Tools for strategy execution that actually work treat execution data as a feedback source, not just a reporting requirement.
Diagnostic signal: The same execution failures, a specific dependency type, a chronic misalignment between two departments, a repeating OKR category that consistently underperforms, appear in multiple consecutive quarters without structural correction. The post-quarter conversation produces lessons that are acknowledged but not institutionalized.
Closing mechanism: Five KR progression models, Linear, Front-loaded, Back-loaded, S-curve, and Stepped, so the plan shape matches actual work patterns from the first week of the quarter; when check-in actuals consistently trail the plan, the model itself becomes diagnostic. CRADI governance tracking inside every project, structured tracking across all eight governance categories (Actions, Assumptions, Decisions, Issues, Risks, Strategic Alignment, Project Changes, and Tollgates) with auto-generated IDs and immutable activity logs, means the record of what broke and why survives the quarter rather than disappearing into email threads. The Reflect and Reset cycle closes the quarter with structured questions (what assumption turned out wrong, what would we do differently from week one) that convert OKR scores into institutional learning rather than filed data.
8. The Five Gaps at a Glance
The five gaps are distinct problems that require distinct solutions. Organizations that treat them as variants of the same failure will produce the same intervention for five different causes.
| Gap | Where It Opens | Primary Cause | Diagnostic Signal | Closing Mechanism |
|---|---|---|---|---|
| Translation Gap | Strategy → OKRs | No cascading architecture; OKRs authored in isolation | OKRs cannot be traced to a company-level strategic priority | Cascading OKRs; Alignment Panel; Bottom-Up Alignment |
| Alignment Gap | OKRs → Sprint Goals | Sprint planning detached from active key results | Active projects lack a named KR they are advancing | OKR-PPM integration; Stacked Rollup Progress Bar; sprint goals anchored to KRs |
| Visibility Gap | Progress → Reporting | Check-in discipline low; no early-warning system | Red OKRs visible only at quarterly review | Check-in Discipline Widget; Plan Deviation Indicator; Threshold Alerts; Dependency Graph |
| Portfolio Gap | Priorities → Funding | Projects funded by inertia, not by KR connection | Majority of active projects serve last year’s priorities | Mandatory tollgate; Tollgate-based progress (3 modes); Portfolio Health Widgets |
| Feedback Loop Gap | Execution → Next Cycle | OKR scores produced but never diagnosed | Same failure patterns repeat every quarter | 5 KR progression models; CRADI governance (8 categories); Reflect & Reset |
The critical insight: any single gap left open eventually compounds all the others. The translation gap produces misaligned OKRs that seed the alignment gap. The visibility gap lets the portfolio gap widen undetected for months. The feedback loop gap ensures the translation gap reappears in the next quarter with new names and the same structural cause.
Which of the five gaps is open in your organization?
9. How to Diagnose Which Gaps Are Open
A useful diagnostic is faster than a full strategy audit. One targeted question per gap reveals which structural failures are present without weeks of analysis:
- Translation Gap: “How many of our current quarter’s OKRs can you trace directly to a named company-level strategic priority?” If the answer is “most of them, roughly” or requires inference, the translation gap is open.
- Alignment Gap: “How many active projects have a named Key Result they are specifically advancing?” If fewer than 70% of projects have this connection documented and visible, the alignment gap is open.
- Visibility Gap: “What percentage of scheduled check-ins were completed on time last quarter?” Below 80% is a visibility gap. “How does a manager currently find out if a key result is off track?” If the answer involves asking someone or navigating to a secondary system, the gap is open.
- Portfolio Gap: “How many of the projects we approved this year connect to this year’s strategic priorities rather than last year’s?” A mid-year portfolio review that reveals significant misalignment is the portfolio gap surfacing at the worst possible time.
- Feedback Loop Gap: “What structurally changed in this quarter’s OKR architecture based on what we learned from last quarter’s results?” If the answer is “we reviewed the scores and moved on,” the feedback loop gap is open.
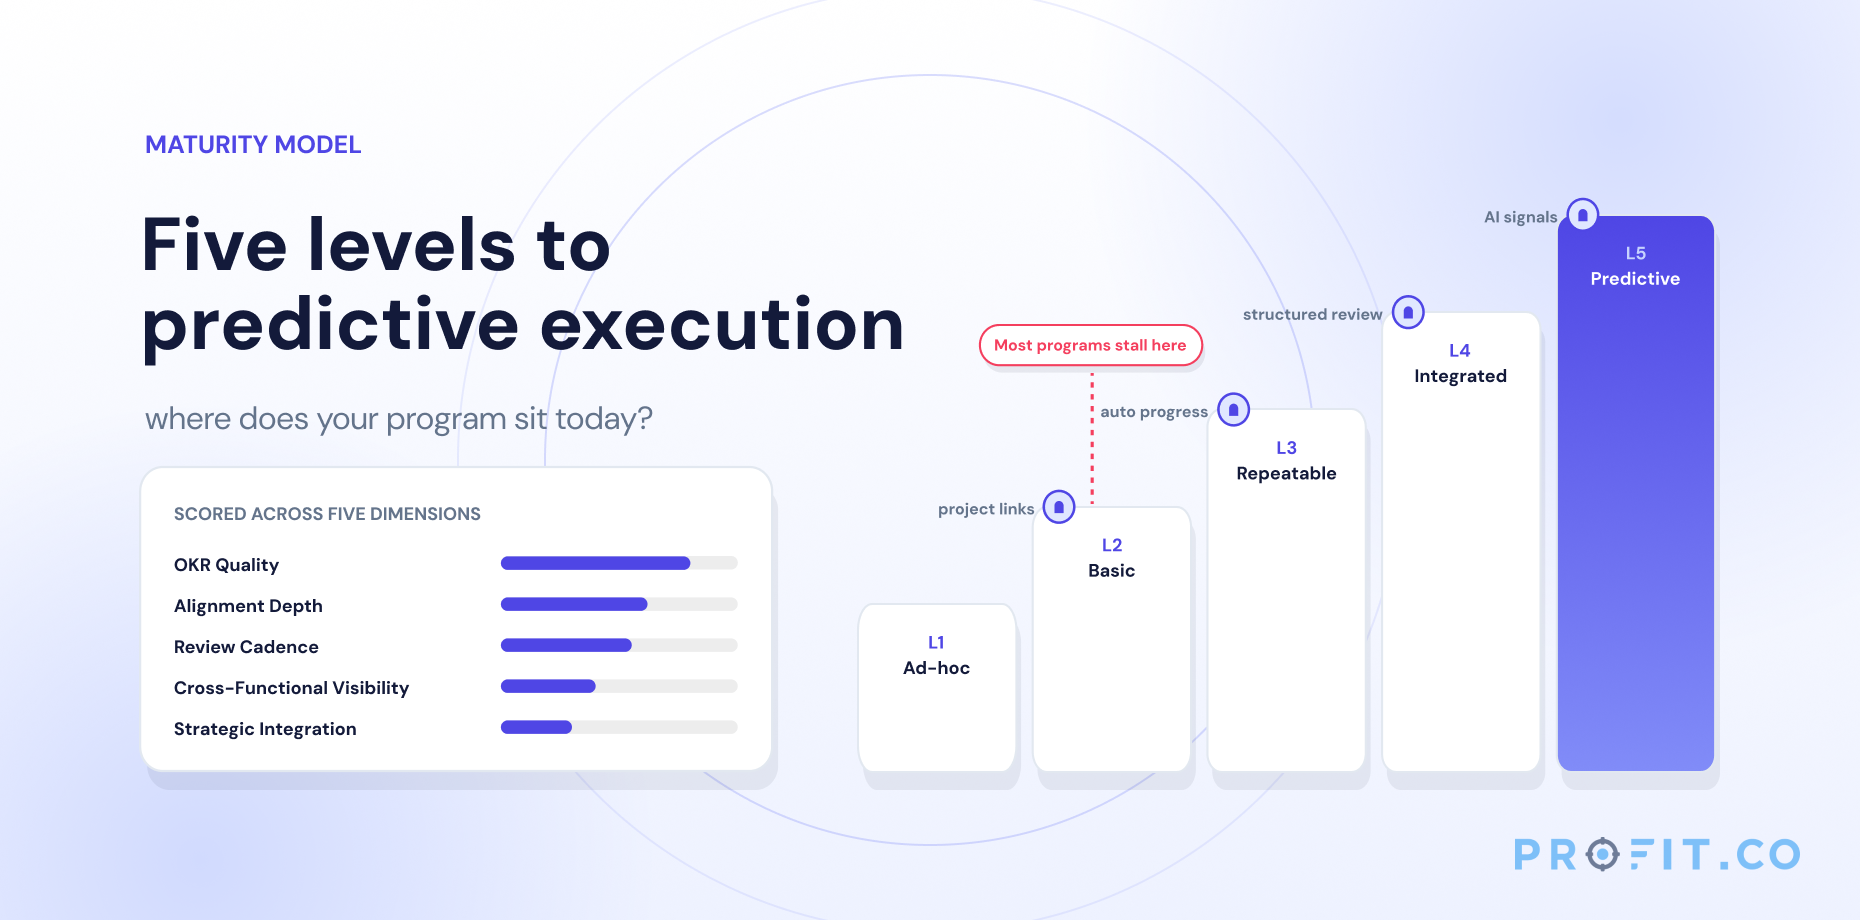
For organizations working through a more structured assessment, the strategy execution frameworks comparison and an OKR maturity model assessment can help locate which gaps are driving the greatest structural drag before committing to a remediation sequence.
10. Worked Examples
Example 1: The Financial Services Firm, Translation Gap + Alignment Gap
A 300-person financial services firm had been running OKRs for two years. Check-in completion was high. Reviews happened quarterly. And yet, at every review, the leadership team left uncertain whether the organization was actually moving its strategy. No one could point to a quarter where the OKR results had changed a strategic decision.
On audit, the cause was structural: every department had authored its Q1 OKRs before the company’s annual strategic planning session had concluded. Department heads worked from the previous year’s direction, which was 60 to 70% similar to the new direction, close enough to feel aligned, different enough to be wrong on the margin. Three of the company’s five strategic priorities for the new year had no department OKR touching them.
They rebuilt the cascade: company OKRs were set first, then department OKRs authored against the company OKRs directly. By Q2, every department could trace their top two OKRs to a specific company key result. By Q3, the quarterly review had something it had never had before: a signal. For how to structure cascading OKRs across enterprise without losing strategic alignment, sequencing the corporate planning cycle before department OKR authoring is the single highest-leverage change.
Example 2: The Technology Company, Visibility Gap
A 200-person product company ran weekly standups, monthly reviews, and quarterly OKR sessions. At the Q2 review, two of five company key results were below 0.4. One had never recovered from a dependency failure in week three of the quarter that wasn’t escalated until week eight. The other had been tracking behind plan since week five with no intervention because no one was monitoring the deviation.
They implemented three changes: check-in completion tracking that surfaced missed and late check-ins to managers on the homepage, sorted by severity; a plan deviation indicator that showed color-coded deviation from the expected weekly target on every check-in panel; and threshold alerts configured to fire automatically when a key result’s progress fell more than 15 percentage points behind the plan line.
In Q3, the first threshold alert fired in week four. The team escalated the issue to leadership in week five. Recovery was costly, but possible. The same failure in Q2 had arrived in week eight. The three-week difference between week four and week eight visibility was the difference between a recoverable situation and an unrecoverable one.
Example 3: The Manufacturing Company, Portfolio Gap + Feedback Loop Gap
A global manufacturer completed Q1 with seven projects in flight, two of which scored green on delivery. At mid-year, a portfolio review revealed that five of the seven projects were advancing initiatives that had been deprioritized in the new strategic direction agreed at the annual planning session. The projects were well-executed. They were simply executing in the wrong direction.
On the feedback loop, the same company had scored OKRs at the end of each quarter for three years without ever formally diagnosing why specific key result categories consistently underperformed. A manufacturing efficiency OKR had underperformed for five consecutive quarters. The score was recorded each time. The pattern was never named, the structural cause was never identified, and the next quarter’s OKR was authored as a variation of the failing one. Introducing structured reflection questions at quarter close, “what assumption was wrong?” and “what would we change from day one next quarter?”, surfaced a dependency on a supplier process that had been constraining the KR for eighteen months. The assumption, once named, was addressable. For the portfolio optimization gap most companies miss, connecting project funding decisions to quarterly OKR progress rescoring was the structural change that prevented the same portfolio misalignment from repeating in year two.
11. How Profit.co Closes All Five Gaps in One Platform
The architecture that closes all five gaps in one platform is built around a single principle: OKRs, project portfolios, performance data, and governance must share the same data layer. When they do, the five translation failures that create the strategy-to-execution gap are addressed not by discipline and process but by structural connection. Profit.co’s OKR management is designed to be that connected layer.
Closing the Translation Gap
Profit.co’s cascading OKR architecture connects company objectives to department-level OKRs to individual key results in a single hierarchy. The Alignment Panel, redesigned to present upward alignment and contributing OKRs as distinct visual cards with directional diagrams, makes the translation chain navigable: every user can see what their KR is contributing to and what is contributing to it, without cross-referencing a separate system. Bottom-Up Alignment allows teams to align their objectives and key results upward to a Key Result created by another department, lifting the structural barrier that previously blocked cross-departmental alignment on shared strategic outcomes. Strategy roadmaps connect the annual planning horizon to quarterly OKR commitments so strategy stays visible throughout the quarter, not just at the moment it is set.
Closing the Alignment Gap
Profit.co connects OKRs directly to the project portfolio, so every active project is mapped to at least one key result. The Stacked Rollup Progress Bar on parent OKR rows shows the health distribution of all contributing key results as a segmented bar, color-coded by status, one glance reveals the health mix beneath an Objective without expanding every row. Period-Aware Progress Calculation means the quarter filter drives the calculation engine rather than just the display, so OKR progress figures reflect only in-period activity: no carryover noise, no misleading cumulative numbers.
Closing the Visibility Gap
The My Team’s Check-in Discipline Widget, available on the Profit.co homepage, gives every manager a view of every direct and indirect report’s check-in status, on-time, late, missed, and score, sorted worst-first. No navigation required: the visibility failure surfaces in the course of normal work. The Plan Value and Deviation Indicator in the check-in panel shows the expected value for the check-in date alongside the actual, with a color-coded deviation (green at or ahead of plan, red behind), so the check-in record is simultaneously a progress update and an early-warning signal. Configurable threshold alerts fire automatically when a project, portfolio, task, or milestone attribute crosses a defined threshold, budget utilization, health status, EVM metrics, delivering a notification through Action Center, email, or webhook the moment the condition is met, not at the next review. The Dependency Graph view on OKR and key result detail pages shows all upstream, downstream, and linked relationships in a single canvas, making the knock-on risk of a lagging KR visible before the quarterly review.
Closing the Portfolio Gap
Mandatory tollgate selection on project creation ensures no project enters the portfolio without a defined stage-gate structure. Tollgate-based project progress calculation ties the progress figure to governance approvals across three configurable modes: by milestone completion, by milestone completion finalized on tollgate approval, or by tollgate approval alone, so project progress reflects governance reality rather than just task completion. The Portfolio Capacity Heatmap makes over-allocated and under-utilized resources visible by color coding without reading a numeric grid, with over-allocated cells directly actionable in place. The strategic portfolio management layer connects the portfolio to strategy in a live view: which portfolios are on track, which carry risk, and which need leadership attention, visible without opening each portfolio individually.
Closing the Feedback Loop Gap
Five KR progression models, Linear, Front-loaded, Back-loaded, S-curve, and Stepped, allow teams to set a plan shape that matches how their work actually progresses. When actuals trail the plan in a pattern, the deviation itself becomes a diagnostic signal for the next quarter’s goal architecture. The CRADI Governance Module inside each project provides structured, configurable tracking across all eight governance categories, Actions, Assumptions, Decisions, Issues, Risks, Strategic Alignment, Project Changes, and Tollgates, with auto-generated IDs and an immutable activity log that survives the quarter. Risks that materialize can be escalated directly to Issues in one action, with the escalation recorded on both items. This governance record is the raw material of the quarterly retrospective: not memory, but documented fact. Profit.co’s AI Agents, including OKR authoring agents and automated progress collection, reduce the time spent on administrative cycle tasks, keeping the team’s attention on decisions rather than on data assembly.
Customer Results
United Technical Support Services saved over $300,000 in one year after implementing Profit.co as their execution platform. Toyota Connected India saw employee goal participation rise from 60% to 80% and review cycles become 40% faster. Intuitive Surgical reduced the time their team spent on reviews by 75% and executive PPT preparation time by 84%. REHAU’s leadership team achieved nearly 90% of their high-level objectives, naming them “direct lead indicators to the success of the business.”
Close all five gaps in one platform
Frequently Asked Questions
The strategy-to-execution gap is the measurable distance between what a leadership team plans and what the organization delivers. It forms not as one failure but as five distinct structural failures that open at different points in the chain connecting annual strategy to daily execution: translation, alignment, visibility, portfolio, and feedback loop.
The most common cause is treating strategy, project portfolios, and OKRs as three separate systems that are periodically aligned rather than one connected architecture. When the three systems are disconnected, every hand-off between annual direction, quarterly goals, and daily execution requires manual reconciliation, and manual reconciliation is the mechanism that introduces gaps.
The translation gap opens between annual strategy and quarterly OKRs: strategy was never converted into a 90-day measurable commitment at team level. The alignment gap opens between quarterly OKRs and sprint goals: OKRs exist but sprint planning is not anchored to them. The translation gap produces OKRs that don’t reflect strategy. The alignment gap produces work that doesn’t reflect OKRs. Both can co-exist, and frequently do.
Because it compounds over the longest time without surfacing. A mid-year portfolio review that reveals the majority of active projects serving last year’s strategic priorities represents six months of execution resources spent on the wrong outcomes. Unlike the visibility gap (which surfaces in weeks when early-warning systems exist) or the alignment gap (which appears in check-in patterns), the portfolio gap can stay invisible for an entire planning cycle.
The feedback loop gap opens between execution results and the next planning cycle. OKR scores are produced at the end of each quarter but not diagnosed: the team asks “what did we score?” without asking “what does the score reveal about our planning assumptions?” Without structured diagnosis, the next quarter’s OKRs are authored on the same structural assumptions as the last ones. The pattern repeats.
Profit.co closes all five gaps through a single connected platform: OKR cascading and the redesigned Alignment Panel for the translation gap; OKR-to-project linkage and the Stacked Rollup Progress Bar for the alignment gap; My Team’s Check-in Discipline Widget, Plan Deviation Indicator, and threshold alerts for the visibility gap; mandatory tollgate selection, tollgate-based progress calculation, and the portfolio capacity heatmap for the portfolio gap; and five KR progression models plus the CRADI governance module (eight categories: Actions, Assumptions, Decisions, Issues, Risks, Strategic Alignment, Project Changes, and Tollgates) for the feedback loop gap.
The most practical measurement is gap-by-gap: (1) the percentage of current OKRs traceable to a named company-level strategic priority; (2) the percentage of active projects with a named KR they are advancing; (3) the check-in completion rate and the time-to-escalation for off-track KRs; (4) the percentage of active projects aligned to current-year rather than prior-year strategic priorities; (5) the degree to which next-quarter OKR architecture changed based on the previous quarter’s diagnostic. An organization scoring below 70% on any of these is operating with that gap open.
No, and the distinction matters. Poor execution means the organization knows what to do and fails to do it. The strategy-to-execution gap means the organization is executing well, but executing the wrong things, or executing the right things without a system to measure whether execution is advancing strategy. The most common organizational response, demanding more execution focus, is ineffective because it applies the same intervention to a structural failure. Closing the gap requires changing the architecture, not changing the effort level.