

The PPM Cockpit lets project and portfolio managers choose which performance widgets appear on a dashboard, instead of viewing one fixed set of charts. Each subfolder can carry its own combination of budget, schedule, risk, and resource widgets suited to that audience.
Table of Contents
- What is PPM Cockpit Widget Customization?
- Why PPM Cockpit Widget Customization Matters
- How It Works
- PPM Cockpit Widget Customization Scenarios and Their Outcomes
- Cockpit Widget Categories and What Each One Shows
- Summary Cards in the PPM Cockpit
- Best Practices for PPM Cockpit Widget Customization
- Related Articles
- Frequently Asked Questions
What is PPM Cockpit Widget Customization?
PPM Cockpit widget customization is the configuration layer that determines which charts, tables, and metrics display inside a Cockpit subfolder. Widgets are grouped into eight categories: Project Insights, Execute Insights, Portfolio Health, Portfolio Insights, Resource Management, Task Insights, Lesson Tracking, and Custom Insights, and a subfolder can mix widgets from any of these categories.
Why PPM Cockpit Widget Customization Matters
Without customization, every subfolder shows the same generic widget set regardless of whether the viewer needs execution detail, budget tracking, or resource load. Matching widgets to the audience means a portfolio owner sees Strategic Alignment and CPI data, while a team lead sees Task Compliance and Delayed Tasks without sorting through irrelevant charts.
How It Works
How do I customize the PPM Cockpit in Profit.co?
Follow these steps to customize widgets in your Portfolios and Projects Cockpit.
Step 1
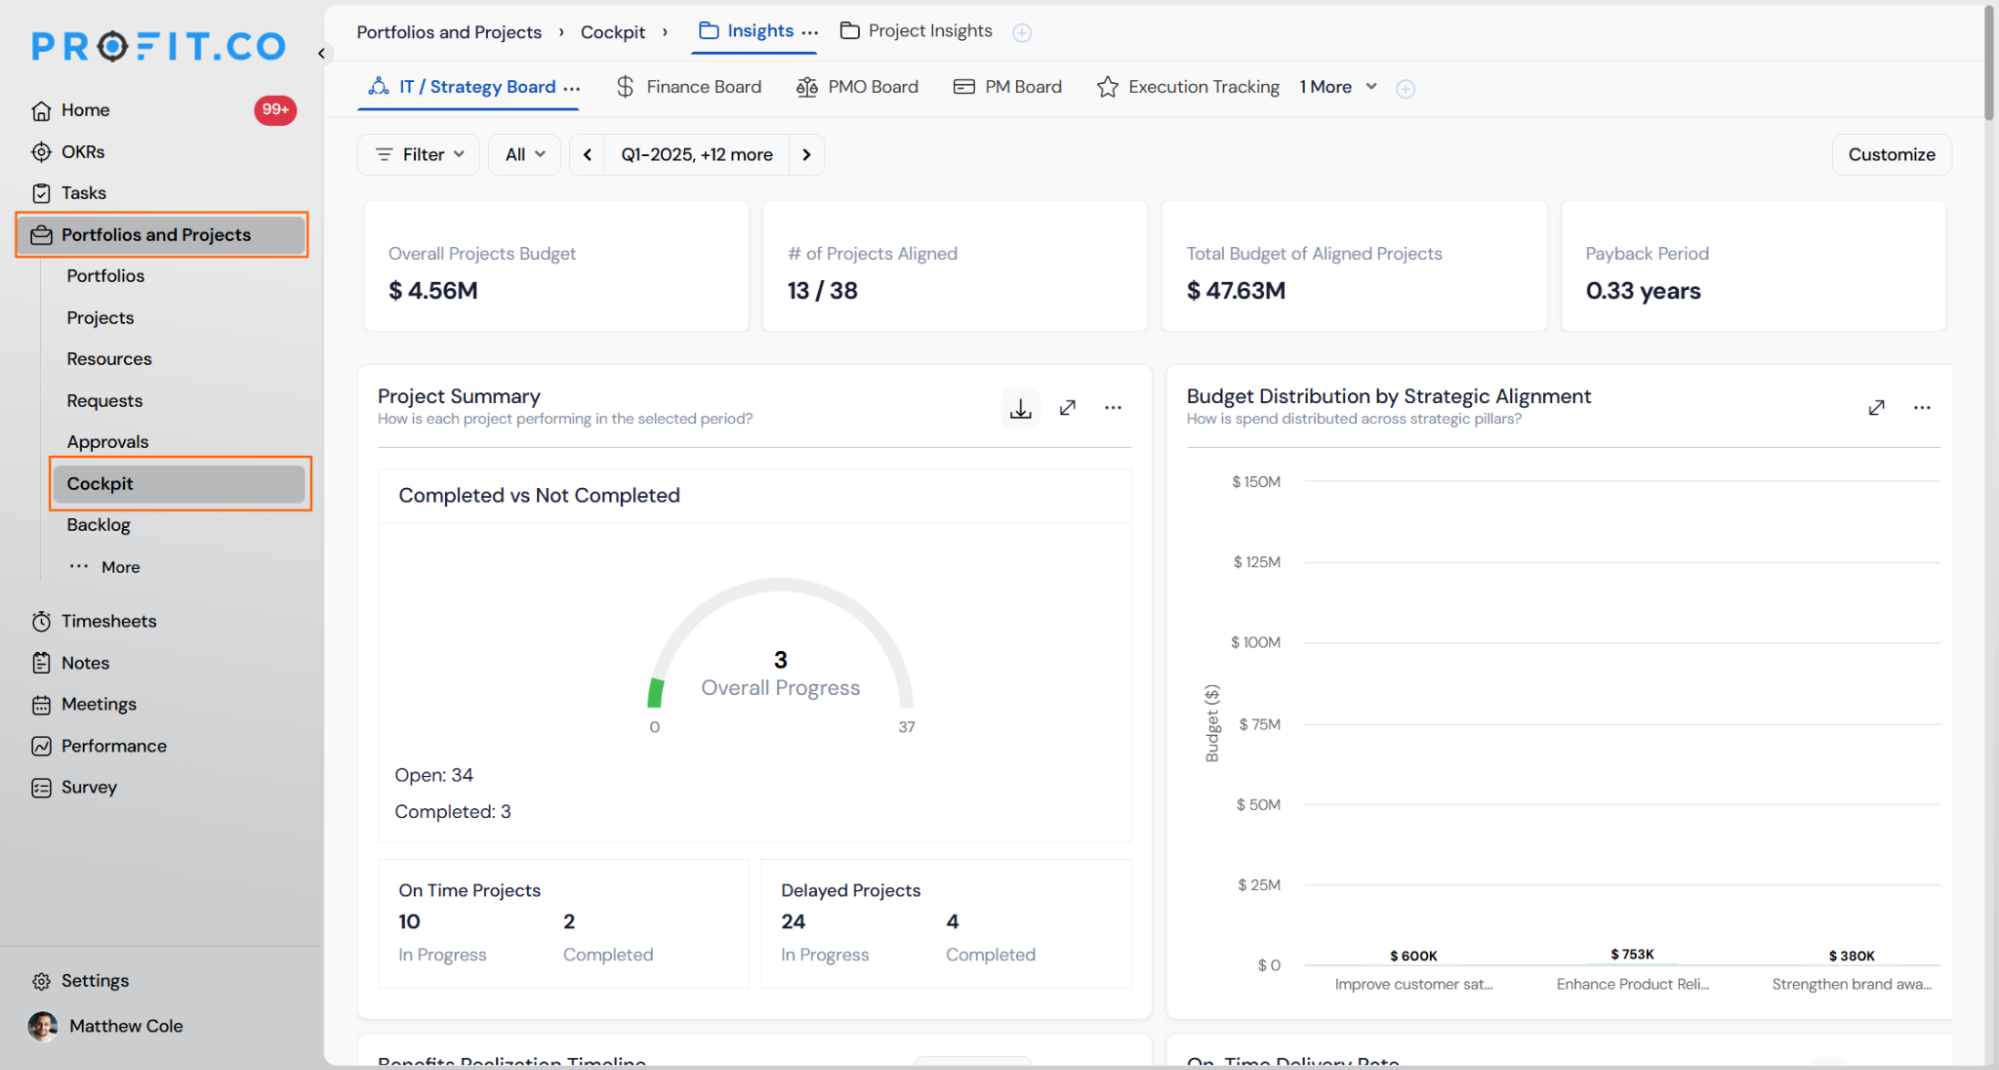
- Go to Portfolios and Projects → Cockpit.
Step 2
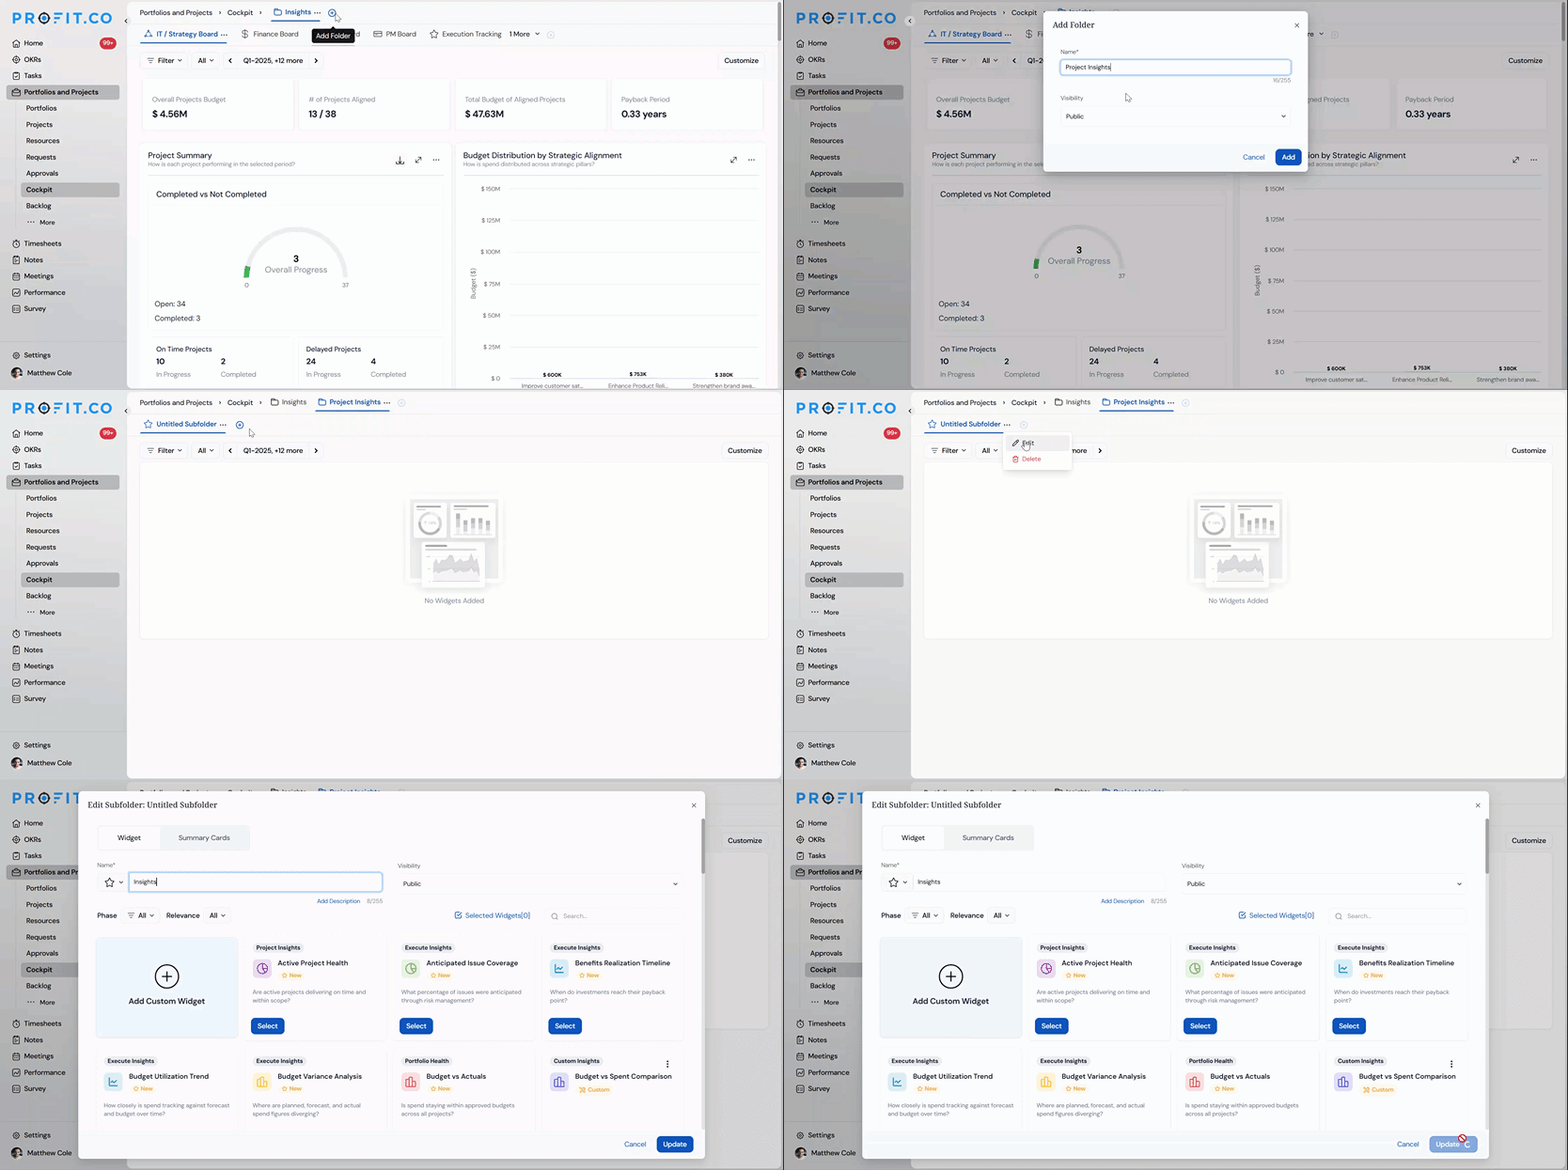
You can create folders and subfolders in the PPM Cockpit to organize and manage dashboards effectively.
To create a new folder:
- Click the '+' icon beside the folder list. A new folder will be created in the Cockpit.
- Once a new folder is created, an untitled Subfolder will automatically appear beneath it.
- Click the More (⋮) option next to the subfolder name to Edit or Delete it as needed.
Step 3
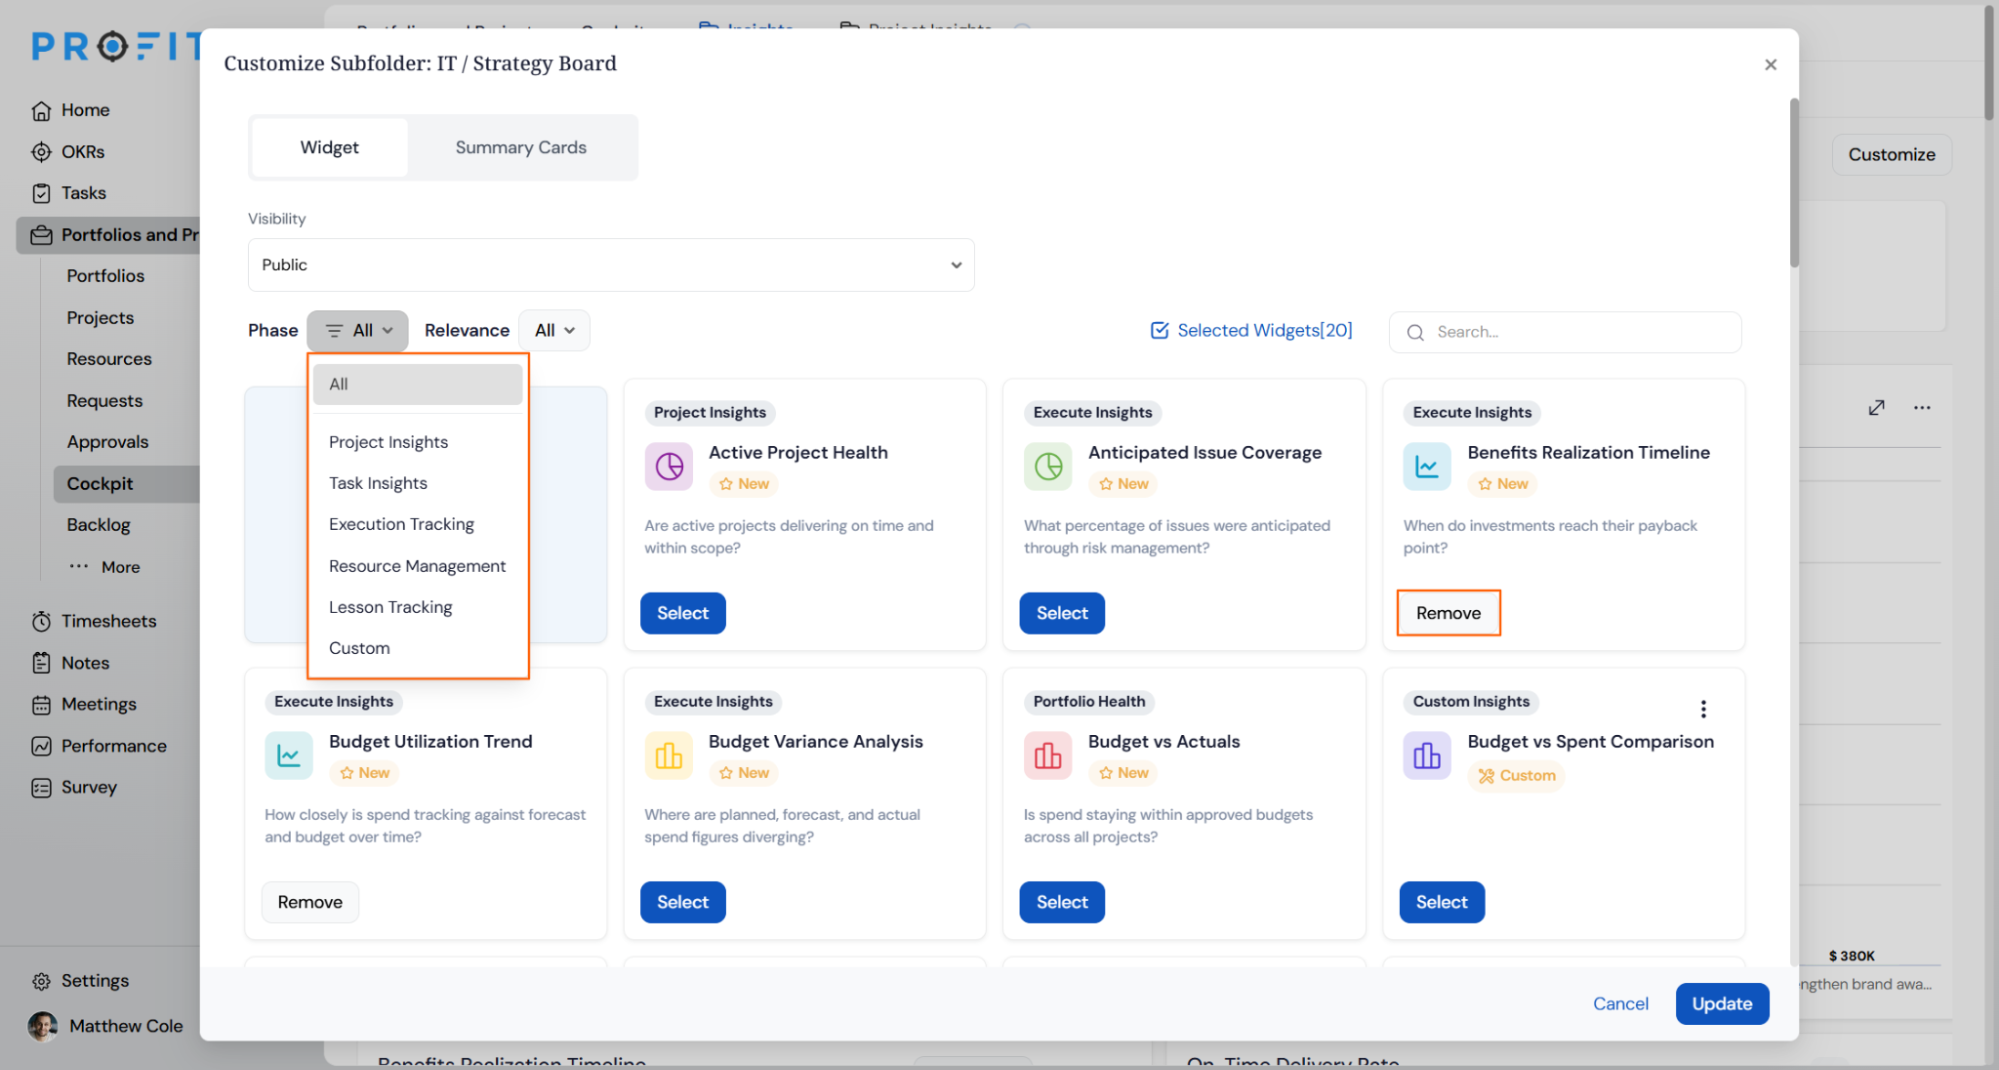
In the Customize Subfolder window, review all available widgets categorized under:
- Project Insights
- Task Insights
- Execution Tracking
- Resource Management
- Lesson Tracking
- Custom Insights
Click Add Custom Widget to create a personalized chart or metric.
Use the Remove button to hide any widgets that are not relevant.
Step 4
- Use filters such as Phase and Relevance to narrow results.
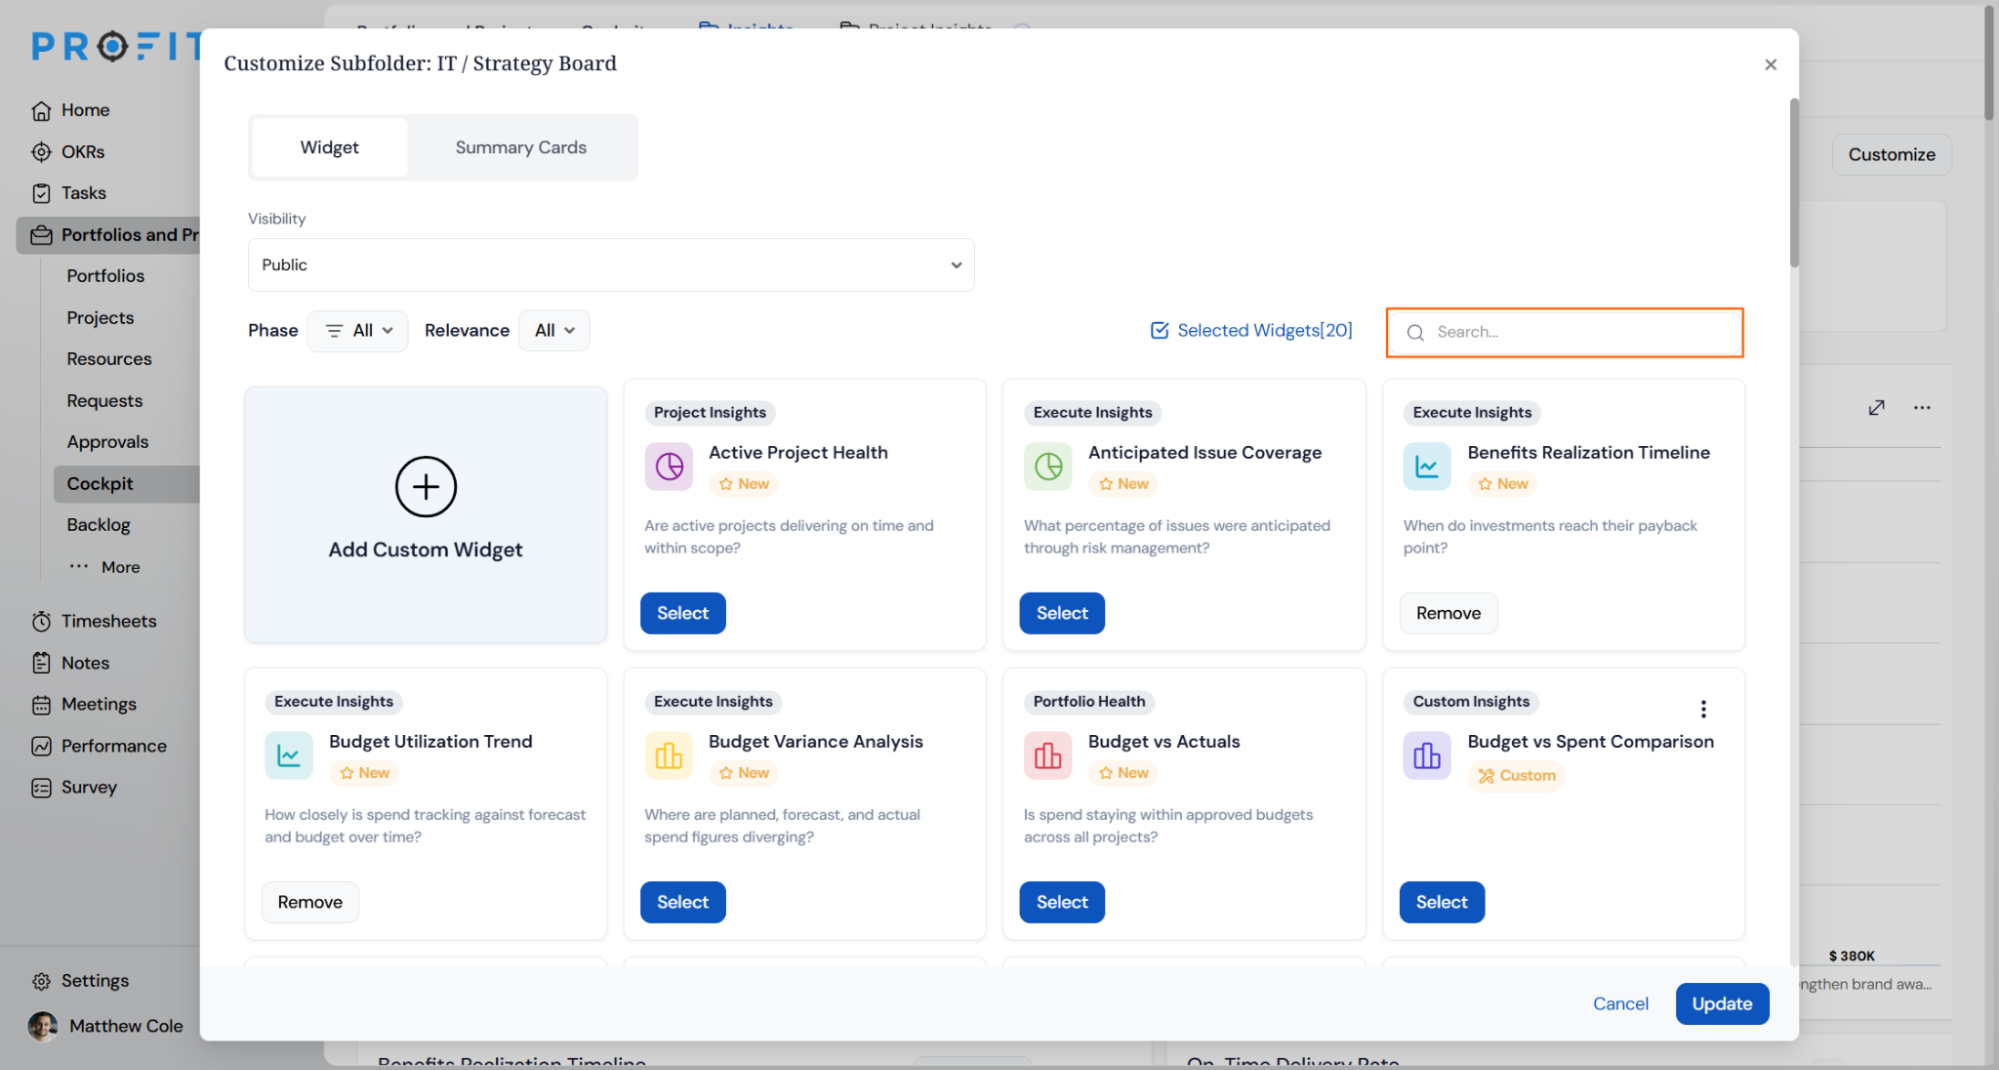
- Use the Search Bar to locate a specific widget quickly.
- Once you've finalized your selection, click Update to apply the changes.
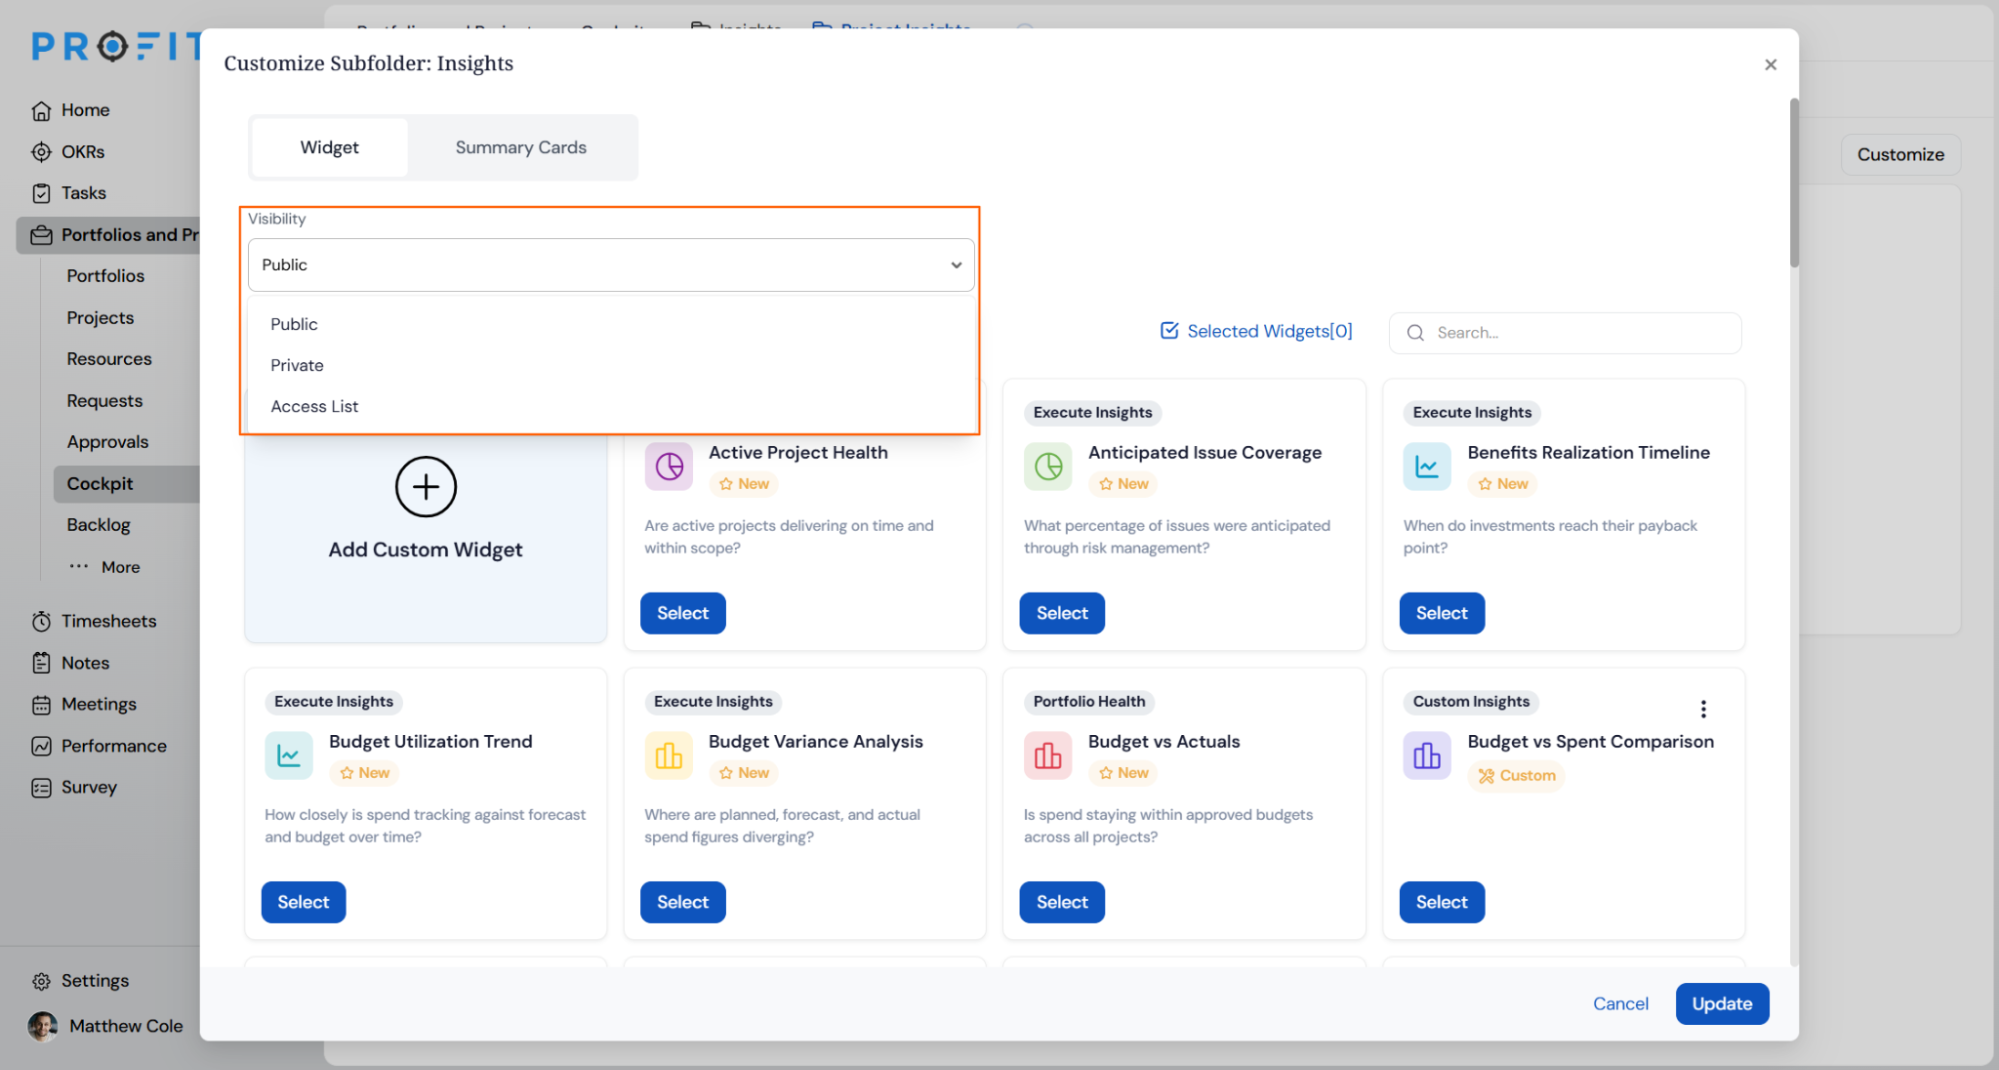
How do I manage widget visibility?
Profit.co allows you to define who can view or manage widgets through the following visibility settings:
| Visibility Setting | Description |
|---|---|
| Public | Accessible to all users within the organization or team. |
| Private | Restricted to the owner or creator only. |
| Access List | Shared with specific users or groups assigned by the owner. |
What do the widget labels mean?
Widgets in the PPM Cockpit are labeled to help users identify their purpose and relevance:
| Label | Description |
|---|---|
| Best Practices | Represents essential metrics based on proven success methods. |
| Recommended | Tailored suggestions based on user behavior, team goals, or frequent use. |
| New | Highlights the latest widgets added to the platform for exploration. |
Note
You can filter widgets by label to quickly find the most relevant and effective tools for your dashboard.
How do I personalize and adjust my layout?
- Choose your Folder and Subfolder and click Customize.
- The selected widgets will appear on your dashboard.
- You can drag and resize widgets dynamically to optimize layout, visibility, and readability.
PPM Cockpit Widget Customization Scenarios and Their Outcomes
| Scenario | What Happens |
|---|---|
| You remove a widget from the Customize Subfolder view. | The widget disappears from that subfolder's dashboard, and the underlying report data and historical values remain unaffected. |
| You click Cancel instead of Update after selecting or removing widgets. | Profit.co discards every unsaved change from that session, and the dashboard keeps its last saved widget configuration. |
| You set a subfolder's visibility to Public. | Every user with access to that portfolio or project sees the same widget selection, and layout changes apply for all of them. |
| You set a subfolder's visibility to Private. | Only you, as the subfolder's creator, can view or edit its widget configuration, and other users cannot see it in their Cockpit. |
Cockpit Widget Categories and What Each One Shows
The widget library spans eight categories. The tables below list every widget confirmed in the library, grouped by category, so you can find the right one without opening each card individually.
Project Insights
Widgets that summarize how individual projects are performing.
| Widget | What It Shows |
|---|---|
| Active Project Health | Shows whether active projects are delivering on time and within scope. |
| Portfolio Summary | Shows how the portfolio performed in the selected period. |
| Project Engagement by User | Shows which projects each user owns and contributes to. |
| Project KPI Summary | Shows how KPIs are tracking and being adopted across projects. |
| Project Progress | Shows how all projects are progressing. |
| Project Summary | Shows how each project is performing in the selected period. |
| Projects by Stage | Shows how projects are performing by stage. |
Execute Insights
Widgets that track execution, budget, and schedule performance across projects.
| Widget | What It Shows |
|---|---|
| Anticipated Issue Coverage | Shows what percentage of issues were anticipated through risk management. |
| Benefits Realization Timeline | Shows when investments reach their payback point. |
| Budget Utilization Trend | Shows how closely spend tracks against forecast and budget over time. |
| Budget Variance Analysis | Shows where planned, forecast, and actual spend figures diverge. |
| CapEx vs OpEx Trend | Shows how capital versus operating spend trajectories are trending. |
| Delayed Tasks Breakdown | Shows how many tasks are delayed against their due dates. |
| Execution vs Value Matrix | Shows whether project delivery is translating into measurable business outcomes. |
| Investment Flow by Cost Category | Shows how budget flows from enterprise investment down to CapEx and OpEx. |
| IRR Distribution by Performance | Shows how projects are distributed by internal rate of return. |
| Issue Distribution by Category | Shows what types of issues are impacting projects. |
| On-Time Delivery Rate | Shows what proportion of projects is meeting their deadlines. |
| Portfolio Delivery Tracker | Shows how portfolios and projects are progressing against schedule. |
| Project Health Trend | Shows the current project health and how it has changed over time. |
| Project Start Variance | Shows whether projects are starting on schedule. |
| Project Volume by Portfolio | Shows which portfolios contain the most projects. |
| Projects by Risk | Shows how many risks each project carries, by risk status. |
| Schedule Completion Variance | Shows whether projects are finishing on schedule. |
| Spend by Strategic Alignment | Shows how spend is distributed across strategic pillars. |
| Strategic Alignment of Budget | Shows how much investment is strategically aligned versus unaligned. |
| Strategic Alignment of Projects | Shows which projects lack a strategic connection. |
| Strategically Aligned Objectives | Shows which objectives and key results are strategically aligned. |
| Task Compliance Overview | Shows how many tasks are completing within their planned duration. |
| Tollgate Overview | Shows how many projects sit at each tollgate. |
Portfolio Health
Widgets that roll cost, schedule, capacity, and risk data up to the portfolio level.
| Widget | What It Shows |
|---|---|
| Budget vs Actuals | Shows whether spend is staying within approved budgets across all projects. |
| Capacity Utilization Overview | Shows what percentage of available capacity is currently allocated. |
| Capacity vs Demand Forecast | Shows whether there is enough capacity to deliver approved and pipeline demand next month. |
| Cost Performance Index (CPI) | Shows how efficiently each project is using its budget relative to work completed. |
| CPI vs SPI Performance Matrix | Shows where each project stands across cost and schedule performance. |
| Department Health Distribution | Shows how health status is distributed across each department. |
| Earned Value Performance | Shows whether projects are delivering value relative to cost and schedule. |
| Enterprise Risk Radar | Shows which risks across projects demand immediate C-suite attention. |
| Issue Status | Shows the current status breakdown of project issues. |
| Milestone Progress | Shows how effectively project milestones are progressing. |
| Over-Allocated Resources | Shows which resources are over-allocated and need rebalancing. |
| Resource Utilization by Role | Shows how resource utilization compares across job titles. |
| Risk Status | Shows the current status distribution of project risks. |
| Schedule Performance Index (SPI) | Shows how efficiently each project is progressing against its planned schedule. |
| To-Complete Performance Index (TCPI) | Shows what cost efficiency is required to finish remaining work within budget. |
| Project Stage by Portfolio | Shows how many projects sit at each stage, broken down by portfolio. |
| Project Health by Portfolio | Shows how projects are distributed across health statuses, broken down by portfolio. |
Widgets that show how work is spread across portfolios.
| Widget | What It Shows |
|---|---|
| Project Distribution by Portfolio | Shows how projects are distributed across portfolios. |
Resource Management
Widgets that track how people's time is allocated.
| Widget | What It Shows |
|---|---|
| Resource Utilization by User | Shows how each user's time is utilized and allocated across tasks. |
Task Insights
Widgets that summarize task-level activity. The Tasks by Assignee widget also includes an Export option for downloading its data directly.
| Widget | What It Shows |
|---|---|
| Task Summary | Shows how task activity is tracking in the selected period. |
| Tasks by Assignee | Shows how many tasks each assignee has. |
Lesson Tracking
Widgets that track published foresights and lessons learned.
| Widget | What It Shows |
|---|---|
| Foresights by Category | Shows how many published foresights fall into each category. |
| Foresights by Type | Shows how foresights are distributed across the three types. |
| Foresights per Project | Shows which active projects have the most foresights. |
Custom Insights
Widgets built by users through Add Custom Widget rather than pulled from the standard library.
| Widget | What It Shows |
|---|---|
| Budget vs Spent Comparison | User-built widget comparing budget against spend. |
| Task Workload Stacked Column | User-built widget breaking down task workload by column. |
| Other user-created widgets | Appear with the Custom label and whatever name and description the creator assigns. |
Summary Cards in the PPM Cockpit
Summary Cards sit above the widget grid and surface headline portfolio metrics without any chart configuration. They update automatically based on the same portfolio or project scope as the subfolder's widgets.
| Summary Card | Description |
|---|---|
| # of Projects Aligned | Number of projects linked to strategic objectives. |
| Actual | Total actual spend across the projects. |
| Forecast | Projected total cost to complete all projects based on current performance and trends. |
| IRR | Expected annualized rate of return on investment across the projects. |
| NPV | Total net present value of expected cash flows across all projects, discounted at the organization's cost of capital. |
| Payback Period | Expected time to recover the initial investment from the projects. |
| Plan | Total planned budget across the projects. |
| Return Ratio | Portfolio return on investment, calculated as NPV divided by total budget. |
| Total Budget of Aligned Projects | Total budget allocated to strategically aligned projects. |
Note
The Portfolio Delivery Tracker now provides a complete hierarchy view, allowing users to expand portfolios and view the associated projects, milestones, and tasks in a structured layout.
Best Practices for PPM Cockpit Widget Customization
- Match widget categories to the audience. Use Portfolio Health and Execute Insights widgets for leadership subfolders, and Task Insights or Resource Management widgets for team-level subfolders, since each category surfaces a different layer of execution data.
- Set visibility deliberately before you finish customizing. Choose Public only when every viewer should see the same KPI set, since a Public subfolder's widget selection applies to everyone with portfolio access, not just you.
- Start a new subfolder from Recommended-labeled widgets, then layer in New or Custom widgets once the baseline metrics confirm what your reporting still needs.
- Confirm a subfolder's contents before deleting it. Deletion removes its saved widget configuration immediately with no recovery option, so note or screenshot the configuration first if you might rebuild it later.
- Keep Custom Widgets scoped to metrics the standard library doesn't cover. Duplicating an existing widget under a new name adds clutter to the library without adding insight.
Related Articles
- How do I enable the Portfolios and Projects module in Profit.co?
- What is Resource Management in the PPM module?
- How do I View Portfolio Health Metrics and Heatmaps in Profit.co?
Frequently Asked Questions
There's no strict limit, but keeping a subfolder's widget count concise is recommended so the dashboard stays fast and readable.
Yes. Use the Copy function in Cockpit settings to reuse or clone an existing subfolder's widget configuration.
Yes. Each widget card displays a label, New, Recommended, or Custom, and the Relevance filter in the Customize Subfolder window helps narrow the list further.
Access List shares the subfolder's widget configuration with specific named users or groups, instead of everyone with portfolio access (Public) or only the creator (Private).
Execute your strategy with confidence
Connect OKRs, tasks, and teams in one place with Profit.co
