
A bowler chart shows whether each row is on plan. It can’t show whether the plan is working, because that depends on two rows at once. The four-quadrant chart puts them on the same picture.
In this guide
Key Takeaways
- →A bowler answers whether a row is on plan. This chart answers whether the plan is working.
- →The two quadrants that matter are outcome lag and unexpected wins, which a row-by-row review misses.
- →Use the same period on both axes, and weight initiatives by real effort, not by count.
- →Milestone-only initiative progress pushes every dot to the right. Use adoption measures where you have them.
- →A dot moving right but not up is the earliest warning the hoshin toolkit offers.
- →The objectives needing a conversation are rarely the ones with the lowest numbers.
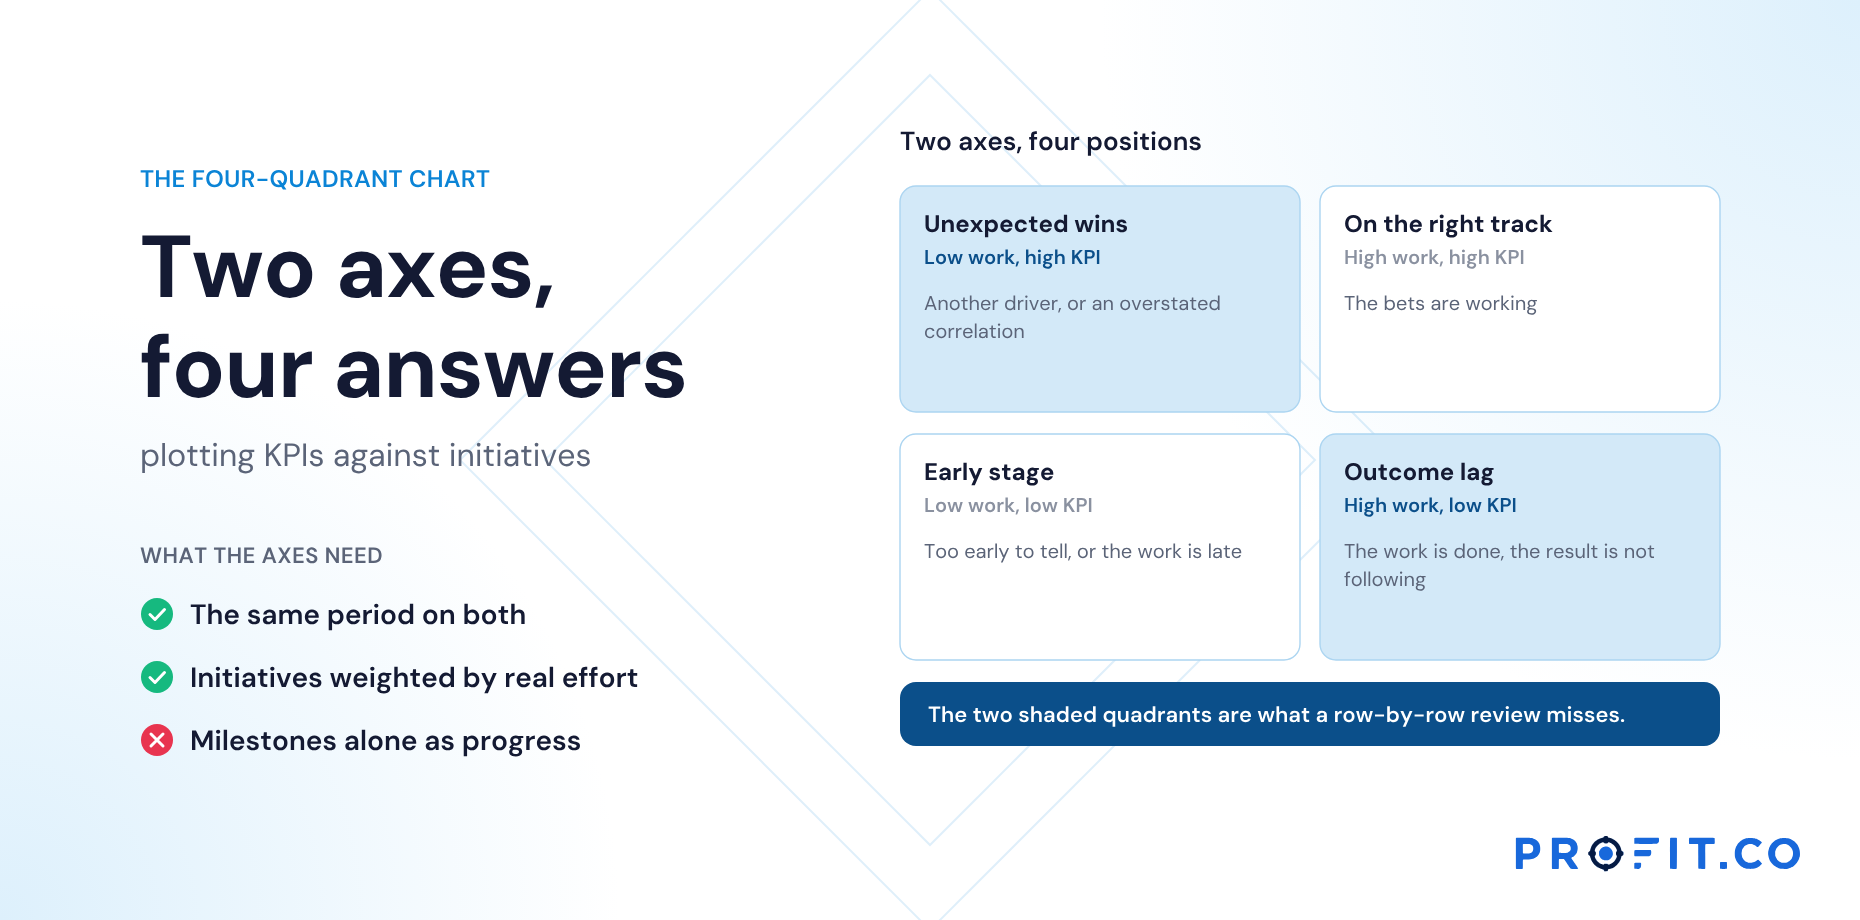
Two axes, four positions
| Quadrant | Initiative progress | KPI progress | What it suggests |
|---|---|---|---|
| On the right track | High | High | The bets are working |
| Early stage | Low | Low | Too early to tell, or the work is late |
| Unexpected wins | Low | High | Something else is moving the KPI, or the correlation is overstated |
| Outcome lag | High | Low | The work is done but the result isn’t following |
The chart is most useful in the bottom-right and top-left quadrants, which are exactly the cases a row-by-row review misses. The diagnosis for outcome lag is covered in Outcome lag: when priorities are green and KPIs don’t move.
The unexpected-wins quadrant is a question about the matrix itself, not about the work: it suggests a correlation was graded higher than the evidence supports. See Primary, secondary, partial: grading X-matrix correlations.
Calculating the axes
Initiative progress is the weighted progress of the work under the objective: its priorities or contributing key results, using their weights. KPI progress is progress from baseline towards target for the KPIs mapped to the objective.
- Use the same period for both. Year-to-date initiative progress against year-to-date KPI progress.
- Weight initiatives honestly. If one priority carries most of the effort, it should carry most of the weight.
- Use adoption measures where you have them. Initiative progress based on milestones alone will push everything to the right.
The midlines show halfway on each axis. Early in the year, many objectives will sit in early stage for good reason; read positions against how far through the year you are, and look at movement between months.
Reading movement over time
A single snapshot is useful. A sequence is more useful. An objective moving steadily up and to the right is healthy. One moving right but not up is drifting into outcome lag, often several months before the bowler’s KPI row turns red. One moving up without moving right deserves a question: what is driving the KPI, and is the matrix giving credit to the wrong work?
A dot moving right but not up is the earliest warning the hoshin toolkit offers.
Acting on that warning early is what separates a mid-year adjustment from a rescue. Replanning Hoshin Kanri Mid-Year Without Restarting the Cycle covers how far to go in response.
A worked example: five objectives in June
| Objective | Initiative progress | KPI progress | Quadrant | Review action |
|---|---|---|---|---|
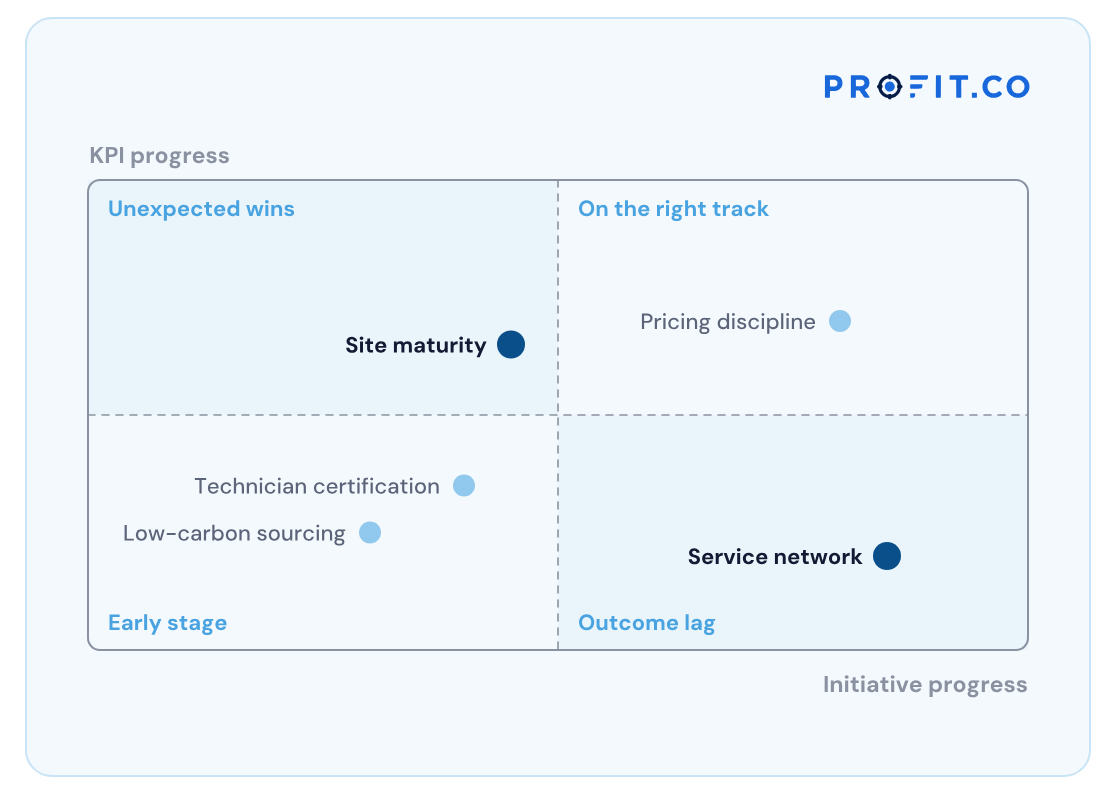
| Pricing discipline | 80% | 70% | On the right track | None |
| Service network | 85% | 20% | Outcome lag | Run the LAGS diagnosis |
| Low-carbon sourcing | 30% | 25% | Early stage | Check sourcing timeline is on plan |
| Site maturity | 45% | 65% | Unexpected wins | Ask what else improved on-time delivery |
| Technician certification | 40% | 35% | Early stage | None; on its ramp |
Illustrative, at mid-year.
Two of five objectives need a conversation, and neither is the one with the lowest numbers. The bowler alone would have sent the review to sourcing and certification first.
Which is why the review agenda is built from exceptions rather than from a walk through every row; see Hoshin Kanri Review Templates: Monthly and Quarterly Formats.
What the chart costs to produce
Drawn by hand, this chart is a monthly data-gathering exercise. Both axes need the same period, every objective needs its initiative weights applied, and the KPI side needs baseline-to-target progress rather than raw values. In a spreadsheet that is an hour or two a month, and the result is a snapshot: the movement between months, which is the part that actually warns you, lives only in whoever kept the old copies.
Generated from live records, it costs nothing per month and the sequence is free. That difference is the whole argument, because the chart’s value is in the trail rather than the dot.
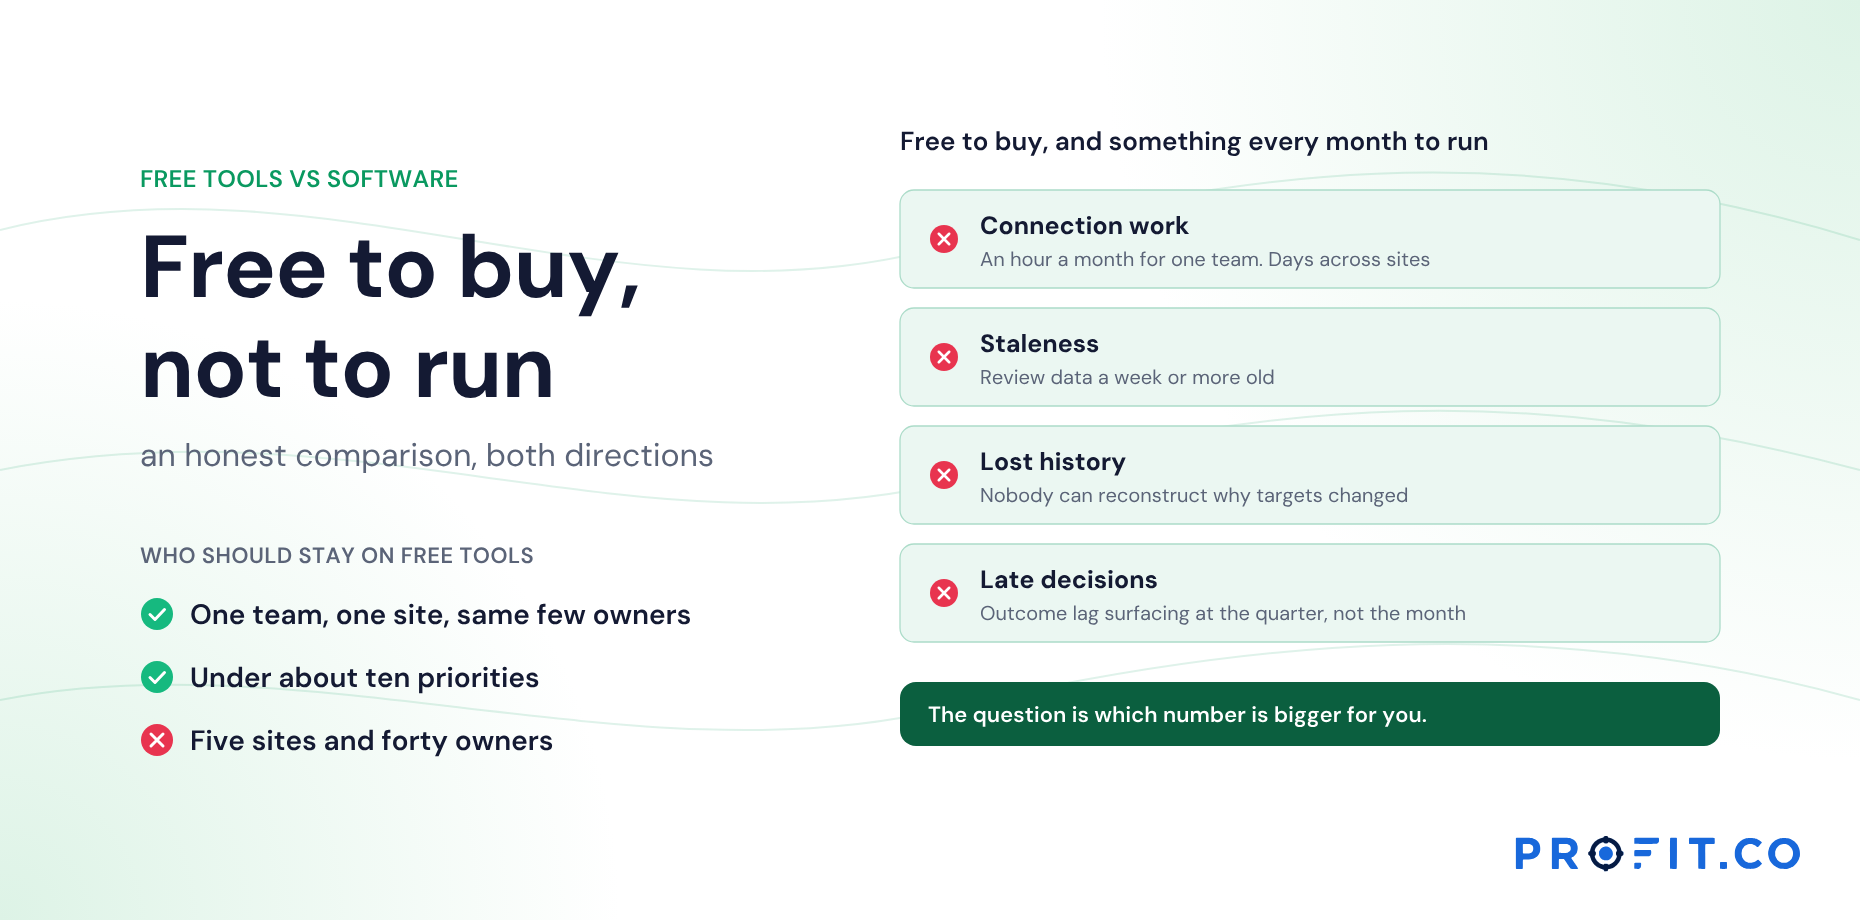
Among published alternatives, OnStrategy lists $200 per month for unlimited users. i-nexus publishes a free Starter tier for up to five users and $28 per user per month at its Standard tier. Profit.co publishes two plans, Essentials and Enterprise, quoting against modules and scale rather than a public seat rate, with Hoshin Kanri in Essentials alongside OKRs and Goals, Balanced Scorecard and Strategy Roadmap.
The 30-day free trial covers one monthly cycle, enough to see a first position but not yet the movement. What drives the cost of hoshin kanri software lists the rest to total, and How to Choose Hoshin Kanri Software: Seven Pass/Fail Tests gives the questions to ask about history specifically.
The four-quadrant chart in Profit.co
Profit.co includes a four-quadrant chart on each objective, plotting KPI progress against initiatives progress with the four quadrants named as above, alongside the objective’s check-in history and matrix correlations.
It works with the exception queue, which flags correlations whose hypothesis didn’t hold so the outcome-lag cases arrive as named items. From either, a countermeasure A3 can be opened on the gap. More on the Hoshin Kanri software page, and on what the matrix becomes once it is live in What Changes When the X-Matrix Is Live.
Free Product Demo
Plot your objectives on four quadrants
A 30-minute walkthrough, tailored to your team.
Book a free demo
What happens in the call
How your teams set goals, track progress and review results.
Strategy, performance, projects and engagement on one platform, with AI.
A practical path to align teams, execute faster and drive results.
Questions this article answers
A chart plotting each objective’s KPI progress against its initiative progress, placing it in one of four quadrants: on the right track, early stage, unexpected wins or outcome lag.
The initiatives are well advanced but the KPIs they were meant to move are not, which suggests an adoption gap, a long lag, a mechanism that doesn’t hold or an external force.
A KPI moving without its initiatives suggests another driver or an overstated correlation. Both affect how next year’s plan should give credit.
As the weighted progress of the priorities or contributing key results under the objective, using their real effort weights. Milestone-only progress pushes everything to the right.
No. A sequence is far more useful. An objective moving right but not up is drifting into outcome lag, often several months before its KPI row turns red on the bowler.
Because little has happened yet, which is usually fine. Read positions against how far through the year you are, and judge by movement between months rather than by the position alone.