














In this guide
- Copying is the default, and the mistake
- Step 1: inventory what you have
- Step 2: clean on the way
- A worked example: before and after cleaning
- What to ask the vendor about migration
- Step 3: map to the new model
- Step 4: decide how much history to bring
- Step 5: run in parallel once, then retire the file
- Questions this article answers
Key Takeaways
- →Copying is the default and the mistake. The tool will display every inherited weakness live, every month, to more people.
- →Five things to clean on the way in: one owner per row, every KPI defined, correlations regraded, adoption measures added, orphans decided.
- →Expect the correlation count to halve. That is the change that surprises people most and pays off first.
- →Bring this year’s monthly actuals for primary KPIs. Anything more is archaeology.
- →One parallel cycle, then archive the file read-only with a date. A spreadsheet that stays editable becomes a second source of truth within weeks.
- →Ask who does the cleaning before you buy. A vendor that imports your file untouched has sold you a faster spreadsheet.
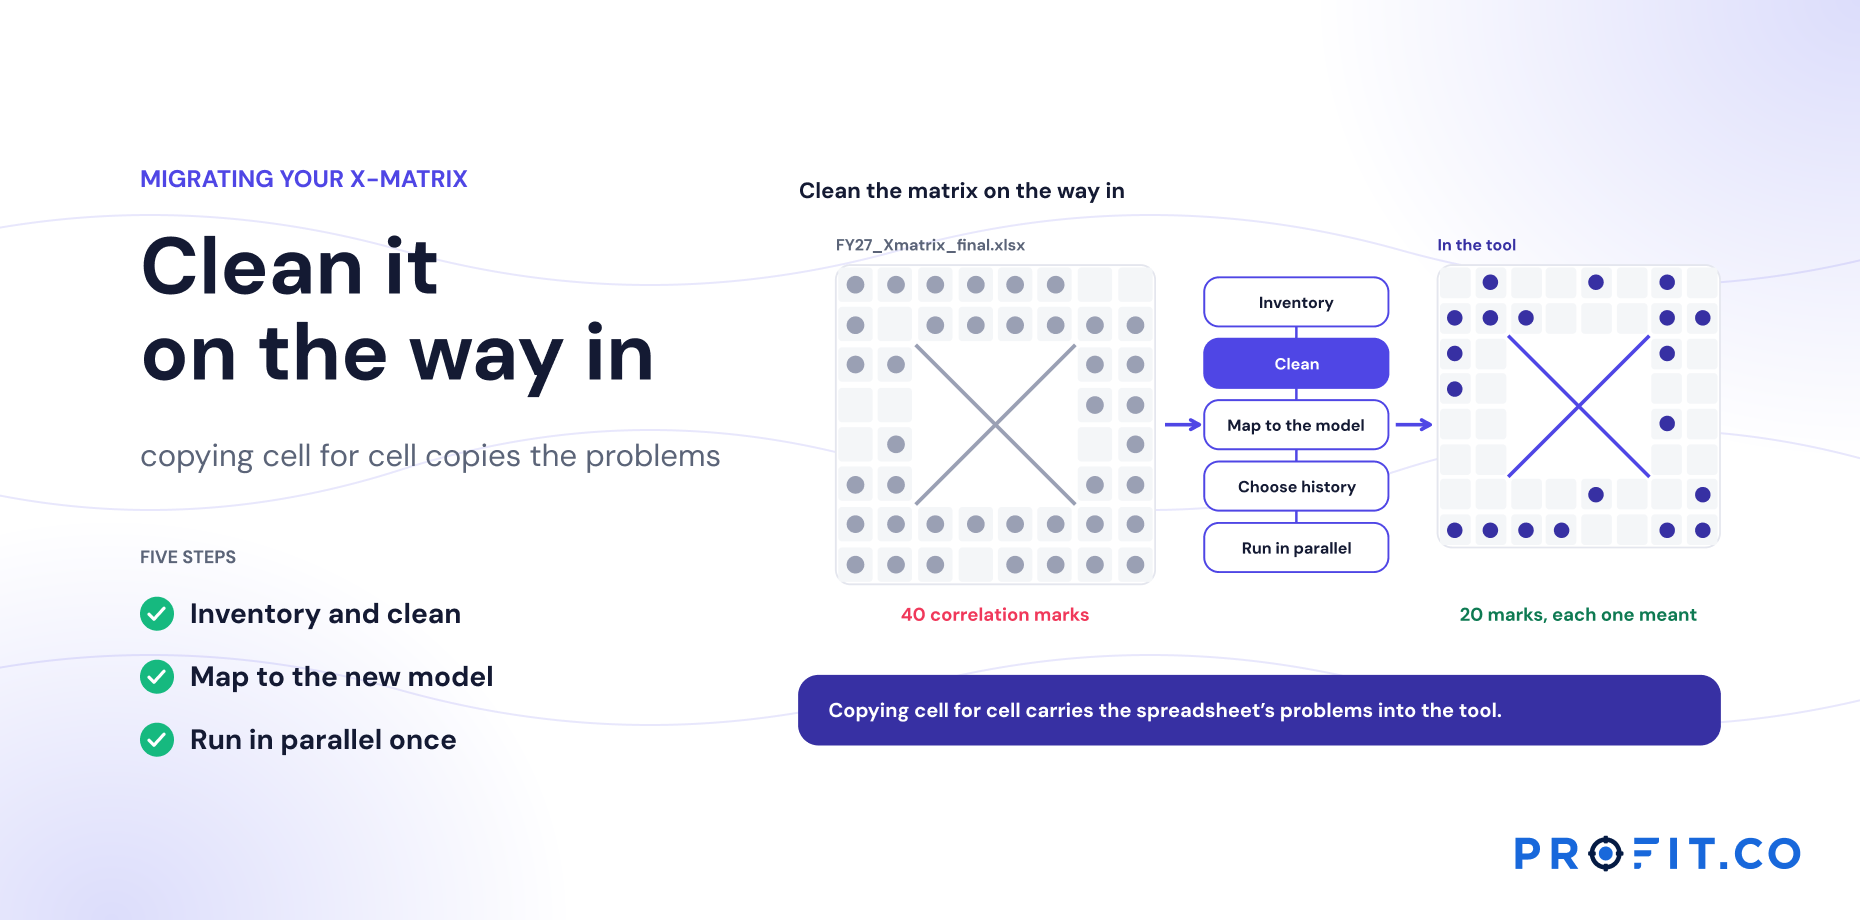
A migration that copies the spreadsheet cell for cell brings its problems along: inflated correlations, shared owners, KPIs nobody can define. Moving the matrix is the cheapest moment you’ll get to clean it.
Copying is the default, and the mistake
The natural way to migrate an X-matrix is to reproduce it: same rows, same dots, same wording. It feels safe, because nothing is lost. It also carries every weakness of the old matrix into a tool that will now display those weaknesses live, every month, to more people.
Correlations that were drawn so a priority wouldn’t look orphaned will show up as dots nobody can explain. Rows owned by “Operations” will have no one to check in. KPIs without a baseline will show progress against nothing. The software will be blamed for problems it inherited.
Step 1: inventory what you have
| Element | What to collect | Common problem |
|---|---|---|
| Objectives | Breakthrough and annual, with their period | Breakthroughs recorded in a strategy deck, not the matrix |
| Priorities | Name, owner, start and end, how progress is measured | Progress measured only as completion |
| KPIs | Definition, unit, baseline, target, owner, source system | Targets with no baseline; definitions that differ by site |
| Correlations | Every dot, with its grade | Dense grids with mostly strong grades |
| Perspectives | If you use scorecard perspectives, the mapping | Implied rather than recorded |
| History | Monthly actuals so far this year; any changed targets | Overwritten; reasons lost |
Collect from the file and from the review packs. The packs often hold history the file has lost.
Step 2: clean on the way
Fix these before loading, not after. Each takes minutes per row and saves months of noise.
- One owner per row. A named person, not a team or a function.
- Every KPI defined. Unit, baseline, target and where the number comes from.
- Correlations regraded. Apply the cancellation test to every strong dot (see grading X-matrix correlations). Expect fewer primaries.
- Adoption measures added. Any priority measured only by completion gets at least one measure of the change it should cause.
- Orphans decided. Priorities with no defensible correlation are either connected honestly or questioned.
Not every row will be fixed perfectly in one pass. Mark what’s unresolved and fix it during the first review cycles. What matters is not loading problems you already know about.
A worked example: before and after cleaning
| Element | In the spreadsheet | After cleaning | What changed |
|---|---|---|---|
| Priorities | 14 | 11 | Three merged or moved to the stop-doing list |
| Correlation marks | 52, of which 38 strong | 26, of which 12 primary | Cancellation test applied to every strong mark |
| Rows with shared owners | 6 | 0 | One named person each |
| KPIs without a baseline | 4 | 0 | Baselines measured or estimated with a date |
| KPIs measuring activity | 3 | 0 | Replaced with the change each activity should cause |
| Months of history loaded | None, values overwritten | 9 months for primary KPIs | Rebuilt from review packs |
Illustrative migration.
Halving the correlation marks is the change that surprises people most, and the one that pays off first. The first review after migration had twelve primary links to watch instead of thirty-eight “strong” ones, and the two that were failing were obvious. Copied cell for cell, the same matrix would have shown a dense grid with nothing standing out.
What to ask the vendor about migration
Every vendor will say migration is straightforward, and in the narrow sense of moving rows into fields, it usually is. The questions worth asking are about the cleaning, because that is the part that decides whether the first review is useful or just faster.
| Question | What a weak answer sounds like | What you are looking for |
|---|---|---|
| Who does the loading? | “We’ll send you the import template” | Someone sits with you and loads it, so the cleaning decisions get made |
| Is it included or priced separately? | Left until the order form | Named in the quote either way |
| Will you tell us what looks wrong? | “We import whatever you give us” | They flag dense correlation grids, shared owners and undefined KPIs |
| How much history can come across? | “As much as you like” | A view on what is worth bringing, which is less than you think |
| What happens to changed targets? | Not considered | The reason a target changed survives the move, or is captured in a note |
| How long from file to first review? | A range in months | Weeks, with a date |
The third row separates a data migration checklist from an actual migration.
The third question is the one that matters most and the one least often asked. A vendor that imports your file exactly as it stands has sold you a faster spreadsheet, and the inflated correlations will be on screen in the first review with their name on them. A vendor that pushes back during loading is doing the job you are paying for, and the pushback is cheapest before anything is signed.
Worth asking at the same time whether the matrix is the only thing moving. If teams already run OKRs in another tool, migrating the matrix alone leaves the roll-up from team key results to hoshin objectives to be rebuilt by hand later, which is a second migration nobody budgeted for. RFP questions that separate matrix storage from strategy execution covers how to put all of this to a shortlist in writing.
Step 3: map to the new model
Most hoshin software uses the same core elements as the X-matrix: objectives, priorities or activities, KPIs and correlations, sometimes with perspectives. The mapping is usually straightforward. Three decisions need care.
- Periods. Which objectives are multi-year and which are annual. Set breakthroughs on their full strategy period so they carry over at the reset.
- Levels. If sites or functions keep their own matrices, decide whether to migrate them now or connect them after the first review cycles. Usually later is better.
- Existing goals. If teams already run OKRs, decide whether their key results should contribute to hoshin objectives from day one.
Step 4: decide how much history to bring
Bring this year’s monthly actuals for primary KPIs and key priorities, so the first bowler and the first outcome-lag view have something to show. Bring last year’s results only if they’re clean and you’ll use them in the next planning cycle. Don’t try to reconstruct years of history; summarize it in a note on each breakthrough instead.
Load enough history to make the first review useful. Anything more is archaeology.
Step 5: run in parallel once, then retire the file
Run one review cycle with both the tool and the old file available, to build confidence. Then archive the file as read-only, with the date in its name, and say so. A spreadsheet that stays editable alongside the tool becomes a second source of truth within weeks, and the migration quietly fails.
Implementing Hoshin Kanri Software: The First 90 Days covers what to do once the matrix is loaded. In Profit.co, we load your matrix with you in the first working session, so the cleaning decisions are made together and the first review can follow straight away. More on the hoshin kanri software overview.
Because Hoshin Kanri sits in the Essentials plan with OKRs and Goals, Balanced Scorecard and Strategy Roadmap, a matrix migration and an OKR program can land on the same data model rather than becoming two projects a year apart. Migrating into a hoshin tool and then buying OKR software, with balanced scorecard software after it, means the same cleaning conversation three times on three vendors’ terms. The 30-day free trial is long enough to load a cleaned matrix and run the parallel cycle before committing to anything.
Free Product Demo
Migrate your matrix in one session
A 30-minute walkthrough, tailored to your team.
Book a free demo
What happens in the call
How your teams set goals, track progress and review results.
Strategy, performance, projects and engagement on one platform, with AI.
A practical path to align teams, execute faster and drive results.
Questions this article answers
Inventory objectives, priorities, KPIs, correlations and history; clean ownership, definitions and grades; map elements and periods to the tool; load this year’s monthly actuals for key KPIs; run one review in parallel; then retire the spreadsheet.
This year’s monthly actuals for primary KPIs and key priorities, so the first bowler and outcome-lag views have something to show. Older history is better summarized in a note than reconstructed.
Only for one parallel review cycle. After that, archive it read-only with a date in its name, or it becomes a second source of truth within weeks.
Six elements to inventory, five things to clean before loading, three mapping decisions, how much history to bring, and one parallel cycle before the old file is archived read-only.
Ideally yes, sitting with you, because the cleaning decisions get made during loading. A vendor that sends an import template and takes your file untouched has sold you a faster spreadsheet.
Because the cancellation test gets applied to marks that were drawn so a priority wouldn’t look orphaned. Halving is normal, and it leaves a first review where the failing links are obvious.


