In this guide
- More dots than anyone believes
- What a single dot actually claims
- The matrix was built for reasoning, then turned into a poster
- Writing a dot as a hypothesis
- A gate for every dot
- Testing the bets as the year runs
- What a correlation record needs from the software
- What this asks of your process and your software
- Questions this article answers
Key Takeaways
- →Dot inflation is rational and ruinous. A priority with no correlation looks like a priority to cut, so owners add correlations until the grid says nothing.
- →One dot makes four claims: direction, mechanism, size and timing. Printed matrices record one of them.
- →Write each correlation as a sentence with a mechanism, contribution, lag window, leading signal and kill signal, signed by both owners.
- →Agree the kill signal at planning, when nobody’s priority is under threat. In September it becomes a negotiation about budgets.
- →Six gates per dot. Expect the matrix to get sparser, and expect that to be an improvement.
- →Software that stores the matrix as a picture of dots will pull the team back to the poster. The correlation has to be a record in its own right.
Every dot on an X-matrix claims that one piece of work will move one result. Most planning teams never write that claim down, so they never find out it was wrong.
More dots than anyone believes
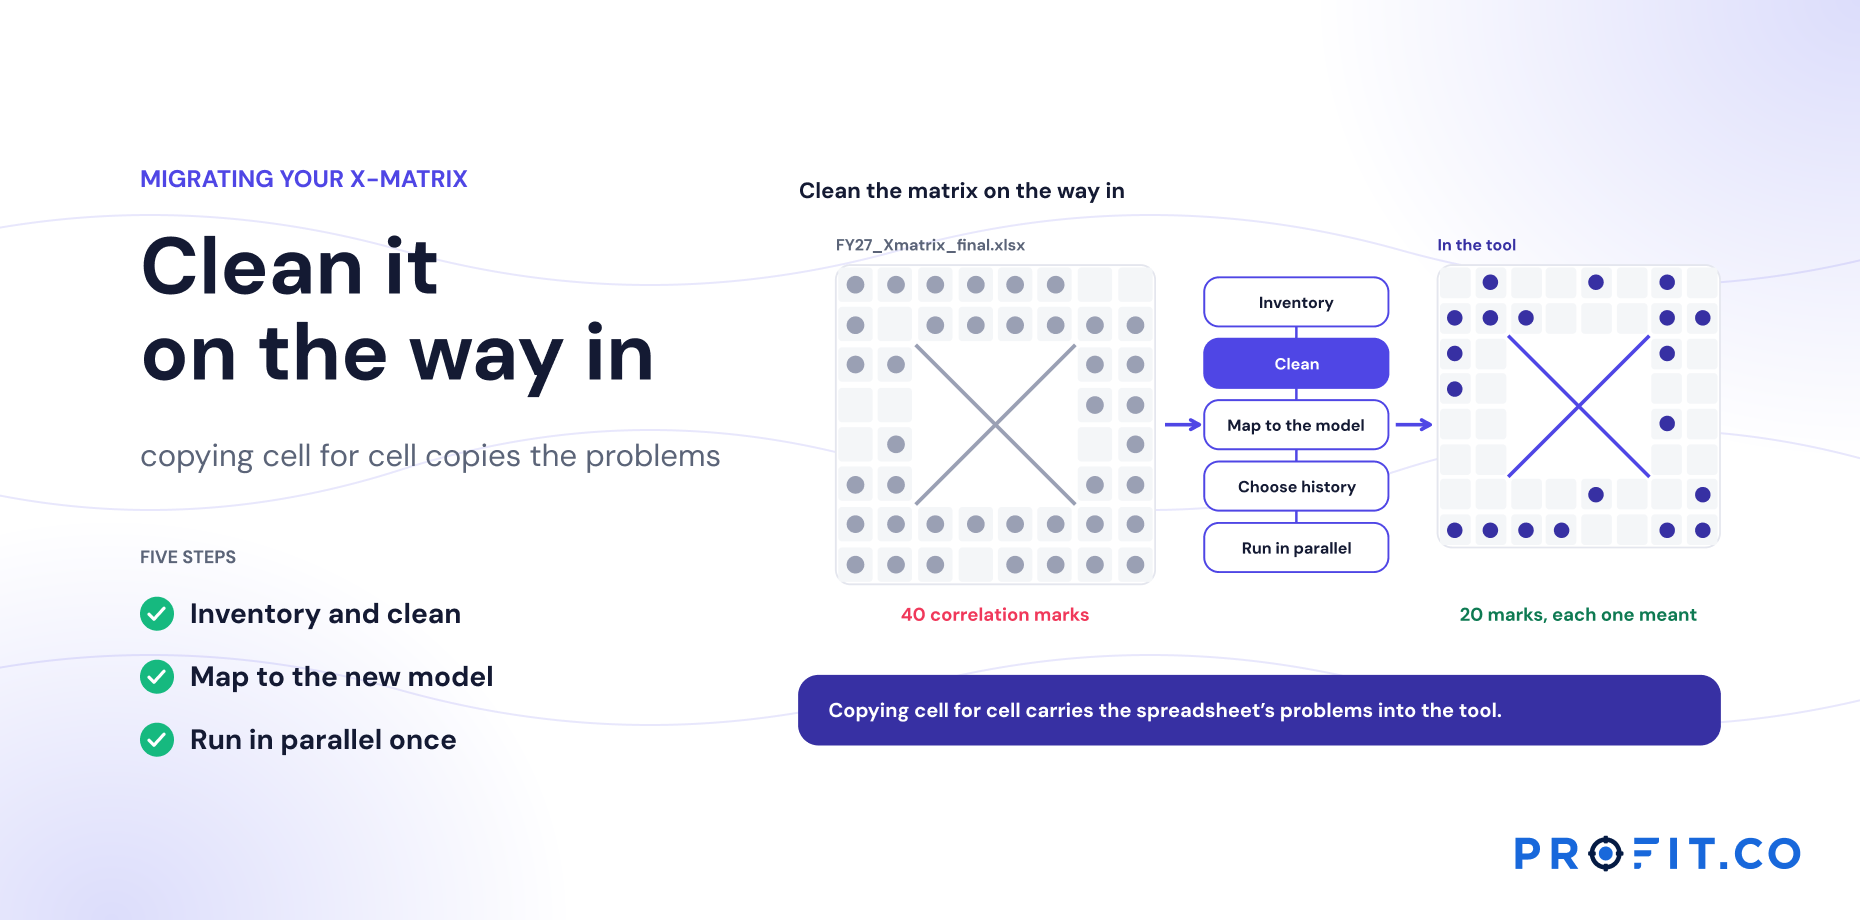
Watch the last afternoon of a hoshin planning offsite and you’ll see the same move repeated. Someone looks at the correlation grid, spots a priority with no dots against it, and asks what it’s for. The owner thinks for a moment and draws a dot. Then another. Nobody objects, because objecting would mean arguing that a colleague’s priority doesn’t matter.
By the end of the day every row has three or four dots. The grid looks dense, and density reads as alignment. The matrix gets printed, and everyone leaves believing that every piece of work connects to the results the business needs.
Ask the same room a different question, which of these dots would you bet your bonus on, and the grid thins out fast. Most people will defend one or two per row. The rest were drawn so the priority wouldn’t look orphaned.
Call it dot inflation. It’s entirely rational. A priority without a correlation looks like a priority to cut, so owners add correlations. But a matrix where everything relates to everything says nothing about what causes what, and that is the only thing the matrix was supposed to say.
What a single dot actually claims
Take one correlation: a priority to expand the service network, linked to a KPI for services as a share of sales. The dot makes four claims at once.
- Direction. Delivering the priority will push the KPI up, not down or sideways.
- Mechanism. There is a reason it will. More service points close to the installed base raise the rate at which equipment customers buy service contracts.
- Size. The effect is big enough to matter against the target, not a rounding error.
- Timing. The effect will show up within some window, perhaps two quarters after each new center opens.
The printed grid records one of these, sometimes two: that a link exists, and perhaps how strong it is. Direction is usually implied. Mechanism, size and timing stay in the heads of the people who drew the dot, and different heads hold different versions. The priority owner may believe the effect takes a year. The KPI owner may be counting on it by Q3. Neither knows the other disagrees until the review where the KPI hasn’t moved.
A dot that doesn’t state its mechanism, size and timing can’t be wrong. And a claim that can’t be wrong can’t teach you anything.
The matrix was built for reasoning, then turned into a poster
None of this is a criticism of hoshin kanri. It’s a return to it. The method came out of Japanese quality management in the 1960s and was codified for Western readers in Yoji Akao’s Hoshin Kanri: Policy Deployment for Successful TQM. Thomas Jackson’s Hoshin Kanri for the Lean Enterprise later made the X-matrix the method’s best-known artifact. Both treat deployment as a cycle of plan, do, check and act.
PDCA only works if the plan is a prediction. The check step compares what happened with what was expected; if nothing specific was expected, there is nothing to check against. In that sense the X-matrix was always meant to be a set of hypotheses. Each correlation is the “P” for a small experiment that the organization runs for a year.
What changed is the way the matrix gets produced. It has become the deliverable of the planning event: drafted over three days, polished, printed, and then held fixed as a reference. A fixed reference is the opposite of a hypothesis. It’s designed to be agreed with, not tested. The practitioners know better. The format pushes them the other way.
Writing a dot as a hypothesis
The fix is small and structural: every correlation gets a short record that states the full claim. One sentence carries most of it.
If we deliver [priority] by [date], [KPI] will move from [baseline] to [target] by [date], because [mechanism]. We will know early if [leading signal] moves by [date]. We will treat it as a losing bet if [kill signal].
Filled in for the service network example, the record looks like this.
| Field | Value |
|---|---|
| Priority | Open six regional service centers within two hours of 80% of the installed base |
| KPI | Services share of sales, from 31% to 36% by year end |
| Mechanism | Proximity raises the rate at which equipment buyers attach a service contract |
| Contribution | About 3 of the 5 points; pricing and digital services carry the rest |
| Lag window | Two quarters after each center opens |
| Leading signal | Contract attach rate in each new center’s territory |
| Kill signal | Attach rate in new territories not above the old baseline by month four |
| Strength | Primary |
Illustrative correlation record.
Two fields do most of the work. The contribution line forces the room to split the KPI’s target across the priorities that claim it. If five priorities each claim most of a five-point gap, the arithmetic exposes the inflation immediately.
The kill signal is the more important of the two. It is agreed at planning, when nobody’s priority is under threat and everyone can think clearly about what failure would look like. Decided in September, the same threshold becomes a negotiation about whose budget gets cut.
Grading strength with one question each
Most X-matrices grade correlations as strong, medium or weak, and most teams grade them by feel. A question per grade makes the grading repeatable.
| Grade | The question |
|---|---|
| Primary | If this priority were cancelled tomorrow, would we expect to miss the KPI target? |
| Secondary | Does it help the KPI, while the target would survive without it? |
| Partial | Does it affect one component of the KPI, such as one region or one product line? |
A useful side effect: each KPI should have at least one primary correlation. A KPI with only secondary dots is a result nobody is directly working on, which is worth knowing in January rather than December.
A gate for every dot
Before a correlation goes on the final matrix, it should pass six binary checks. Treat any “no” as a reason to downgrade the dot or remove it.
- Mechanism. Can the priority owner state, in one sentence, why the work moves the KPI?
- Size. Is there a number for how much of the KPI’s movement this priority accounts for?
- Window. Is there a date by which the effect should be visible?
- Leading signal. Is there something that should move before the KPI does?
- Kill signal. Has the team agreed now what result would mark this as a losing bet?
- Two signatures. Have the priority owner and the KPI owner both accepted the record through catchball?
Expect the matrix to get sparser. A team that typically draws three or four dots per row often ends up with one or two that pass. That is the point. A thinner matrix of defended claims tells leadership far more than a dense one, and it gives the review something specific to check.
The last check matters more than it looks. Most outcome-lag arguments are really arguments about an assumption that the two owners never shared. Making them sign the same record surfaces the disagreement during catchball, which is what catchball is for.
Testing the bets as the year runs
A written hypothesis changes the monthly review. Instead of walking the matrix row by row and asking whether each priority is on schedule, the review asks of each correlation: has the leading signal moved, is the lag window still open, and has the kill signal fired?
This doesn’t require proof of causation. KPIs move for many reasons, and no monthly review will untangle them all. What the review needs is disconfirmation: evidence that a bet is not working. That is much easier to get. If the service centers have opened, the attach rate in their territories hasn’t moved, and the window has closed, the mechanism didn’t hold. You don’t need a controlled experiment to act on that.
The most common and most expensive pattern is a priority that is progressing while its KPI is not. It has a name, outcome lag, and four distinct causes with different responses. It gets its own article: Outcome lag: when priorities are green and KPIs don’t move.
One habit worth adopting at the annual reset: count the dots that turned out to be wrong. If the answer is zero, the matrix wasn’t ambitious or it wasn’t tested. Neither is a good result.
What a correlation record needs from the software
The process changes above are free. Keeping them alive past the second quarter is where the tool decides the outcome, because a correlation record is a structure, and structures that live in a side document get abandoned. Six things are worth testing before a shortlist narrows.
| What the hypothesis needs | Why it matters | How to test it in a demo |
|---|---|---|
| The correlation is a record, not a mark | A dot you cannot open is a picture, and a picture cannot hold a mechanism | Ask to click a dot and see what opens |
| Fields for mechanism and contribution | Free-text notes get skipped; a named field gets filled | Ask where the contribution estimate is entered, not described |
| A lag window stored on the dot | “Too early to tell” needs a date or it extends forever | Ask what happens when a lag window closes |
| A kill signal that is checked | A kill signal nobody surfaces is a note, not a gate | Ask how the review learns a kill signal has fired |
| Owners on both ends | The two-signature check needs two accounts, not one author | Ask who can accept a correlation record |
| A strength history | Counting the dots that were wrong is only possible if changes are dated | Ask to see why a correlation was downgraded last year |
A tool that fails row one fails all six, because everything else hangs on the dot being a record.
The first row is the whole test. A great deal of x matrix software renders a beautiful grid and stores each correlation as a cell value, which is enough to print and not enough to reason with. If clicking a dot opens nothing, the hypothesis record will end up in a spreadsheet beside the tool, which is where the poster problem started.
Worth asking the same question of an x matrix template, if that is the current plan. A template in a spreadsheet can hold every field above perfectly well for one planning cycle. What it cannot do is surface a fired kill signal in month four, which is the point of writing one. The seven pass/fail tests cover the rest of the evaluation, and what drives the cost of hoshin kanri software covers what the upkeep of a template route actually costs.
What this asks of your process and your software
Three changes to process carry most of the value. The planning offsite produces correlation records, not just a grid. The monthly review is organized around correlations, not rows. The annual reset begins with the list of bets that lost and what they taught.
Software can make those changes stick or quietly undo them. A tool that stores the matrix as a picture of dots will pull the team back to the poster. What the hypothesis view needs is a correlation that is a record in its own right: graded by strength, owned on both ends, and connected to live progress on the priority and on the KPI so the two can be compared each month.
That is how Profit.co’s hoshin module is built. Each correlation carries a primary, secondary or partial grade and its expected lag, so “too early to tell” has a date. Profit.co’s exception queue flags each correlation whose hypothesis didn’t hold, and initiative escalation flags delivery problems, so outcome lag reaches the review as a named item rather than something someone has to spot. Every decision to keep, downgrade or upgrade a correlation is written to its strength history, so at the annual reset the team can see which bets were changed, when and why. The hoshin kanri software overview walks through it against seven buyer tests.
Hoshin Kanri sits in the Essentials plan with OKRs and Goals, Balanced Scorecard and Strategy Roadmap, so the leading signal on a correlation can be a team key result checked in by its own owner rather than a number someone copies across from OKR software each month, or from balanced scorecard software when the KPI is a board measure. An x matrix strategy that depends on three subscriptions staying in step is a strategy with a reconciliation step built into it. The 30-day free trial is long enough to write one real correlation record and watch its lag window behave.
Free Product Demo
Find out which of your dots are bets you’d take
A 30-minute walkthrough, tailored to your team.
Book a free demo
What happens in the call
How your teams set goals, track progress and review results.
Strategy, performance, projects and engagement on one platform, with AI.
A practical path to align teams, execute faster and drive results.
Questions this article answers
It claims that delivering a priority will move a KPI in a stated direction, through a stated mechanism, by an amount that matters, within a stated time. Most matrices record only that a link exists.
The habit of adding correlations so no priority looks orphaned. The grid becomes dense, density reads as alignment, and the matrix stops saying which work actually drives which result.
A condition agreed at planning that marks the bet as losing, such as a leading indicator not moving by a set month. Agreeing it in advance makes retiring a priority a planned decision rather than a mid-year argument.
Make each one a record you can open, with fields for mechanism and contribution, a stored lag window, a kill signal the review surfaces, owners on both ends, and a dated strength history.
For one planning cycle, yes. A spreadsheet template holds every field well enough. What it cannot do is surface a fired kill signal in month four, which is the reason for writing one at all.
Fewer than most have. Teams that draw three or four per row typically end up with one or two that pass the six gates. A thinner matrix of defended claims tells leadership more than a dense one.