

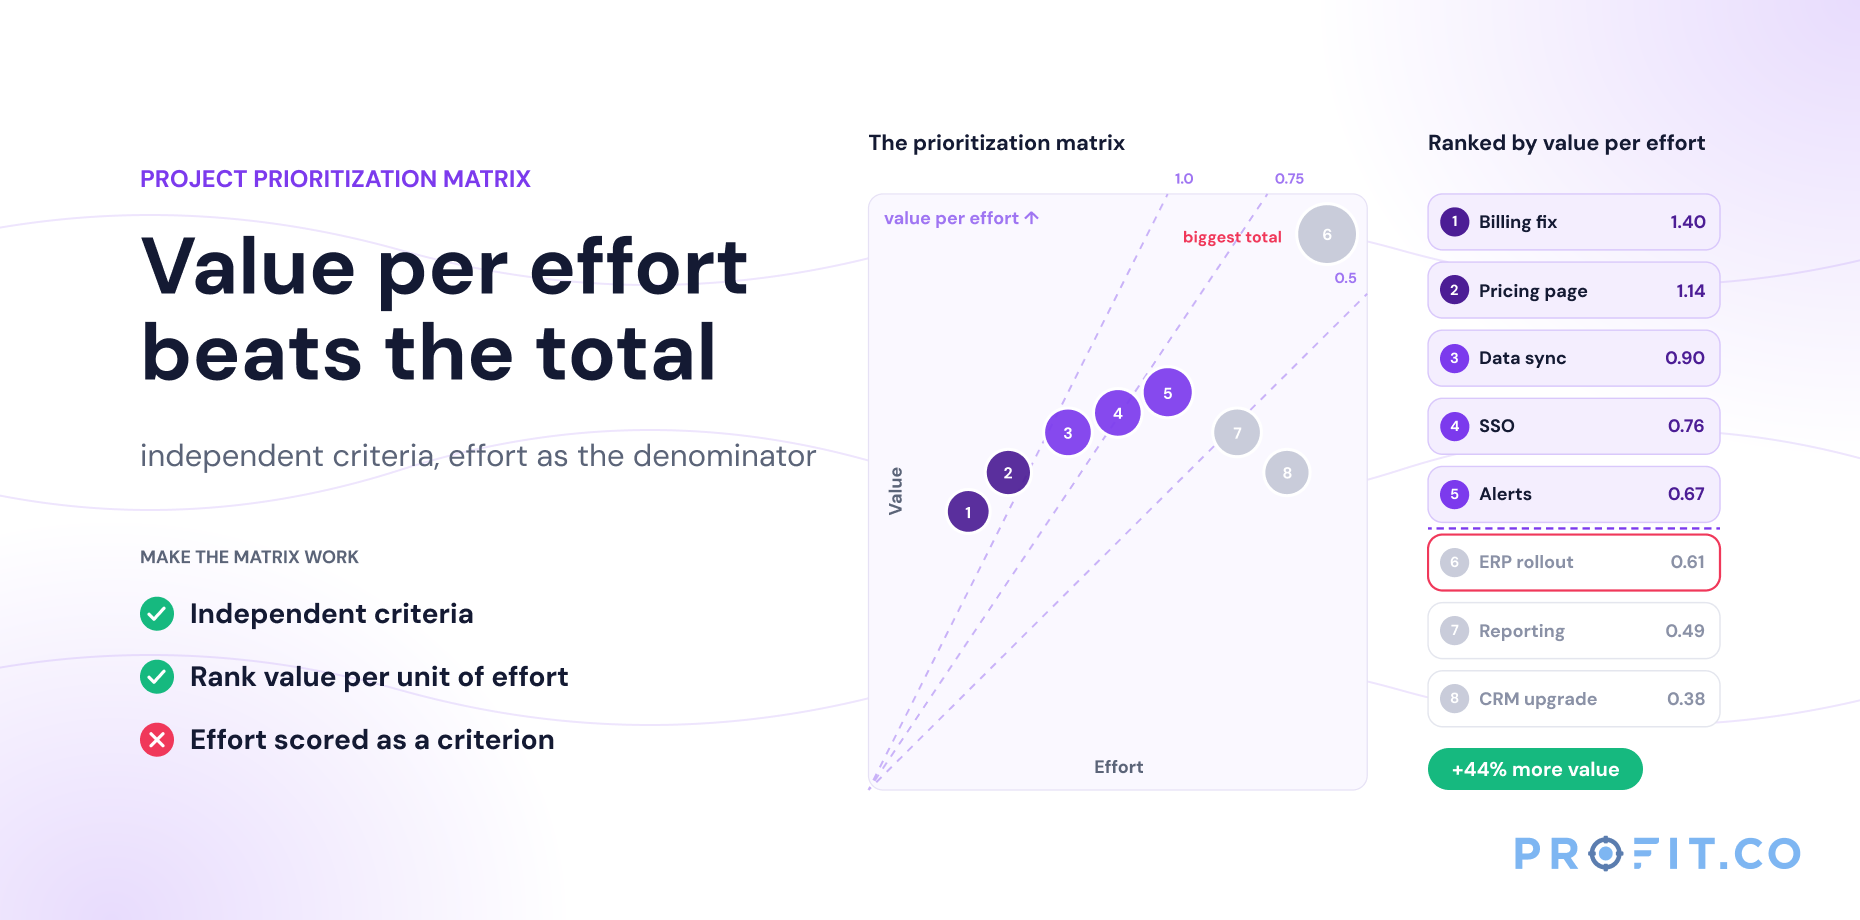
A matrix where everything scores high is not a prioritization tool. It is a consensus-building exercise with arithmetic attached.
In this guide
- What Is a Project Prioritization Matrix?
- What Criteria Should You Score Projects On?
- How Do You Build a Project Prioritization Matrix?
- Project Prioritization Matrix Example
- Which Prioritization Model Should You Use?
- Why Do Prioritization Matrices Fail?
- How Does Profit.co Support Project Prioritization?
- Frequently Asked Questions
What Is a Project Prioritization Matrix?
A project prioritization matrix is a scoring table that ranks candidate projects against weighted criteria, then sequences them against available capacity. The matrix is only useful when its criteria are independent of each other and the ranking divides value by effort rather than scoring value alone. It is not the same as the Eisenhower matrix, which sorts personal tasks by urgency and importance.
Those two conditions are where most matrices quietly fail. Criteria like “strategic value”, “business impact” and “alignment to goals” look like three measures and behave like one, because the same projects score high on all of them. Averaging three correlated scores produces a more confident version of the same opinion, not a more accurate one.
The second condition matters more. A ranked value list with no capacity line attached is a wish list in descending order. The decision a portfolio actually needs is where to stop, and a matrix that does not produce that line has not finished its job. The companion to this piece, why most teams get project prioritization wrong, covers the organizational side; this one is the mechanics.
What Criteria Should You Score Projects On?
Three to five, chosen so that a project can plausibly score high on one and low on another. If you cannot imagine that combination, the criteria are measuring the same thing.
- Strategic contribution. How directly the project advances a stated objective. Score against the published objective list, not against a sense of importance.
- Financial return. Revenue gained or cost removed, over a stated horizon. Keep it separate from strategic contribution; plenty of profitable work is strategically neutral.
- Risk or cost of delay. What it costs to not do this, or to do it later. This is the criterion that correctly rescues compliance and technical-debt work from the bottom of every value-based list.
- Confidence. How well understood the estimate is. A high score on an unreliable estimate is worth less than a moderate score on a known one, and making that explicit stops optimistic projects crowding out predictable ones.
- Effort. Not a scoring criterion. Effort is the denominator, and mixing it into the score is the most common structural error in these matrices.
Weight the scoring criteria so they total 100. Resist equal weights: if every criterion carries the same weight, you have declined to state what the organization cares about, which was the purpose of the exercise.
How Do You Build a Project Prioritization Matrix?
- Fix the candidate list. Every project competing for the same capacity pool, including work already in flight. Excluding running projects produces a ranking that cannot be acted on.
- Choose and weight the criteria. Three to five, independent, totalling 100. Agree the weights before any project is scored, because agreeing them afterwards is just negotiating the answer.
- Define what each score means. Write one line per point on the scale. “Strategic contribution 5 = directly delivers a stated annual objective; 3 = supports one indirectly; 1 = no stated link.” Without this, scores measure enthusiasm.
- Score independently, then reconcile. Have two or three people score separately and compare. Disagreements of two points or more are where the real conversation is, and a group scoring together converges on the loudest voice.
- Estimate effort in one consistent unit. Engineer-weeks, or whatever the binding resource is. Money is a poor proxy when the constraint is people.
- Calculate the ratio. Weighted score divided by effort. Rank on that.
- Draw the capacity line. Work down the ranked list, accumulating effort, and stop at available capacity. Everything below the line is explicitly deferred, not vaguely pending.
- Record the overrides. Leadership will move something above the line. That is legitimate; leaving it unrecorded is not. Note what moved, who moved it, and what dropped out to make room.
Project Prioritization Matrix Example
Five candidate projects, one quarter, 80 engineer-weeks of available capacity. Criteria weighted: strategic contribution 40, financial return 30, risk and cost of delay 30. Each scored 1 to 5.
| Project | Strategic (40) | Financial (30) | Risk (30) | Weighted score | Effort (eng-weeks) | Score per week |
|---|---|---|---|---|---|---|
| Compliance reporting upgrade | 2 | 1 | 5 | 260 | 12 | 21.7 |
| Customer portal redesign | 5 | 4 | 1 | 350 | 25 | 14.0 |
| Billing platform migration | 4 | 3 | 5 | 400 | 40 | 10.0 |
| Internal analytics refresh | 3 | 2 | 2 | 240 | 30 | 8.0 |
| Warehouse automation | 5 | 5 | 3 | 440 | 60 | 7.3 |
Now apply the capacity line. Working down by score per week: compliance reporting (12 weeks, running total 12), customer portal (25, total 37), billing migration (40, total 77). The next project needs 30 weeks and only 3 remain, so the line is drawn. Three projects funded, 77 of 80 weeks committed.
Why the ranking method changes the answer
Rank the same five projects by weighted score alone, as most matrices do, and warehouse automation goes first at 440. It consumes 60 of the 80 weeks. Billing migration needs 40 and does not fit; customer portal needs 25 and does not fit; compliance reporting needs 12 and does. The quarter funds two projects totalling 700 points of value.
The ratio method funds three projects totalling 1,010 points from the same 80 weeks. Same scores, same capacity, 44% more value delivered, purely from dividing by effort before ranking.
Warehouse automation is not a bad project. It is a project whose value is real but expensive per unit of the scarce resource, and a quarter is the wrong container for it. The honest conclusion is to sequence it when capacity allows, or split it, rather than letting it absorb a quarter because it topped a value list.
Score and Sequence Your Portfolio Against Real Capacity
Which Prioritization Model Should You Use?
Four common approaches, with genuinely different strengths. The weighted matrix above is the general-purpose option; the others suit specific situations.
The Four Models Compared
| Dimension | Weighted Scoring Matrix | Value vs Effort 2×2 | Cost of Delay per Week | Forced Ranking |
|---|---|---|---|---|
| How it works | Weighted criteria, divided by effort | Plot on two axes, pick the quick wins quadrant | Estimate the cost of each week of delay, divide by duration | Stakeholders order the list with no ties allowed |
| Best for | Mixed portfolios with competing criteria | Fast triage of 10 to 20 items | Time-sensitive work with quantifiable delay cost | Small lists where criteria cannot be agreed |
| Effort to run | Half a day, repeatable each quarter | An hour | High, needs real financial estimates | An hour, plus the argument |
| Handles compliance work | Yes, via a risk criterion | Poorly; it scores low on value | Yes, naturally | Depends entirely on the room |
| Main weakness | Correlated criteria inflate everything | Everything lands in one quadrant | Delay costs are often guesses dressed as data | Reflects influence more than merit |
| Produces a capacity line | Yes, if you add effort totals | No | Yes | Yes |
| Auditable later | Yes, scores and weights are recorded | Weakly | Yes | No |
Most organizations should default to the weighted matrix and reach for the others situationally. Profit.co’s Prioritization and Optimization grid applies the value versus effort idea at portfolio level, plotting each project’s Benefit Index against its Complexity Index. Whichever you choose, pair it with a disciplined project intake process, because a prioritization method applied to an ungoverned request flow just ranks the noise.
Why Do Prioritization Matrices Fail?
- Correlated criteria. Strategic value, business impact and goal alignment are one criterion wearing three hats. The scores reinforce rather than test each other.
- No capacity line. A ranked list that funds everything in principle has prioritized nothing in practice. The line requires honest numbers from demand and capacity planning.
- Effort folded into the score. Scoring “quick wins” highly inside the value calculation double-counts effort and hides the trade-off the ratio is meant to expose.
- Group scoring. Scoring together converges on whoever speaks first or loudest. Score separately, then reconcile the gaps.
- Everything scores four or five. If the distribution is compressed at the top, the scale definitions are missing or the list was pre-filtered by the same people now scoring it.
- Run once, never repeated. Priorities are a quarterly judgment, not an annual artifact. Re-running the matrix is also what lets you stop work already underway rather than only choosing new starts.
- Overrides left unrecorded. Leadership moving something above the line is legitimate. Nobody knowing it happened is how the matrix loses credibility by the second cycle.
How Does Profit.co Support Project Prioritization?
Profit.co’s project portfolio management software carries the scoring, the capacity picture and the resulting sequence in one place, so the matrix stays current instead of becoming last quarter’s spreadsheet.
| Step | Profit.co capability |
|---|---|
| Collect candidates | Demand Management, with every request linked to an active key result |
| Plot benefit against complexity | A prioritization grid that plots each project’s Benefit Index against its Complexity Index |
| Score against strategy | Every project links directly to the OKR it supports |
| Establish the capacity line | Resource capacity planning and utilization analytics |
| Test alternative cuts | Scenario planning across portfolio options before budgets are committed |
| Re-prioritize work in flight | Tollgates: each stage is reviewed and approved before the project moves on |
| Check the scoring held up | Value Realization Office: planned benefits compared with delivered benefits |
Key Takeaways
- →Pick criteria a project could plausibly score high on one of and low on another. Correlated criteria produce confidence, not accuracy.
- →Effort is the denominator, never a scoring line. Divide weighted value by effort and rank on the ratio.
- →In the worked example, ranking by ratio rather than raw value delivered 44% more value from the same 80 engineer-weeks.
- →The capacity line is the output. A ranked list without one has described preferences rather than made a decision.
See how Profit.co turns a scored list into a funded, capacity-checked sequence. Book a demo.
Turn a Scored List Into a Funded Sequence
Frequently Asked Questions
A scoring table that ranks candidate projects against weighted criteria and then sequences them against available capacity. Its output is the line where capacity runs out, not the scores themselves.
Three to five independent criteria, commonly strategic contribution, financial return, risk or cost of delay, and confidence in the estimate. Weight them to total 100. Effort is the denominator, not a criterion.
Agree the weights before scoring any project, and avoid equal weights. Equal weighting declines to state what the organization values, which was the point of the exercise.
By score per unit of effort. In the worked example above, that choice funded three projects instead of two from the same capacity and delivered 44% more total value.
Quarterly, including projects already in flight. Re-running it with running work included is what allows stopping, rather than only choosing which new projects to start.


