Strategy rarely dies in the boardroom. It dies in the ninety days after it.
Strategies fail far more often in execution than in conception. The dominant causes are structural, not intellectual: priorities that never reach the teams who deliver them, work that carries no traceable line back to an objective, funding decisions made in static spreadsheets, and review cycles that surface problems after the window for correction has already closed. Organizations close this gap by connecting strategy, portfolios, projects and people inside a single execution system, where every initiative links to a live Key Result, progress reflects accepted outcomes rather than reported activity, and risk triggers an alert the moment a threshold is crossed rather than at the next status meeting.
Table of Contents
In this article
- What Strategy Failure Actually Looks Like
- The Eight Reasons Strategies Fail
- Strategy Failure Modes: A Diagnostic Reference Table
- The Four-Layer Diagnostic: Where Is Your Strategy Leaking?
- How to Build an Execution System That Does Not Leak
- Worked Examples: What Recovery Looks Like in Practice
- Common Mistakes When Rescuing a Failing Strategy
- Best Practices for Strategy That Survives Contact With Execution
- FAQ
Key Takeaways
- Most strategy failure is an architecture problem, not a thinking problem. The plan is usually sound; the system carrying it into execution is not.
- Separation is the root cause. When the roadmap, the goals, the portfolio and the work live in different tools, progress in one is invisible to the others.
- Traceability beats motivation. Teams do not disengage because they lack ambition, they disengage when they cannot see how their work moves a company objective.
- Reporting activity is not reporting progress. A project can show high completion while its final approval gate is still open, which hides risk until it is expensive.
- Late signals are the most costly failure of all. Risk detected at a quarterly review has already compounded; risk detected at a threshold crossing is still correctable.
- Recovery is systematic, not heroic. Organizations that close the gap redesign how strategy connects to work, rather than asking teams to try harder.
1. What Strategy Failure Actually Looks Like
Strategy failure is rarely dramatic. There is no single meeting where a plan is formally declared dead. Instead, a failing strategy decays quietly across three or four quarters. The annual offsite produces a clear set of priorities. The deck circulates. Within weeks the organization drifts back to the work it was already doing. Twelve months later, leadership reviews the year and finds the numbers moved, but not because of the strategy.
This is why the question is usually answered badly. Leaders look for a flaw in the thinking: the wrong market, the wrong bet, the wrong timing. Those failures exist, but they are the minority. Profit.co’s strategy roadmap software frames the far more common pattern plainly, strategy execution fails when vision and work stay separate, and the gap between the annual plan and daily execution costs the organization every quarter.
The distinction matters because it changes the remedy. A flawed strategy needs better thinking. A failed execution needs better architecture. As Profit.co’s breakdown of the difference between strategy and execution argues, deliberate action and measurable key results are what convert intent into accountability, and neither survives when the plan and the work are managed in separate systems.
2. The Eight Reasons Strategies Fail
Across strategy, portfolio and goal-management practice, the same eight breakdowns recur. They compound: an organization rarely suffers only one.
2.1 The strategy stops at the boardroom door
The plan looks sharp in the leadership meeting, then never reaches the people who carry it out. Distribution is mistaken for deployment, the deck was shared, so leadership assumes the strategy landed. It did not. Sharing a document transfers information; it does not transfer ownership, sequence or accountability.
The fix is structural: strategic themes have to become owned objectives with named accountability at every level. Profit.co’s guidance on cascading OKRs across the enterprise without losing strategic alignment makes the point directly, cascading breaks at scale because companies treat it as a communication exercise when it is an organizational design problem.
2.2 Nobody can prove their work drives the strategy
Teams stay busy without a clear line from daily tasks to the company’s larger goals. This is the failure most often misdiagnosed as an engagement problem. It is a traceability problem. When a manager cannot show which objective their quarter advances, the strategy has no defence against the next urgent request.
Connecting initiatives directly to live OKRs closes this, because every owner can see the parent objective their work rolls into. Profit.co’s analysis of why smart enterprises still struggle with alignment is blunt about the mechanism: misalignment emerges from structure, how strategy cascades, how teams optimize locally, and how information flows, not from weak goals.
2.3 Funding decisions still run through spreadsheets
Most portfolios fund what feels familiar rather than what the strategy requires. Budgets get argued over in static files that are out of date the moment they are shared, and funded work piles up with no clear line to the goals it was meant to advance. This is the failure mode Profit.co’s strategic portfolio management platform is built to remove, by tying every funded initiative to a strategic goal so leadership can see what is on strategy and what is drifting.
2.4 Activity gets reported as outcome
A project can report high completion while its final stage gate is still awaiting sign-off. The number is technically accurate and practically misleading, it reflects work done, not value accepted. Executives then make sequencing decisions on a picture that is more optimistic than reality.
The September 2026 Profit.co release addresses this with tollgate-based progress reporting, where a configurable amount of a gate’s weight is held back until the gate is formally approved. A gate weighted at 5 with a hold-back of 1 reads as 4 until sign-off, then moves to 5. The reported figure becomes honest about what has actually been accepted.
2.5 Dependencies stay invisible until they break
A slip in one team silently stalls three others, and nobody notices until a target date is missed. Profit.co’s Dependencies tab on OKR and Key Result detail pages consolidates waiting-on, blocking and linked relationships onto one canvas centred on the item in question. The recommended practice from that documentation is worth adopting as policy: check dependencies before changing an OKR’s target dates, because the upstream and downstream layout surfaces risk faster than reviewing each row individually.
2.6 Risk surfaces only at the status meeting
Historically, portfolio risk surfaced through periodic status meetings or manual dashboard checks, often after a budget overrun or schedule slip had already compounded. By the time the review happens, the window for cheap correction has closed.
Profit.co now supports configurable threshold alerts that evaluate on every project, portfolio, task or milestone update. Conditions can be built on health status, financial metrics such as budget utilization and amount spent, and earned value metrics including CPI, SPI, TCPI, CV, SV and VAC. When a threshold is crossed, the alert lands as a dashboard badge, an Action Center notification, an email, or a webhook call. Setup is documented in the threshold alerts guide for projects, portfolios, tasks and milestones.
2.7 The plan assumes every goal moves in a straight line
Not all work progresses evenly. Campaigns front-load. Pipeline builds back-load. Software rollouts follow an S-curve, slow at first, spiking after training, then plateauing. When every target is distributed linearly, back-loaded work looks like failure in month two and gets intervened on, or quietly abandoned, long before it was ever due to deliver.
Profit.co’s September 2026 release added five progression models for Key Result plans, Linear, Front-loaded, Back-loaded, S-curve and Stepped, so check-in targets reflect the actual shape of the work rather than an arithmetic convenience. Each model shows the underlying formula and a worked example on the team’s own KR values before it is applied.
2.8 Benefits are never measured after delivery
Projects close, teams celebrate, and nobody checks whether the expected value actually arrived. Without that loop, an organization cannot tell a good bet from a lucky one, and next year’s plan repeats the same allocation logic. Value realization, comparing actual benefits against plan and tracking value past project close, is what converts a portfolio from a delivery engine into a learning system.
3. Strategy Failure Modes: A Diagnostic Reference Table
Use this table as a triage tool. Identify the symptom you actually observe, then treat the layer where it originates, not the layer where it shows up.
| Failure Mode | What You Notice in the Business | Layer Where It Breaks | How to Close It |
|---|---|---|---|
| Strategy never reaches the floor | Teams can describe their work but not the objective it serves | Translation | Cascade themes into owned OKRs with visible parent hierarchy |
| No traceable line from work to goal | Everyone is busy; nobody can prove impact | Translation | Link every initiative and project to the Key Result it supports |
| Funding runs on spreadsheets | Budget debates use figures that are stale on arrival | Investment | Move portfolio funding decisions onto live, OKR-linked data |
| Activity reported as outcome | Projects read 100% complete while approvals are still open | Feedback | Use tollgate-based progress with a hold-back until sign-off |
| Invisible dependencies | A slip in one team silently stalls three others | Translation | Review upstream, downstream and linked items before re-dating |
| Risk surfaces too late | Overruns are discussed after the quarter closed | Feedback | Configure threshold alerts on health, budget and EVM metrics |
| Plans assume linear progress | Back-loaded work looks like failure in month two | Direction | Choose a progression model that matches the real work shape |
| Benefits never measured | Delivery is celebrated; promised value is never checked | Investment | Track planned vs actual benefits past project close |
4. The Four-Layer Diagnostic: Where Is Your Strategy Leaking?
Strategy loses energy at four predictable points. Run each question honestly; the first one you cannot answer with evidence is where your leak is.
- Direction. Can leadership name the three to five priorities that matter this year, in the same words, without reading from a deck? If the answer varies by executive, nothing downstream can be aligned.
- Translation. Can a randomly chosen manager name the company objective their quarter advances and show the link? If not, the strategy stopped at their manager’s inbox.
- Investment. Can finance produce a list of funded projects mapped to strategic objectives, with no orphans? Orphaned funding is strategy drift with a budget code.
- Feedback. When a project slipped last quarter, how many days passed between the slip and leadership learning about it? If the answer is measured in weeks, your reviews are archaeology, not governance.
For a deeper structured version of this exercise, Profit.co’s walkthrough on conducting a strategy gap analysis covers the methods and tools for turning these questions into a repeatable assessment.
See where your own strategy is leaking
5. How to Build an Execution System That Does Not Leak
Closing the strategy-execution gap is a sequence, not a single initiative. These six steps map directly onto the four layers above.
Step 1: Fix direction before you cascade anything
Reduce the strategy to a small number of themes leadership can state identically. Over-scoped strategy is the most common upstream cause of downstream chaos. Profit.co’s review of common OKR mistakes and how to avoid them recommends three to five high-level objectives precisely because focus is what makes cascading survivable.
Step 2: Translate themes into owned, measurable objectives
Each theme becomes objectives with named owners and quantified key results. Avoid copying company objectives word-for-word down the hierarchy; that is how context is lost. Choose the execution model that fits your organization, OKRs, Balanced Scorecard, or Hoshin Kanri, and apply it consistently rather than running three in parallel.
Step 3: Connect funding to objectives before the money moves
Every funded project should carry a link to the objective it advances, established at approval rather than reconstructed at review. Running this through project portfolio management means portfolio health and strategic alignment are read from the same record.
Step 4: Make the plan shape match the work shape
Select the progression model that reflects how the work will actually unfold, and set milestone structures where delivery is staged. A back-loaded key result planned as back-loaded generates accurate check-in targets, and stops the organization from panicking in month two over a plan that was always going to land late in the period.
Step 5: Instrument the feedback loop
Configure alerts to fire on threshold crossings rather than waiting for a meeting. Bring risks, issues, decisions, assumptions and blockers into the same workspace as the work: Profit.co’s project governance module provides structured tracking across all eight governance categories, Risks, Issues, Project Changes, Actions, Decisions, Assumptions, Blockers, and Strategic Alignment, with auto-generated IDs and an immutable activity log, documented in the guide to tracking risks, issues and governance items in a project.
Step 6: Close the loop on value, not just delivery
Compare actual benefits to planned benefits after close. This is the step almost every organization skips, and its absence is why the same low-yield investments reappear in next year’s plan.
6. Worked Examples: What Recovery Looks Like in Practice
Three patterns drawn from outcomes Profit.co customers have reported publicly. Each maps to a different layer of the diagnostic.
Example 1: Direction and translation, REHAU Building Solutions
The classic failure here is an annual objective set at the top that never becomes a lead indicator anyone tracks. When high-level objectives are treated as the business’s direct lead indicators and reviewed on a live cadence rather than at year end, the year stops being a retrospective surprise. Mark Hudoba, Executive VP at REHAU Building Solutions, reported accomplishing nearly 90% of the high-level objectives set at the start of the year, describing those objectives as direct lead indicators of business success.
Example 2: Translation and participation, Toyota Connected India
Where goal-setting participation is low, strategy is being authored by a minority and executed by nobody. Suganya R., Senior HR at Toyota Connected India, reported that employee participation in goal setting rose from 60% to 80% after implementing Profit.co, with review cycles running 40% faster and leaders gaining real-time visibility into progress. The mechanism matters: faster cycles are what make real-time visibility actionable rather than merely available.
Example 3: Feedback overhead, Intuitive Surgical
A less obvious failure mode is the cost of the reporting itself. When each review consumes days of manual slide-building, organizations review less often, which is precisely how late signals become structural. Gerardo Haro, CI Manager at Intuitive Surgical, reported a 75% reduction in time spent in reviews and an 84% reduction in time spent building executive presentations. Separately, Deena Giordano Ullom, VP of People Operations at United Technical Support Services, reported savings of over $300,000 in a single year after implementing OKRs company-wide.
For a wider set of patterns across industries, Profit.co’s collection of strategy execution examples from high-performing teams documents where the handoff between planning and delivery typically fragments.
7. Common Mistakes When Rescuing a Failing Strategy
- Rewriting the strategy instead of fixing the system. If execution architecture is unchanged, the new plan will fail the same way as the old one, one year later.
- Buying tooling before fixing process. Technology cannot repair alignment problems caused by unclear strategy or poor organizational design, a point Profit.co’s research into why most enterprise OKR programs fail in year two returns to repeatedly.
- Adding metrics instead of removing them. Metric overload dilutes focus. Profit.co’s list of fatal Balanced Scorecard mistakes that kill strategy execution identifies KPI sprawl without a strategy map as a leading cause of collapse.
- Treating unaligned goals as automatically wrong. Some local work legitimately does not roll up. The red flag is a portfolio in which nothing aligns, not the presence of a few independent goals.
- Reviewing quarterly and calling it governance. Quarterly cadence detects failure; it rarely prevents it. Pair it with weekly operational signal.
- Escalating pressure instead of clarity. When teams cannot see the objective, more urgency produces more activity and less strategy.
8. Best Practices for Strategy That Survives Contact With Execution
- Hold to three to five company objectives per cycle, and defend that limit against additions rather than accommodating them.
- Require every funded initiative to carry a link to the objective it serves before budget is released, not after.
- Check dependencies before re-dating any objective, so date changes do not silently break downstream commitments.
- Set alert thresholds on the metrics that would change a decision, health, budget utilization, schedule and cost performance indices, and route them to the person who can act.
- Make progress reporting reflect accepted outcomes, using stage-gate approvals where formal sign-off genuinely matters.
- Run structured review meetings on a predictable cadence, with the same view every time. Profit.co’s meetings module keeps that rhythm attached to the goals being reviewed rather than to a separate agenda document.
- Give strategy and PMO functions a shared operating picture. Purpose-built views exist for strategy and transformation leaders and for PMO leaders, drawing on the same underlying data.
- Track what changes in your execution platform. New capability often removes a failure mode you have been managing manually, the Profit.co release updates page documents each cycle.
Stop diagnosing the gap. Close it.
Frequently Asked Questions
Most strategies fail in execution rather than in conception. The recurring causes are structural: priorities that never reach delivery teams, work with no traceable link to an objective, funding decisions made in static spreadsheets, invisible dependencies, and feedback loops slow enough that risk is discovered after it has compounded. The plan is usually sound; the system carrying it is not.
A bad strategy is wrong about the market, the bet or the timing, it would fail even if executed perfectly. A failed execution means the strategic logic was sound but never translated into owned objectives, funded work and measurable progress. The two require opposite remedies: better thinking versus better architecture. Most organizations misdiagnose the second as the first.
Four early signals: executives describe the priorities differently, managers cannot name the company objective their quarter advances, finance cannot map funded projects to objectives without orphans, and slips take weeks to reach leadership. Any one of these means the strategy is already leaking, regardless of what the current dashboard shows.
OKRs reflect the system they operate within; they do not replace it. Programs commonly collapse in their second year due to governance gaps, middle-management resistance, measurement obsession, poor system integration and change fatigue, the five patterns identified in Profit.co’s research. OKRs succeed when treated as a system design commitment, not as a software rollout.
The PMO owns the investment and feedback layers, ensuring every funded project links to a strategic objective, that progress reporting reflects accepted outcomes rather than reported activity, and that risks, issues, decisions and blockers are tracked with an auditable trail rather than in external spreadsheets.
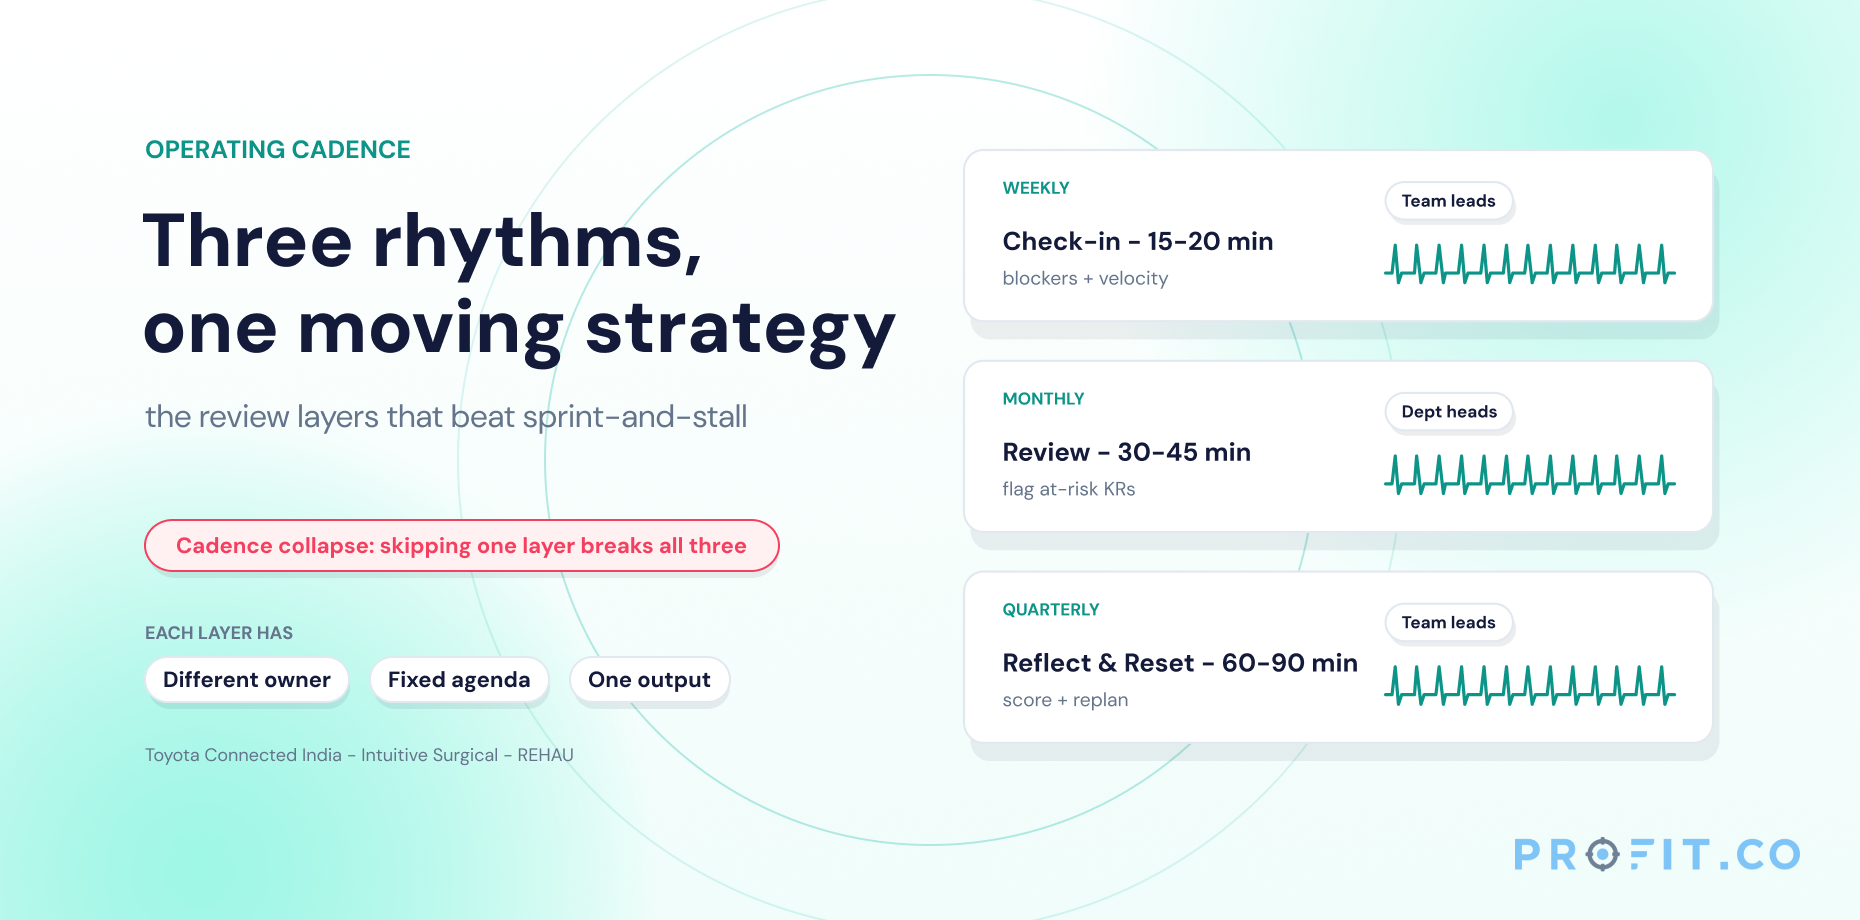
Quarterly review alone detects failure but rarely prevents it. Effective cadences pair quarterly strategic assessment with monthly cross-functional coordination and weekly operational check-ins, supported by automated threshold alerts so material changes surface between meetings rather than waiting for one.
No. Software cannot resolve unclear priorities or poor organizational design. What it can do is remove the structural causes of failure, disconnected systems, stale reporting, invisible dependencies and late risk signals, so that a sound strategy is not lost in the handoff between planning and delivery.