












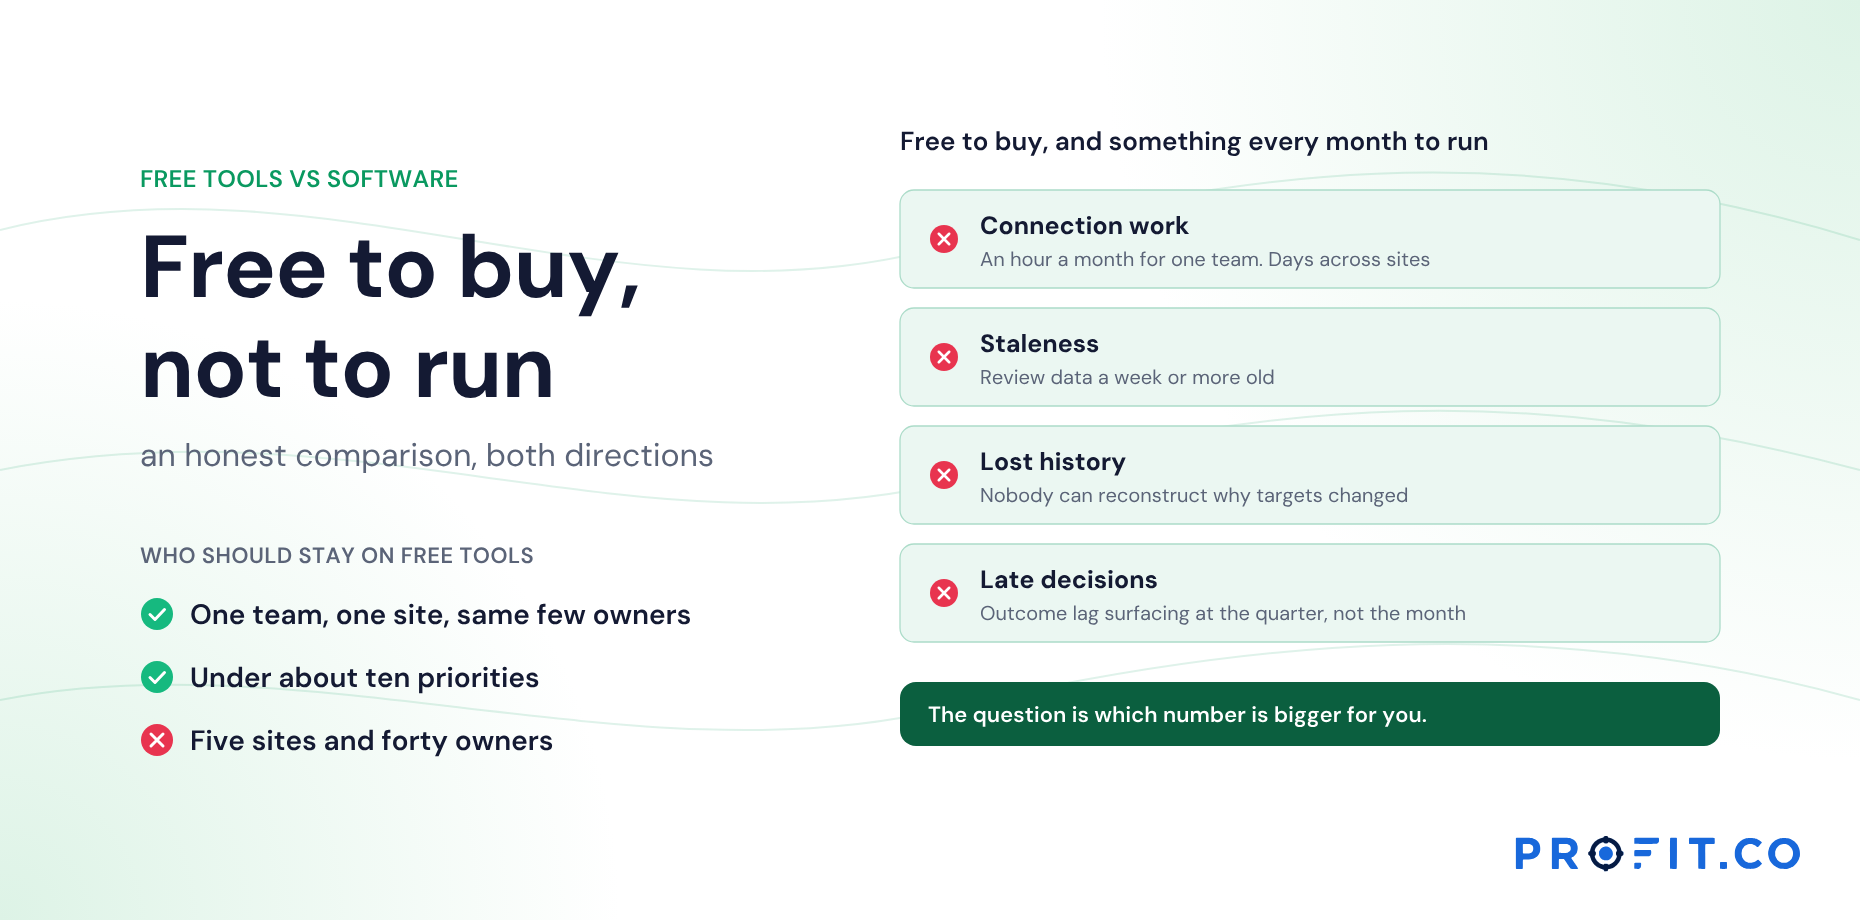

Free hoshin tools aren’t a compromise for everyone. For some programs they are the right answer. For others, “free” hides a monthly cost in people’s time and a larger one in decisions made late.
In this guide
Key Takeaways
- →Each free tool is genuinely good at its job. None was built to hold relationships over a year.
- →Connection work is an hour a month for one team and days for a multi-site program.
- →The expensive hidden cost isn’t the hours. It is outcome lag surfacing at the quarter instead of the month.
- →One team, one site, under ten priorities, same few owners: stay on free tools.
- →If you stay free, spend the saving on method: a correlation tab, a countermeasure column, monthly snapshots.
- →Both decisions in the worked example are right. The shape of the program decides, not the budget.
What free means
| Free tool | Best at |
|---|---|
| Spreadsheet templates | X-matrix and bowler for one team; easy to adapt |
| Slide templates | Presenting a matrix or A3; communication |
| Online whiteboards | Drafting the matrix and running planning tools collaboratively |
| Paper and walls | Thinking, obeya rooms and A3 drafting |
Each is genuinely good at its job. None was designed to hold relationships between tools over a year.
What a good spreadsheet version of each actually needs is set out in X-Matrix Template for Hoshin Kanri: What a Good One Includes and Bowler Chart Template for Hoshin Kanri: Structure, Formulas, Colors.
The hidden costs of free
- Connection work. Someone copies the matrix into the bowler, moves numbers into slides and tracks which A3 relates to which row. In a small team that’s an hour a month. In a multi-site program it can be days.
- Staleness. Files are only as current as their last manual update, and review data is often a week or more old.
- Lost history. Without disciplined snapshots, nobody can reconstruct why targets changed.
- Late decisions. When the comparison between priority progress and KPI progress isn’t automatic, outcome lag surfaces at the quarter or the year end.
Free tools cost nothing to buy and something every month to run. The question is which number is bigger for you.
The fourth bullet is the one that costs real money, and the comparison it describes has a chart of its own; see The Four-Quadrant Chart: Plotting KPIs Against Initiatives in Hoshin Kanri.
Side by side
| Capability | Free tools | Hoshin software |
|---|---|---|
| Drafting and workshops | Excellent | Good, if captured live |
| Cost to buy | None | License and implementation |
| Owners update their own rows | Fragile with many editors | Built in |
| Matrix, bowler and A3s connected | By hand | By the system |
| History of changes | Manual snapshots | Kept by default |
| Outcome lag visible | Manual comparison | Charted |
| Multi-level cascade | Separate files | One model |
Row one is worth reading carefully: free tools win it. The room-versus-system split is covered in Hoshin Planning Software vs a Planning Workshop: What Each Is For.
Who should stay on free tools
- One team, one site.
- The same few people own the matrix, the bowler and the A3s.
- Under about ten priorities on the matrix.
- Reviews in one room, around the same files.
If most of these are true, put your effort into the method: a correlation record tab, a countermeasure column, monthly snapshots. Revisit at the next planning cycle.
A worked example: two programs, two decisions
Here are two hypothetical programs compared side by side, each reaching a different decision:
| Measure | Program A | Program B |
|---|---|---|
| Shape | One plant, 8 priorities, leadership team of 7 | Group plus 5 sites, 14 priorities, 40 owners |
| Monthly connection work | About 2 hours | About 4 days across a program lead and owners |
| Last year’s A3s that changed the plan | Both, by the same person | Unknown |
| Decision | Stay on free tools; add a correlation tab | Move to software before the next cycle |
Both decisions are right. Profit.co is built for program B’s situation, where the X-matrix, bowler, four-quadrant chart, exception queue, catchball sessions and countermeasure A3s need to stay connected across many owners. More on the Hoshin Kanri software page.
What the paid side actually costs
The honest comparison needs the other number, so here it is. Among published alternatives, OnStrategy lists $200 per month for unlimited users. i-nexus publishes a free Starter tier for up to five users and $28 per user per month at its Standard tier. The per-seat model is what decides program B, because 40 owners is the whole point of the move: if the people who own rows can’t afford a seat, the connection work comes straight back.
Profit.co publishes two plans, Essentials and Enterprise, quoting against modules and scale rather than a public seat rate. Hoshin Kanri sits in Essentials alongside OKRs and Goals, Balanced Scorecard and Strategy Roadmap, which matters for the last row of the table above: a cascade in one model rather than five files per site.
Set that against program B’s four days a month and the arithmetic is no longer close. Set it against program A’s two hours and it clearly is. What drives the cost of hoshin kanri software lists everything else to total, and Building the Business Case for Hoshin Kanri Software covers how to put the comparison in front of a finance team.
The 30-day free trial exists for exactly this question: load the current files and run one real monthly cycle against them. Hoshin kanri software vs Excel: the point where the spreadsheet breaks describes the breaking point to watch for while you do.
Free Product Demo
Compare your free tools with a connected setup
A 30-minute walkthrough, tailored to your team.
Book a free demo
What happens in the call
How your teams set goals, track progress and review results.
Strategy, performance, projects and engagement on one platform, with AI.
A practical path to align teams, execute faster and drive results.
Questions this article answers
Yes: spreadsheet X-matrix and bowler templates, slide templates for A3s and plans, online whiteboards and paper. They work well for drafting and single-team programs.
The time spent connecting and updating files, stale review data, lost history of changes, and decisions made late because priority and KPI progress aren’t compared automatically.
When different people own the tools, the plan cascades across levels, or keeping files connected takes days each month.
Drafting and workshops. A whiteboard or a wall beats any system for thinking through a matrix in a group, which is why most programs keep using them even after moving the record into software.
About an hour a month for a single team. For a group with several sites and dozens of owners it can run to several days, spread across a program lead and the owners themselves.
The method rather than the tooling: a correlation record tab, a countermeasure column on the bowler, and disciplined monthly snapshots so the history survives.


