
The root-cause tools in most A3s were built for production problems: a defect, a machine, a process step. Strategy gaps are messier. The tools still work, used in the right order and adapted for causes that live in policies, markets and incentives.
In this guide
Key Takeaways
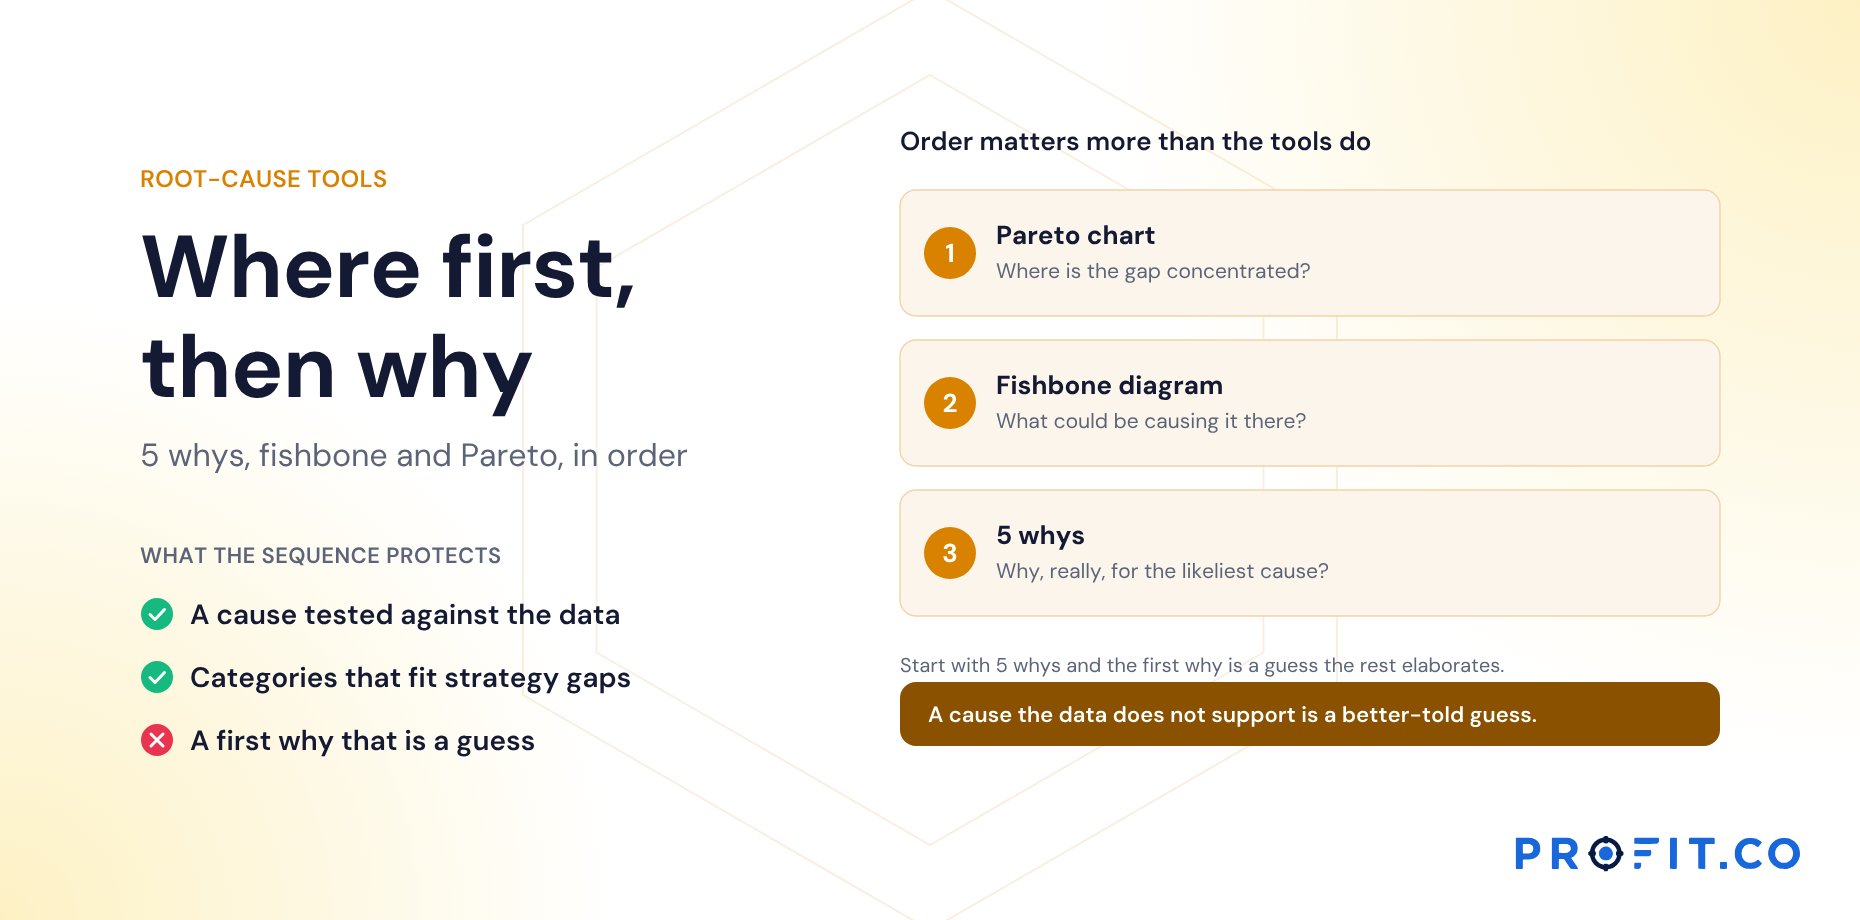
- →Pareto first, then fishbone, then 5 whys. Order matters more than the tools do.
- →Starting with 5 whys on a strategy gap elaborates a guess instead of testing one.
- →Most gaps are concentrated. Investigating the few places beats investigating the average.
- →Swap the manufacturing fishbone categories for policy, process, people, market, measurement and systems.
- →Five whys is a guide. Stop when the answer names a condition you can change.
- →A plausible cause the data doesn’t support is just a better-told guess.
Three tools, one order
| Order | Tool | Question it answers |
|---|---|---|
| 1 | Pareto chart | Where is the gap concentrated? |
| 2 | Fishbone (Ishikawa) diagram | What could be causing it there? |
| 3 | 5 whys | Why, really, for the likeliest cause? |
Many A3s start with 5 whys. On a strategy gap that’s risky: without knowing where the gap is concentrated, the first “why” is usually a guess, and the chain that follows elaborates the guess.
Which gaps earn this analysis at all is a separate question, covered in When a Red Bowler Row Needs an A3 in Hoshin Kanri.
Pareto: find where the gap lives
Named by Joseph Juran after the economist Vilfredo Pareto, the chart ranks contributors to a problem from largest to smallest. For a hoshin gap, break the shortfall down by site, region, product, customer segment or channel. Most gaps are concentrated: a few places account for most of the shortfall. Investigating those few is far more productive than investigating the average.
Fishbone: list the possibilities
The fishbone diagram, developed by Kaoru Ishikawa, groups possible causes into categories. The classic manufacturing categories, such as machine, method, material and manpower, fit strategy gaps poorly. These work better:
| Category | Example questions |
|---|---|
| Policy | Do rules, approvals or incentives work against the change? |
| Process | Does the way work actually flows bypass the new capability? |
| People | Do people have the skills, time and reason to change behavior? |
| Market | Is a customer or competitor force pushing the other way? |
| Measurement | Are we measuring the right thing, the right way? |
| Systems | Do tools and data support the new way of working? |
The measurement row is worth taking seriously rather than treating as a formality; a gap that is really a definition problem is covered in Writing KPIs for the Hoshin Kanri X-Matrix: Definitions, Baselines, Sources.
5 whys: drill into the likeliest cause
Associated with Toyota’s production system, 5 whys asks why repeatedly until the answer is something that can be changed. Five is a guide, not a rule. Stop when the answer points to a condition you control; go further if it still describes a symptom.
Every cause should be tested against data before a countermeasure is chosen. A plausible cause that the data doesn’t support is just a better-told guess.
A worked example: the services gap
Here is a hypothetical root-cause analysis of the services gap, from Pareto to the fourth why:
| Step | Finding |
|---|---|
| Pareto | Four of six new territories account for 90% of the attach-rate shortfall |
| Fishbone | Candidates: technician skills (people), contract terms (policy), call routing (process), competitor pricing (market) |
| Data test | Two territories with good attach rates had changed routing locally; the four lagging ones hadn’t |
| Why 1 | Attach rate low: few customer visits from the new centers |
| Why 2 | Few visits: service calls still routed to head office |
| Why 3 | Routing unchanged: the rules sit in the call-center system, which wasn’t part of the priority |
| Why 4 | Not part of the priority: the priority was defined as opening centers, not changing how work flows |
The fourth why reaches the plan itself, which is where a hoshin A3 should end up when the cause is structural. The countermeasure changes routing; the plan-change section changes how the priority is measured. See How to Write a Hoshin Kanri A3, Section by Section.
These are thinking tools, and they work on a whiteboard. They work better where their output can be referenced.
What a wrong cause costs
The three tools are free. What they are protecting against is the price of acting on the wrong cause, and the worked example puts a number on it: retraining technicians would have been a reasonable response to the fishbone’s people branch, and it would have consumed a quarter without moving the attach rate, because the calls were never reaching the centers in the first place.
That is the real cost line. Not the hour spent drawing a Pareto, but the quarter spent on a countermeasure that answered the wrong branch. The sequence in this article exists to make that mistake expensive to reach rather than easy.
Holding the output is where tooling comes in. Among published alternatives, OnStrategy lists $200 per month for unlimited users. i-nexus publishes a free Starter tier for up to five users and $28 per user per month at its Standard tier. Seats matter because the data test in step three usually needs the people who own the territories, not only the people in the review.
Profit.co publishes two plans, Essentials and Enterprise, quoting against modules and scale rather than a public seat rate. Hoshin Kanri sits in Essentials alongside OKRs and Goals, Balanced Scorecard and Strategy Roadmap, so a cause recorded in an A3 stays attached to the correlation it questions. What drives the cost of hoshin kanri software lists the rest to total, and the 30-day free trial covers a full flag-to-countermeasure cycle.
Root-cause tools in Profit.co
Profit.co’s countermeasure A3 includes both main methods as editors. The Ishikawa editor holds a cause tree under each category, up to three levels below it, with categories set per template, so the strategy-adapted categories above can be your organization’s default. The 5 Whys editor can start from the problem statement or from any cause in any Ishikawa in the A3, showing its path.
Causes are records, not drawings. The countermeasure table references them by ID, so every countermeasure shows which cause it answers. An AI assistant can propose causes or challenge a chain of whys, but every proposal waits for the owner to apply it, stays tagged as AI-suggested, and only the owner can mark a root cause. More on the Hoshin Kanri software page.
Free Product Demo
Find where your gaps really are
A 30-minute walkthrough, tailored to your team.
Book a free demo
What happens in the call
How your teams set goals, track progress and review results.
Strategy, performance, projects and engagement on one platform, with AI.
A practical path to align teams, execute faster and drive results.
Questions this article answers
A Pareto chart, to find where the gap is concentrated, followed by a fishbone diagram to list causes there and 5 whys to drill into the likeliest one.
Policy, process, people, market, measurement and systems tend to fit strategy gaps better than the classic manufacturing categories.
Five is a guide. Stop when the answer points to a condition you can change, and test it against data.
Because without knowing where the gap is concentrated, the first why is a guess and everything after it elaborates that guess. A Pareto chart narrows the question first.
Compare the places where the gap appears with the places where it does not. In the worked example, the two territories performing well had changed call routing; the four lagging ones had not.
That the cause is structural. It is where a hoshin A3 should end up in that case, and the answer is a plan change, such as how the priority is defined or measured, rather than only a countermeasure.