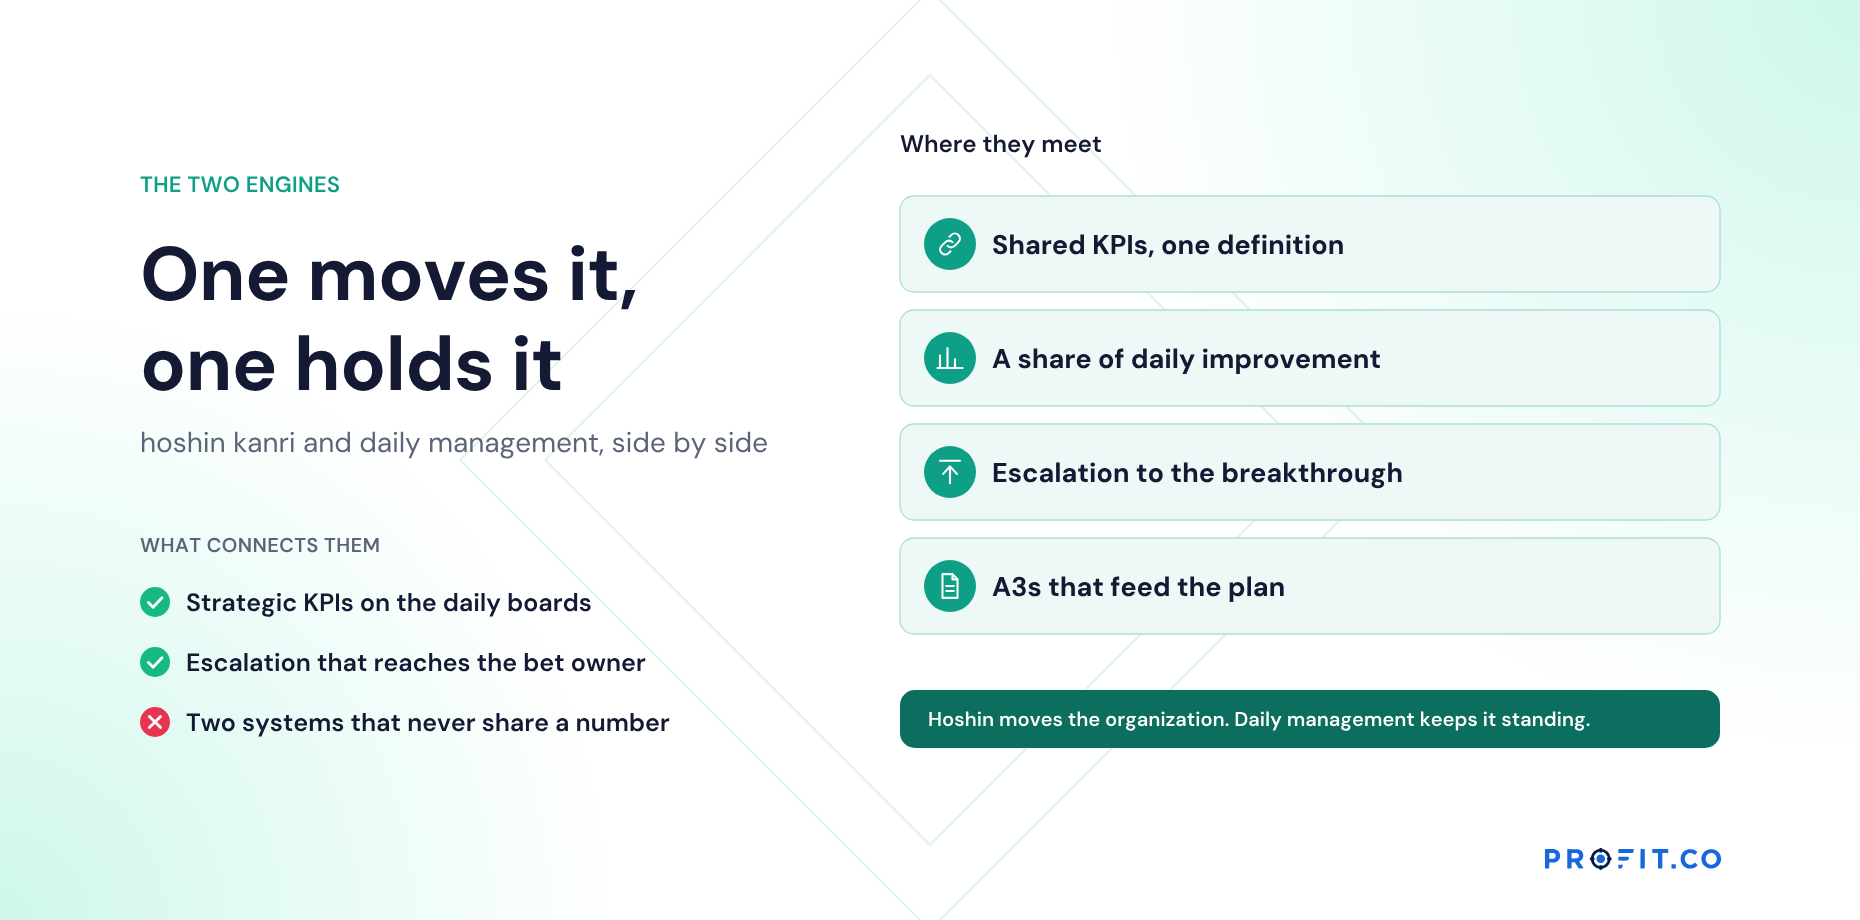













In many organizations the operational excellence office runs the hoshin process, and in many others the two are separate functions that rarely talk. Either way, the same tension appears: OpEx is measured on savings and activity, strategy on a few breakthrough results, and the two can drift apart.
In this guide
Key Takeaways
- →OpEx improves how work is done; strategy deployment changes what gets achieved.
- →They share A3, PDCA, KPIs and visual management, and often the same people.
- →The drift starts with measurement: savings are the easiest value to count.
- →Each ends up doing good work, and neither helps the other.
- →Shared KPIs, an agreed share of capacity, one review, and OpEx owning the method.
- →The joined-up line only exists when someone puts both reports side by side.
Two purposes, shared tools
The confusion is understandable, because almost everything visible about the two functions looks the same.
Look at the last row. Identical tools, often identical people, and two completely different definitions of a good year. That overlap is what makes the drift so hard to see from inside either function.
| Aspect | Operational excellence | Strategy deployment |
|---|---|---|
| Purpose | Improve how work is done | Change what the organization achieves |
| Typical measures | Savings, kaizens completed, belts certified, process metrics | A few strategic KPIs against trajectory |
| Owner | OpEx or CI office | Strategy office, executive team |
| Shared tools | A3, PDCA, KPIs, visual management | A3, PDCA, KPIs, catchball, X-matrix |
How they drift apart
The drift usually starts with measurement. OpEx programs need to show value, and savings are the easiest value to count. Over time the OpEx report becomes a savings report: so many projects, so much saved. The strategic KPIs appear in a different report, owned by different people.
Eventually OpEx is a cost program that happens to use lean tools, and strategy is a planning exercise that happens to mention lean. Each is doing good work. Neither is helping the other.
When OpEx reports savings and strategy reports breakthroughs, nobody is reporting whether one is causing the other.
Keeping them connected
- Shared KPIs. The strategic KPIs appear in the OpEx report, with improvement work linked to them.
- A share of OpEx capacity on strategy, agreed in planning and visible through the year.
- One review. OpEx and strategy reviewed together at least quarterly.
- OpEx owns the method, not just the projects: running catchball, A3 coaching and the review cadence for the strategy.
The fourth is the one that changes the relationship rather than the reporting. An OpEx office that owns catchball and A3 coaching for the hoshin plan is no longer a supplier of savings to a strategy it had no part in; it is the function that runs the method the strategy depends on.
A worked example: two reports, one quarter
Here is a hypothetical quarter reported twice, once in an OpEx report and once in a strategy report:
| OpEx report | Strategy report |
|---|---|
| 64 kaizen events completed | On-time delivery 89% against 92% plan |
| Savings 1.4 million | Services share 0.6 points behind trajectory |
| 12 Green Belts certified | Scope 3 share on plan |
| Joined up: | Of the 64 events, 7 targeted on-time delivery; all 7 moved it. Recommendation: point 20 of next quarter’s events at delivery |
The last row only exists when someone puts the two reports side by side. It is the most useful line in either.
Read the arithmetic in it. Seven events out of sixty-four moved the KPI the plan was behind on, and all seven worked. That is not a weak result, it is an unexploited one: the organization has demonstrated a reliable way to move its most behind-trajectory measure and is spending 89% of its improvement capacity elsewhere.
What two good reports cost
Both reports in the example are honest and both describe competent work. 1.4 million in validated savings is real money and 64 events is a healthy quarter. The cost is entirely in what neither report can say, which is whether the first caused the second. Because nobody asks, the recommendation in the joined-up row never gets made, and next quarter looks much like this one.
Scale that forward. Seven events moved on-time delivery and twenty would have been available; the difference between those two numbers, compounded across four quarters and several strategic KPIs, is the entire gap between a program that reports savings and one that delivers a breakthrough. No extra headcount, no extra events, no new tools. The missing item is a single line that requires both reports to be in the same place.
Among published alternatives for producing that line, OnStrategy lists $200 per month for unlimited users and i-nexus publishes a free Starter tier for up to five users with $28 per user per month at its Standard tier. The capability question is narrow and worth isolating in a demo: can the system show improvement events grouped by the strategic KPI each targeted, beside that KPI’s movement, without an export? That one view is the joined-up row.
Profit.co publishes two plans, Essentials and Enterprise, quoting against modules and scale rather than a public seat rate, which is the usual arrangement when an OpEx office is small and the people raising improvements are many. Hoshin Kanri, OKRs and Goals and Balanced Scorecard sit in Essentials, and the 30-day free trial is enough to load last quarter’s events and KPIs and produce the joined-up row from your own numbers.
OpEx and strategy on one model
In Profit.co, OpEx and strategy can run on one model: improvement work linked to the strategic KPIs it should move, huddles at every cadence on the same KPIs, and the OpEx team running catchball and A3 review for the hoshin plan. See the lean strategy software page.
One model rather than two reports has a specific consequence for the OpEx office:
- Its report gains a column it cannot write by itself. Effort by strategic KPI beside that KPI’s movement is a by-product of the records, not an analysis someone has to commission.
- Its recommendation has standing. Pointing twenty events at delivery is an evidence-backed proposal rather than an OpEx opinion about strategy.
- Owning the method is practical. Catchball, A3 coaching and the review cadence run on the same records the improvement work already sits in.
How to set the share of capacity the second rule asks for is in Steering Improvement Capacity Toward Breakthroughs, Without Killing Kaizen, and the same question for formal belt projects is in Aligning Lean Six Sigma Projects With Strategy.
Free Product Demo
Put your OpEx and strategy reports side by side
A 30-minute walkthrough, tailored to your team.
Book a free demo
What happens in the call
How your teams set goals, track progress and review results.
Strategy, performance, projects and engagement on one platform, with AI.
A practical path to align teams, execute faster and drive results.
Questions this article answers
Operational excellence improves how work is done. Strategy deployment changes what the organization achieves through a few breakthrough objectives.
Often it does, and it can work well if OpEx owns the method and is measured on strategic KPIs as well as savings.
Because they are usually measured on savings and activity, which are easy to count, rather than on whether they move the strategic KPIs.
No. It is true and worth having. The problem is that it cannot say whether the savings caused anything the strategy was trying to achieve.
Running catchball, A3 coaching and the review cadence for the strategy, rather than only delivering projects into it. That makes OpEx part of how the strategy works.