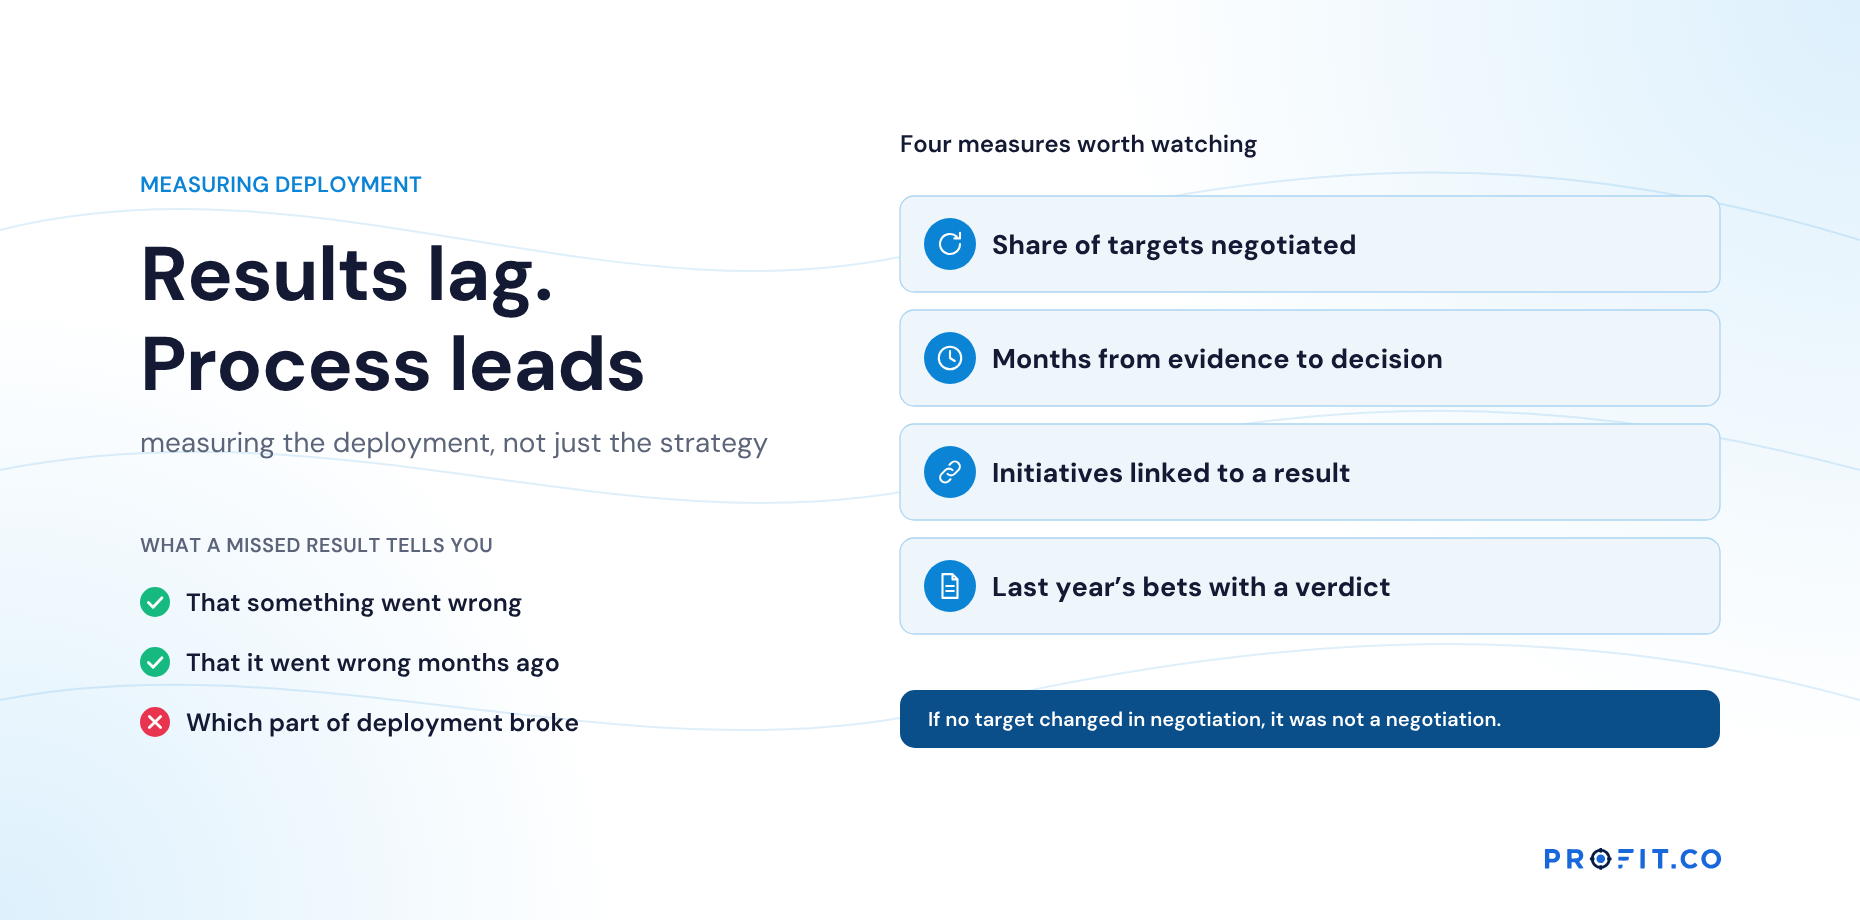

Organizations measure their strategy in detail and their strategy deployment not at all. Yet the process can be measured: whether targets are really negotiated, whether evidence arrives in time, whether decisions follow. A few process measures tell you where deployment is breaking.
In this guide
Key Takeaways
- →Strategic results are lagging indicators of deployment. Process measures are the leading ones.
- →Down: targets negotiated, targets changed in negotiation, additive targets that add up.
- →Up: check-ins on time, initiatives linked to a result with a lag, months from evidence to decision.
- →Across: dependencies agreed by both sides. Learning: last year’s bets with a verdict.
- →If no target changed during negotiation, it wasn’t a negotiation.
- →There are no universal benchmarks. Track direction over time instead.
Why measure the process
Strategic results are lagging indicators of deployment. By the time a result misses, the deployment failure behind it, a target nobody owned, a dependency nobody agreed, an exception nobody saw, happened months earlier. Process measures are the leading indicators.
Each of the three directions leaves its own trace, which is what makes this measurable at all rather than a matter of opinion.
Eight measures
| Direction | Measure | What it reveals |
|---|---|---|
| Down | Share of targets negotiated, not just assigned | Whether ownership exists |
| Down | Share of targets changed during negotiation | Whether negotiation is real: zero suggests announcement |
| Down | Additive targets that add up at agreement | Whether gaps are found early |
| Up | Check-ins on time | Whether evidence is current |
| Up | Initiatives linked to a result, with an expected lag | Whether effect can be tested |
| Up | Months from evidence to decision | Decision latency |
| Across | Dependencies agreed by both sides | Whether shared results have shared commitments |
| Learning | Share of last year’s bets with a recorded verdict | Whether the organization learns |
If no target changed during negotiation, it wasn’t a negotiation. If no bet was judged at year end, nothing was learned.
What good looks like
There are no universal benchmarks, and inventing them would be misleading. Look for direction rather than a number: negotiated targets rising towards all of them; some, but not most, targets changing in negotiation; check-ins consistently on time; decision latency falling from quarters to a single month; and every major bet carrying a verdict at year end.
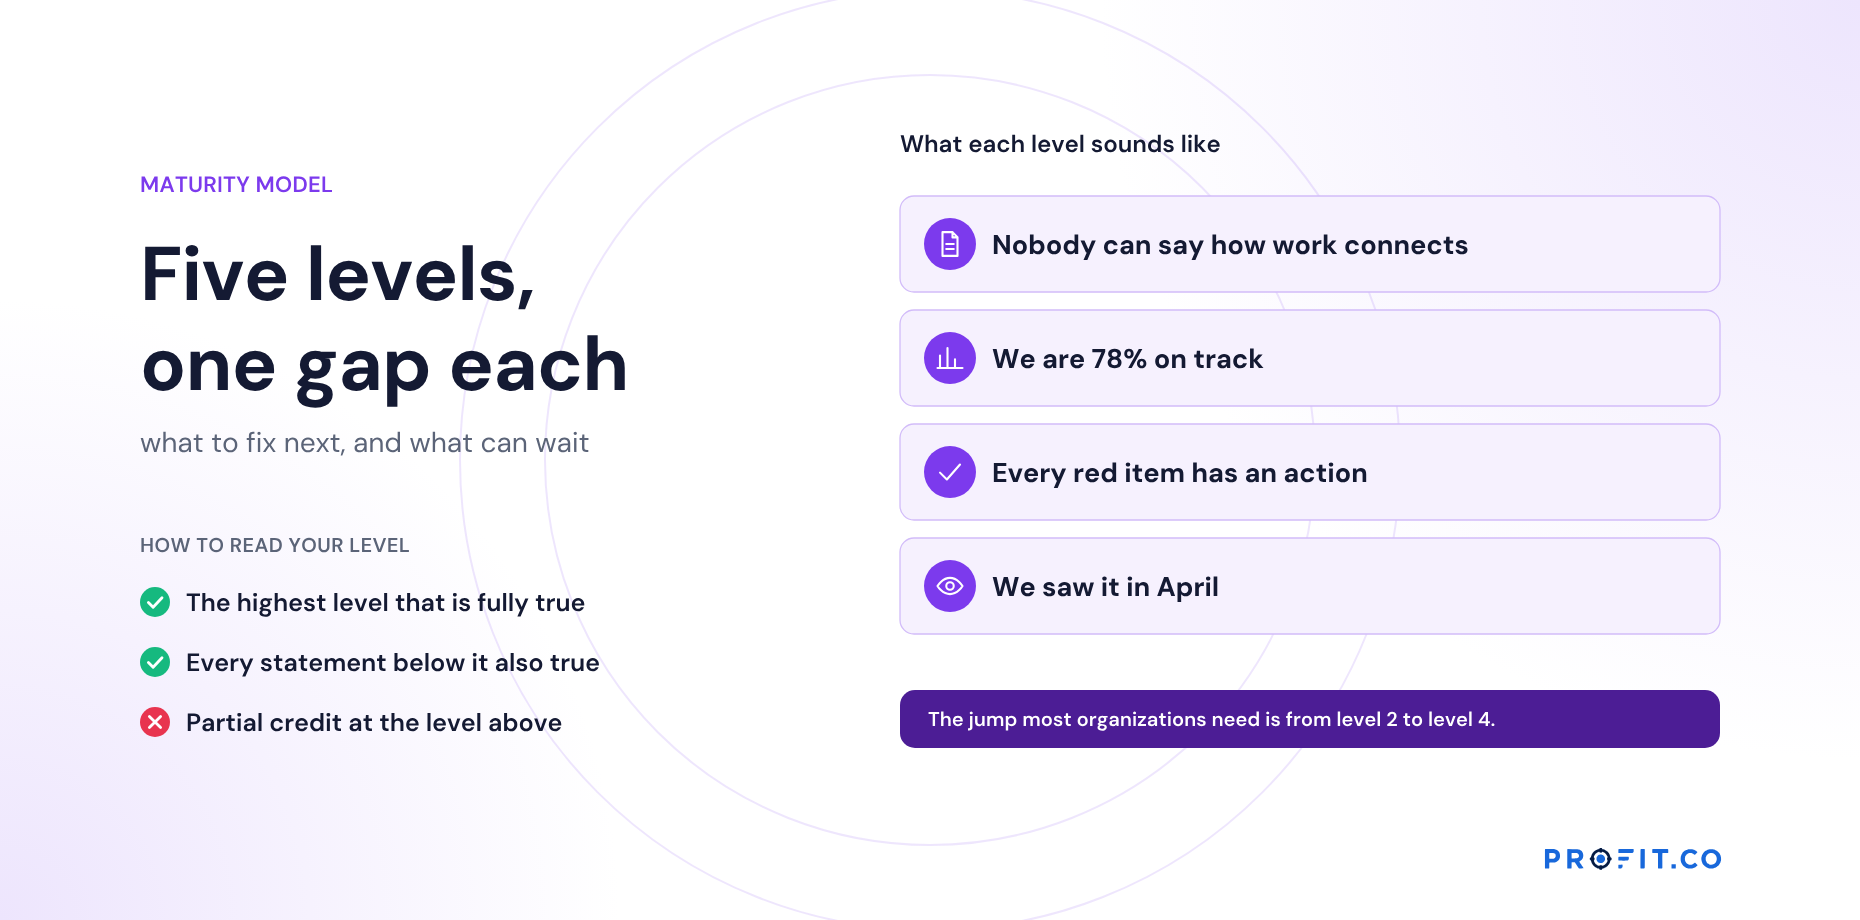
A different way to read the same evidence, as five stages rather than eight measures, is in A Strategy Deployment Maturity Model: Five Levels.
A worked example: a deployment scorecard
One organization’s deployment scorecard, two years apart. Read the direction column rather than the absolute numbers.
| Measure | Last year | This year | Direction |
|---|---|---|---|
| Targets negotiated | 30% | 85% | Improving |
| Targets changed in negotiation | 0% | 25% | Healthy |
| Check-ins on time | 55% | 88% | Improving |
| Initiatives linked to a result with lag | 20% | 70% | Improving |
| Months from evidence to decision | 5 | 1.5 | Improving |
| Dependencies agreed by both sides | Not tracked | 12 of 15 | New |
| Last year’s bets with a verdict | None | 9 of 11 | Improving |
Row two is the one to dwell on. Going from no target changing to a quarter of them changing is the difference between announcing and negotiating.
What not measuring the process costs
An organization that measures only results finds out about a deployment failure two or three quarters after it happened, in the form of a number that missed. It then debates the number rather than the process that produced it, and the same failure repeats the following year because nothing about it was visible enough to fix.
Among published alternatives, OnStrategy lists $200 per month for unlimited users. i-nexus publishes a free Starter tier for up to five users and $28 per user per month at its Standard tier. The question to put to either is whether the eight measures above can be read off the system’s own records, or whether someone has to reconstruct them.
Profit.co publishes two plans, Essentials and Enterprise, quoting against modules and scale rather than a public seat rate. Catchball records, check-in dates, correlation lags and strength histories sit in Essentials with OKRs and Goals, Balanced Scorecard, Hoshin Kanri and Strategy Roadmap, so the scorecard above is a report rather than a research project. Building the Business Case for Hoshin Kanri Software covers how to make that argument internally.
Where the numbers come from
Most of these come straight from the deployment system’s own records. In Profit.co, catchball sessions record proposals, changes and agreement; check-ins carry dates; correlations carry expected lags and strength histories; and countermeasure A3s close with verdicts. See the strategy deployment software page.
Which means each measure has an obvious source:
- Targets negotiated and changed come from the catchball change table, where the proposal and every counter are kept.
- Check-ins on time and decision latency come from dates the system already records, not from a survey.
- Bets with a verdict come from closed A3s and correlation strength histories, which is also the input the next planning cycle needs.
That last one feeds the annual reflection described in Hansei: Reviewing Last Year’s X-Matrix Before Planning the Next.
Free Product Demo
Score your deployment process
A 30-minute walkthrough, tailored to your team.
Book a free demo
What happens in the call
How your teams set goals, track progress and review results.
Strategy, performance, projects and engagement on one platform, with AI.
A practical path to align teams, execute faster and drive results.
Questions this article answers
With process measures across its three directions, such as targets negotiated, check-in timeliness, initiatives linked to results, time from evidence to decision, dependencies agreed and bets judged at year end.
Results lag deployment failures by months. Process measures show where deployment is breaking while there is still time to act.
No reliable universal benchmarks exist. Track the direction of each measure over time instead.
That it was an announcement rather than a negotiation. Some movement, though not on most targets, is the healthy pattern.
The time between evidence arriving and a decision being taken on it. Falling from quarters to a single month is the direction to look for.