
Upward strategy reporting is usually a progress report: initiatives, percentages, colors. Progress matters, but it answers the wrong question for leadership. They need to know whether the strategy is working, which takes evidence, not just progress.
In this guide
Key Takeaways
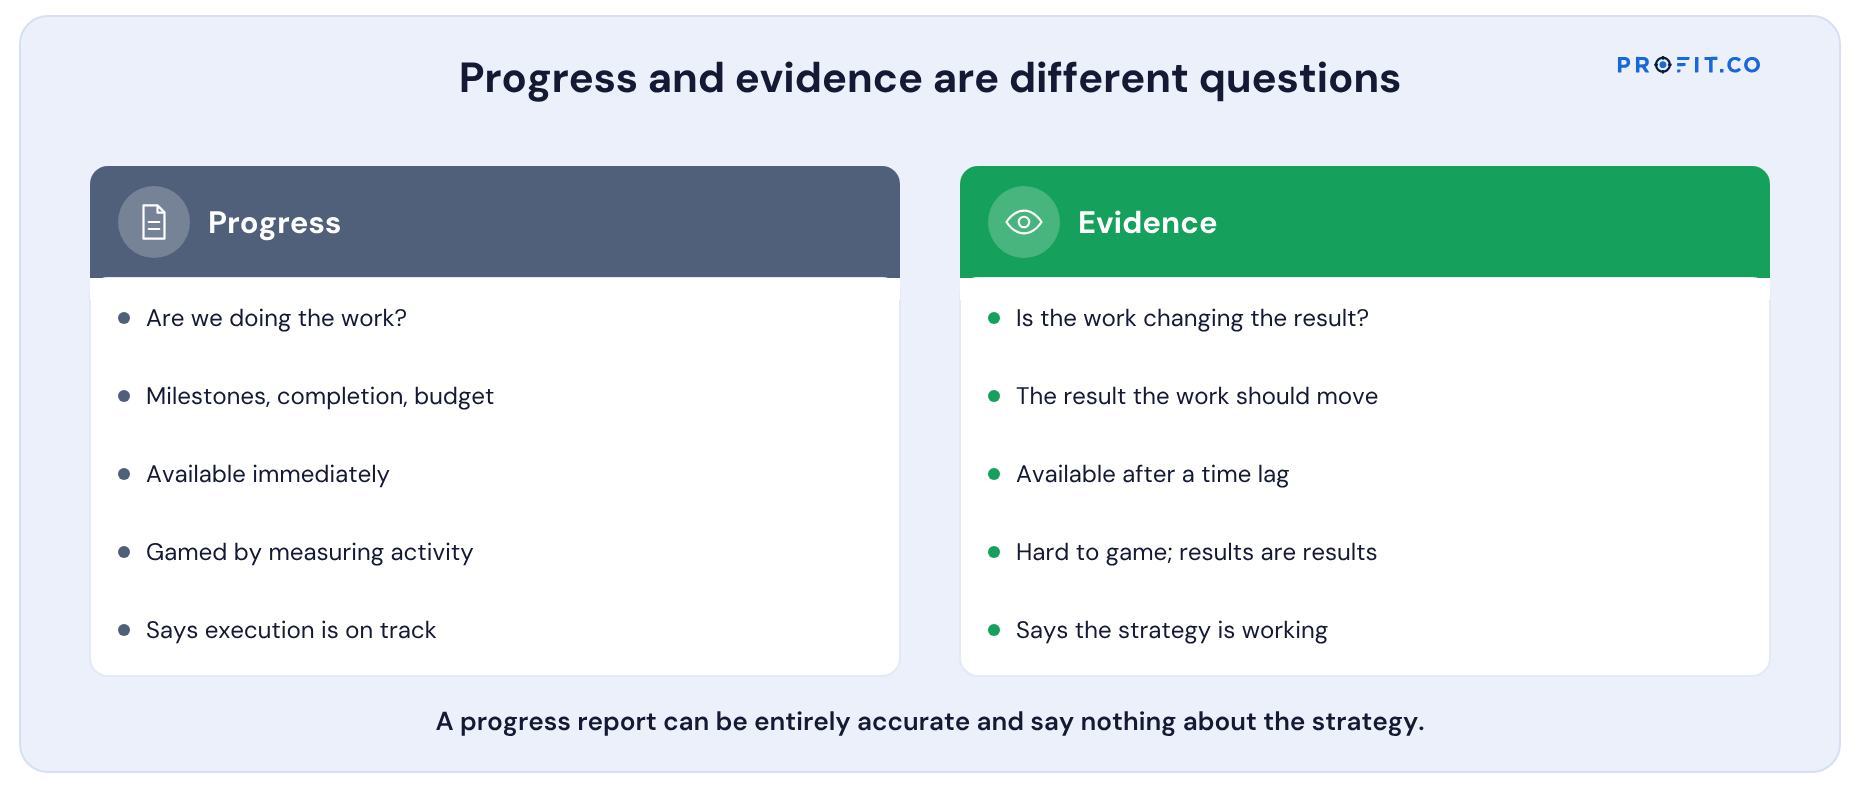
- →Progress asks whether we are doing the work. Evidence asks whether the work is changing the result.
- →Progress is available immediately and easy to game. Evidence arrives after a lag and is hard to game.
- →Lead the report with decisions needed, then exceptions, then the few strategic results.
- →Include what is not yet judged, so nobody over-reacts to a result still inside its lag.
- →Cut averaged progress, green items, activity metrics dressed as results, and early judgments.
- →Leading with decisions makes the meeting about choices. Leading with initiatives makes it about status.
Two different questions
Both are reasonable things to report. Only one of them tells leadership whether the strategy is working.
| Progress | Evidence | |
|---|---|---|
| Question | Are we doing the work? | Is the work changing the result? |
| Measured by | Milestones, completion, budget | The results each piece of work was chosen to move |
| Available | Immediately | After a time lag |
| Can be gamed by | Measuring activity | Hard to game; results are results |
| Tells leadership | Whether execution is on track | Whether the strategy is working |
A progress report can be entirely accurate and tell leadership nothing about whether the strategy is working.
What leadership should see
| Section | Contents |
|---|---|
| Decisions needed | Items that need a leadership decision this cycle, with options |
| Exceptions | Work progressing without moving its result; delivery problems; persistent misses |
| Strategic results | The few results the strategy depends on, against their trajectory |
| Not yet judged | Results still inside their expected lag, so nobody over-reacts |
| Everything else | Available on request; not in the report |
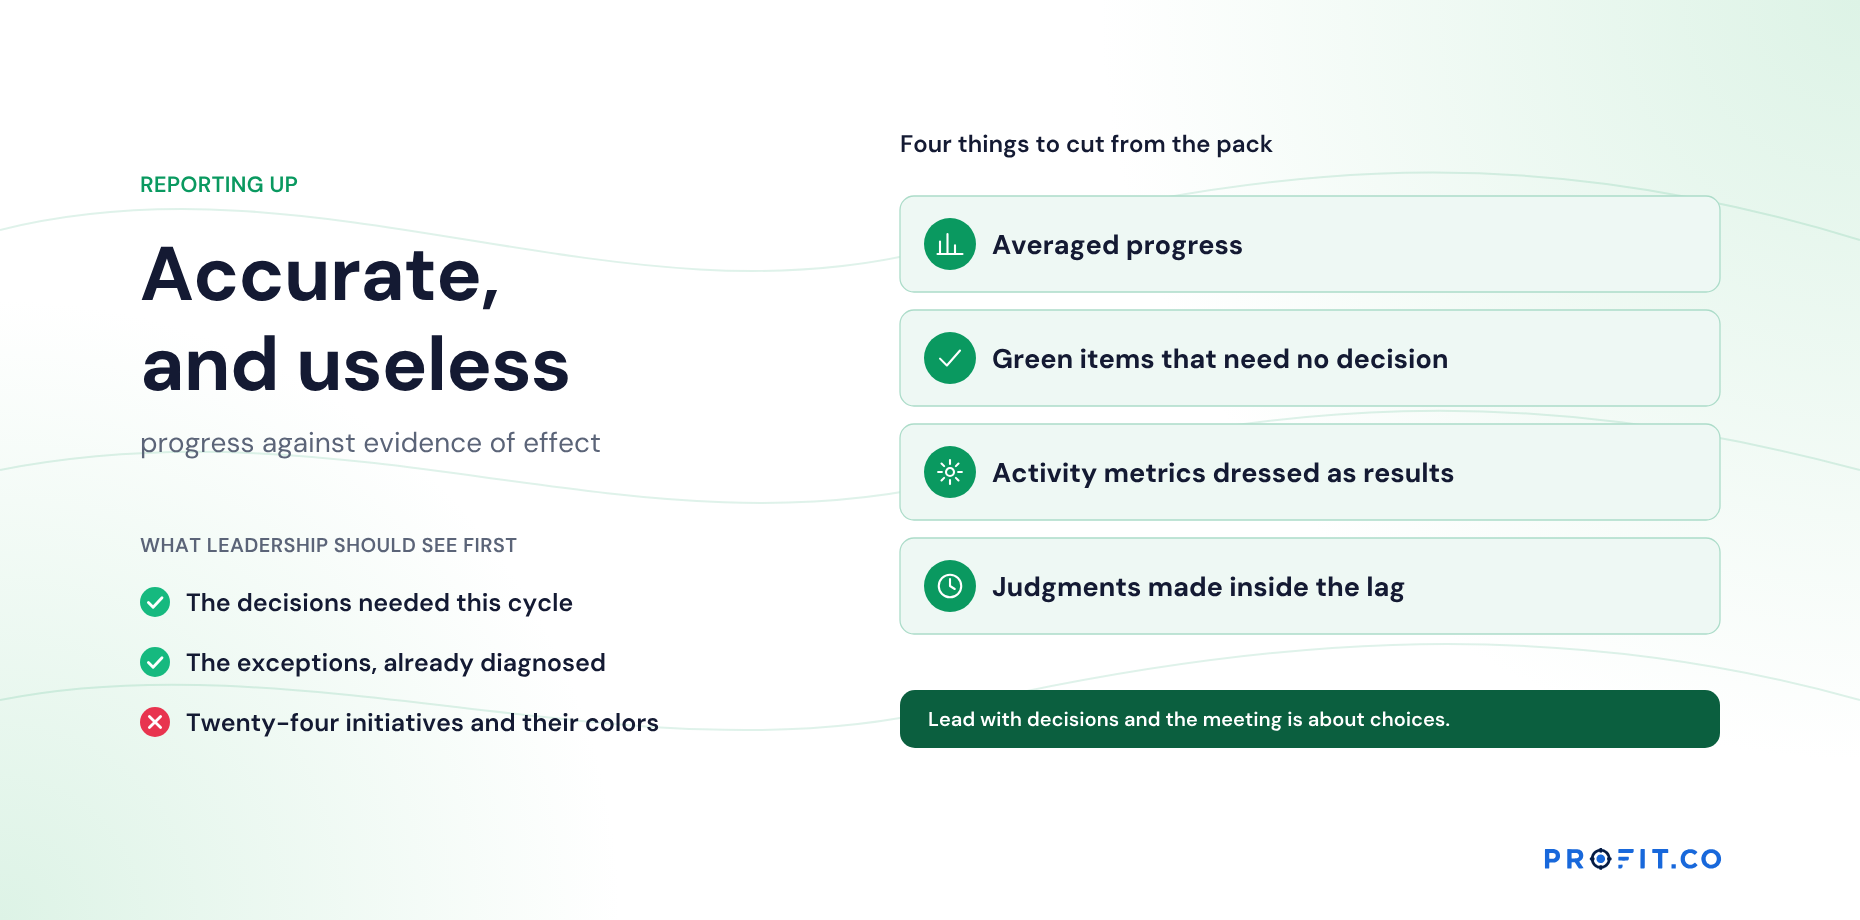
The order matters. Leading with decisions makes the meeting about choices. Leading with a list of initiatives makes it about status.
The meeting this report feeds, and what it should decide, is in The Quarterly Strategy Review: Meetings That Change Decisions.
What to cut
- Averaged progress. It hides failing bets inside healthy ones. See The Roll-Up Problem: Why Averaged Progress Hides a Failing Strategy.
- Green items. Work on plan whose results are moving needs no time.
- Activity metrics presented as results.
- Judgments made too early. A result can’t be red before it could have moved.
A worked example: the same month, two reports
Here is a hypothetical month with the same data written two ways. Read the two columns against each other rather than down:
The same month, the same data, written two ways. Read the two columns against each other rather than down.
| Progress report | Evidence report |
|---|---|
| 24 initiatives; 19 green, 4 amber, 1 red | Decision needed: release next funding for the service network? Recommend yes, with a routing fix |
| Overall program progress 71% | Exception: service network 85% complete, attach rate flat for four months |
| Service network: green | Exception: contract model two months late; one region’s target depends on it |
| Pricing: amber | Strategic results: margin on trajectory; services share 0.8 points behind |
| … 20 more rows | Not yet judged: emissions program, lag window closes in Q3 |
The left column took the strategy office two weeks to build and led to a discussion of the one red item. The right column names the decision that matters, which the left column marked green.
What a progress report costs to produce
Two weeks of a strategy office’s month, every month, is the usual figure for the left-hand column. It is the most expensive document many organizations produce, and the one least likely to change a decision. The right-hand column is shorter, arrives earlier and costs less, because the system assembles it rather than a person.
Among published alternatives, OnStrategy lists $200 per month for unlimited users. i-nexus publishes a free Starter tier for up to five users and $28 per user per month at its Standard tier. Ask either one what happens to a program that is 100% complete with a flat result: whether it appears on an exception list on its own, or whether somebody has to notice.
Profit.co publishes two plans, Essentials and Enterprise, quoting against modules and scale rather than a public seat rate. The exception queue and expected lags sit in Essentials with OKRs and Goals, Balanced Scorecard, Hoshin Kanri and Strategy Roadmap, so the evidence column assembles itself from check-ins rather than from a collection round. Building the Business Case for Hoshin Kanri Software sets out how to total the saving honestly.
Evidence in Profit.co
In Profit.co, each correlation between work and results carries its expected lag, the exception queue flags work that isn’t moving results and initiatives with delivery problems, and a four-quadrant chart on every objective shows progress against effect. See the strategy deployment software page.
That is the evidence column, section by section:
- Decisions needed come from the exception queue, each one already diagnosed by its owner.
- Not yet judged comes from the expected lag, so a result inside its window is held back rather than marked red.
- Strategic results against trajectory come from the objectives themselves, not from a rebuilt spreadsheet.
The specific pattern the exception queue exists to catch is described in Outcome Lag: When Priorities Are Green and KPIs Don’t Move.
Free Product Demo
Turn your progress report into an evidence report
A 30-minute walkthrough, tailored to your team.
Book a free demo
What happens in the call
How your teams set goals, track progress and review results.
Strategy, performance, projects and engagement on one platform, with AI.
A practical path to align teams, execute faster and drive results.
Questions this article answers
Progress shows how much of the work is done. Evidence shows whether that work is moving the results it was chosen to move.
Decisions needed, exceptions, the few strategic results against trajectory, and items not yet judged because their results haven’t had time to move.
Averages combine working and failing bets, so a report can show healthy progress while the most important bet is not moving its result.
So nobody over-reacts. A result still inside its expected lag has not had time to respond, and marking it red invites a change that isn’t warranted yet.
No. Work that is on plan and whose results are moving needs no leadership time. Keep it available on request rather than in the report.