

The Adoption Dashboard gives People and Culture leaders on-demand visibility into how many employees have created goals, added competency activities, and progressed through assessments across the organization. Date-based filters let leaders scope that view to a specific review cycle or period instead of only seeing overall totals.
Table of Contents
What is the Adoption Dashboard?
The Adoption Dashboard is a tab inside the Performance Cockpit dashboard, positioned alongside the existing Reviews and Development Plans tabs. It contains three widgets: Goals Adoption, Competency Activities Adoption, and Assessment Progress, each scoped to the reporting period you select.
Every widget includes a Table/Chart view toggle, a Download button, an Expand button, and an options menu. The dashboard is built on the same adoption-widget pattern used in the OKR Cockpit, and it's designed for People and Culture leaders who need organization-wide adoption visibility.
| Widget | What It Shows |
|---|---|
| Goals Adoption | Percentage of employees who have created goals, by department or business unit |
| Competency Activities Adoption | Percentage of employees who have added competency (principle) activities, by department |
| Assessment Progress | Distribution of employees across assessment stages: Self-Assessment Pending, Manager Assessment Pending, Sign-off Pending, Completed |
Note
Assessment Progress uses the Assessment Stage and Review Cycle / TAC filters instead of a Created Date filter. The Goal Created Date and Activity Created Date filters apply only to the Goals Adoption and Competency Activities Adoption widgets.
Why the Adoption Dashboard Matters
| Benefit | What It Solves |
|---|---|
| Reporting scoped to new activity | Leaders previously could only see whether an employee had any goal or activity at all, with no way to isolate what was created in a specific period. Date-based filters now count only items created within the selected cycle or period. |
| On-demand adoption data | Leaders previously had to request a manual back-end data pull to answer adoption questions. The Adoption tab now answers those questions the moment it's opened. |
| Location-level self-service | Site-level P&C managers previously depended on a central team to segment adoption data by location. Location filtering and the By Location toggle now let them pull their own site's numbers directly. |
| Consolidated metrics | Goals adoption, competency activity adoption, and assessment progress previously lived in separate reports or manual pivot tables. All three now sit in one Cockpit tab. |
How It Works
Tip
Use the global period navigator to scope Goals Adoption, Competency Activities Adoption, and Assessment Progress at once, instead of setting the period on each widget separately.
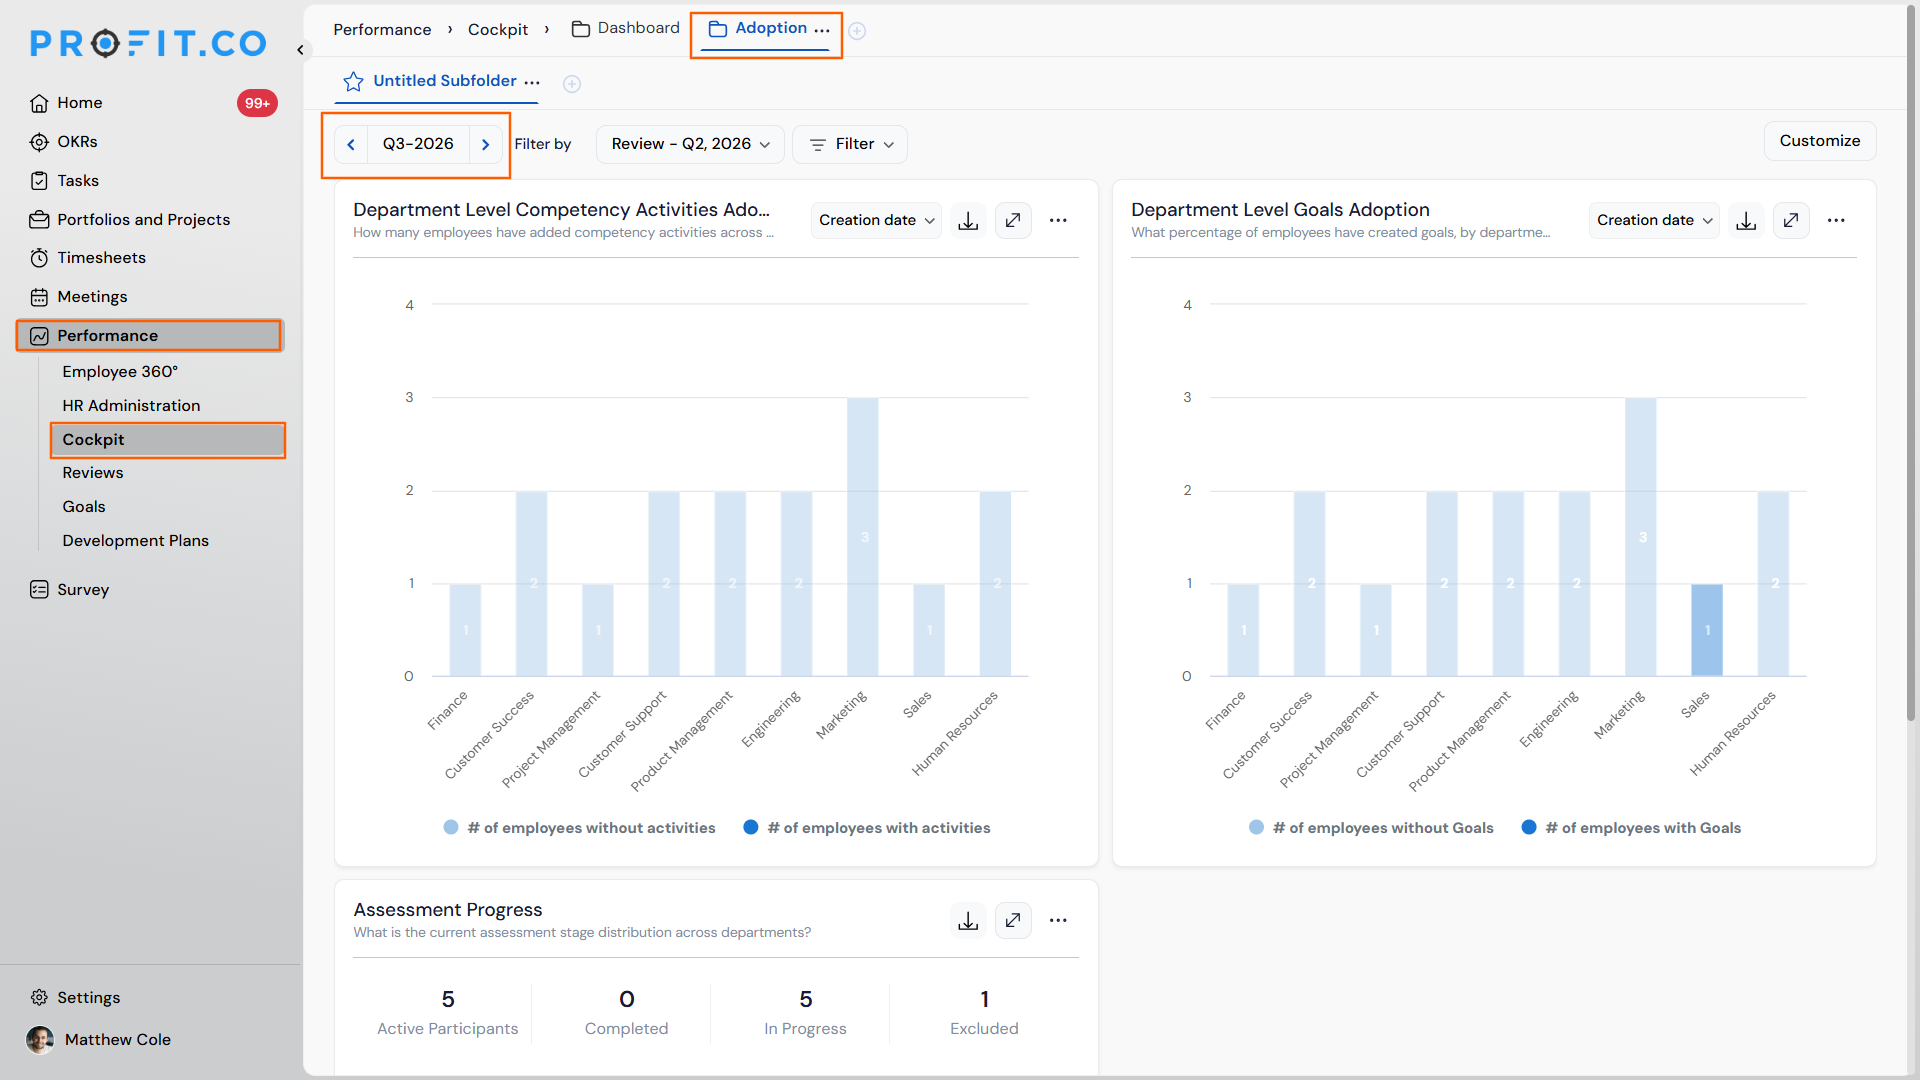
Access the Adoption Dashboard
Step 1
- Navigate to Performance → Cockpit → Dashboard → Adoption tab.
- Use the global period navigator (Q1-2026, Q2-2026, etc.) to scope all three widgets to the selected period.
Method 1: Review Goals Adoption
Step 1
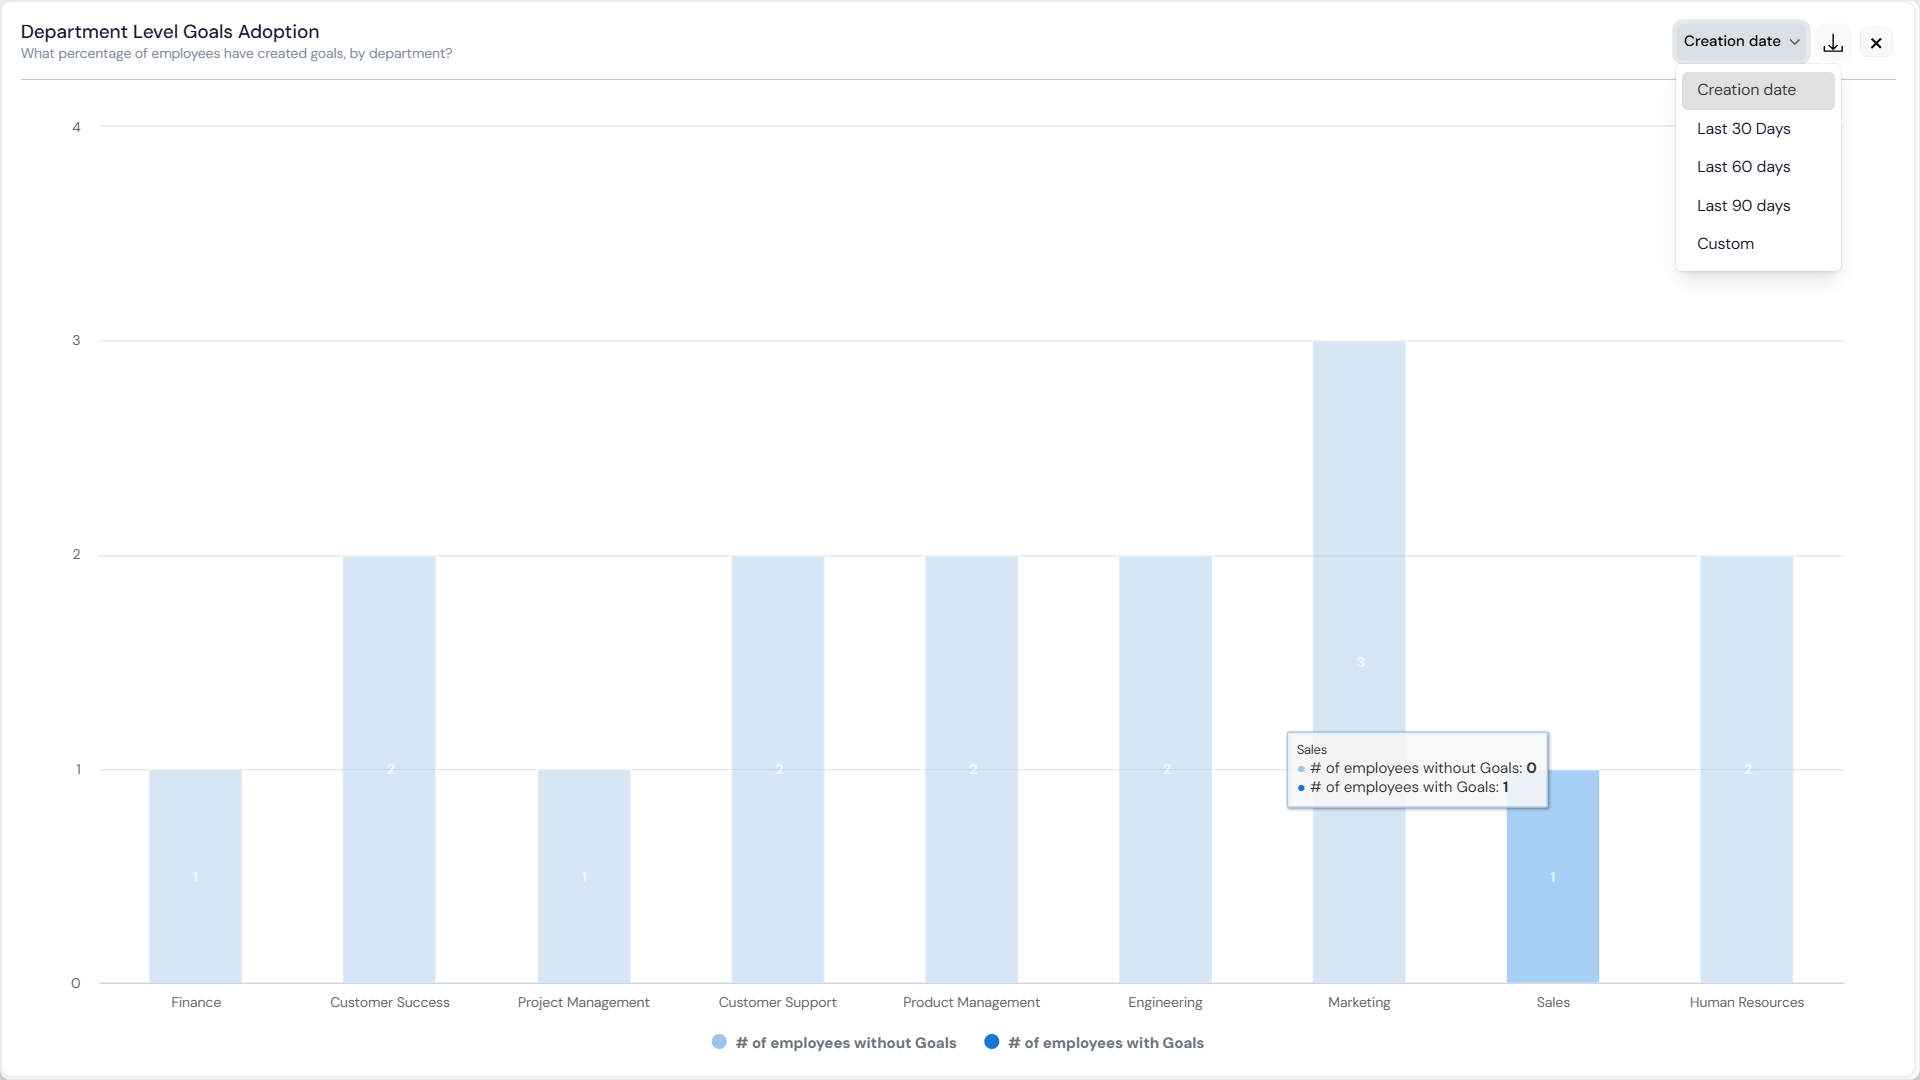
- Review the summary cards: Total employees, With goals, Without goals.
- In Chart view, read the stacked bar: orange segments show employees without goals, teal segments show employees with goals.
- Apply the Goal Created Date filter (All dates, This quarter, or Custom range) to count only goals created in the period.
- Toggle to Table view for a department-by-department adoption rate.
- Click a department bar or table row to drill down.
Method 2: Review Competency Activities Adoption
Step 1
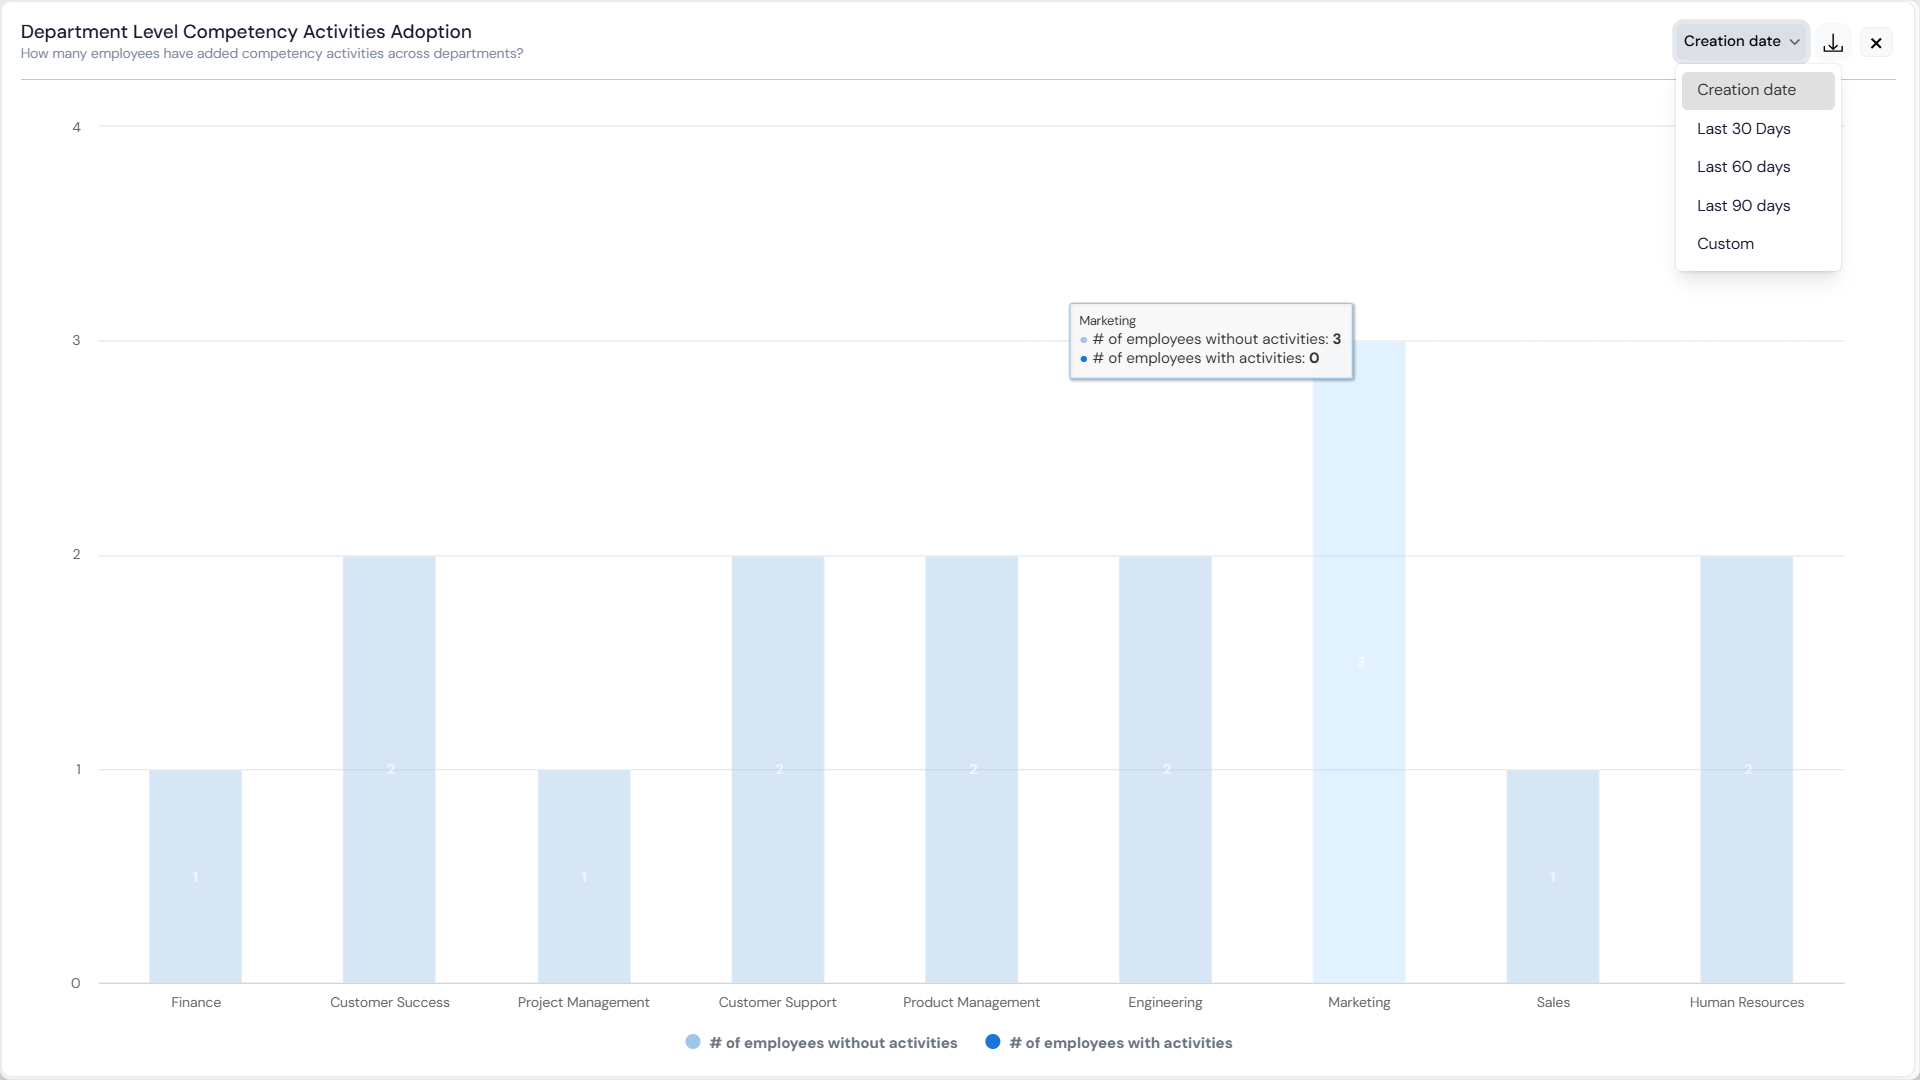
- Follow the same summary cards, Chart view, and Table view layout as Goals Adoption.
- Reference the four activity status stages: Not Started, Initiated, In Progress, and Completed.
- Apply the Activity Created Date filter to count only activities created in the period.
- Click a department bar or table row to drill down.
Method 3: Review Assessment Progress
Step 1
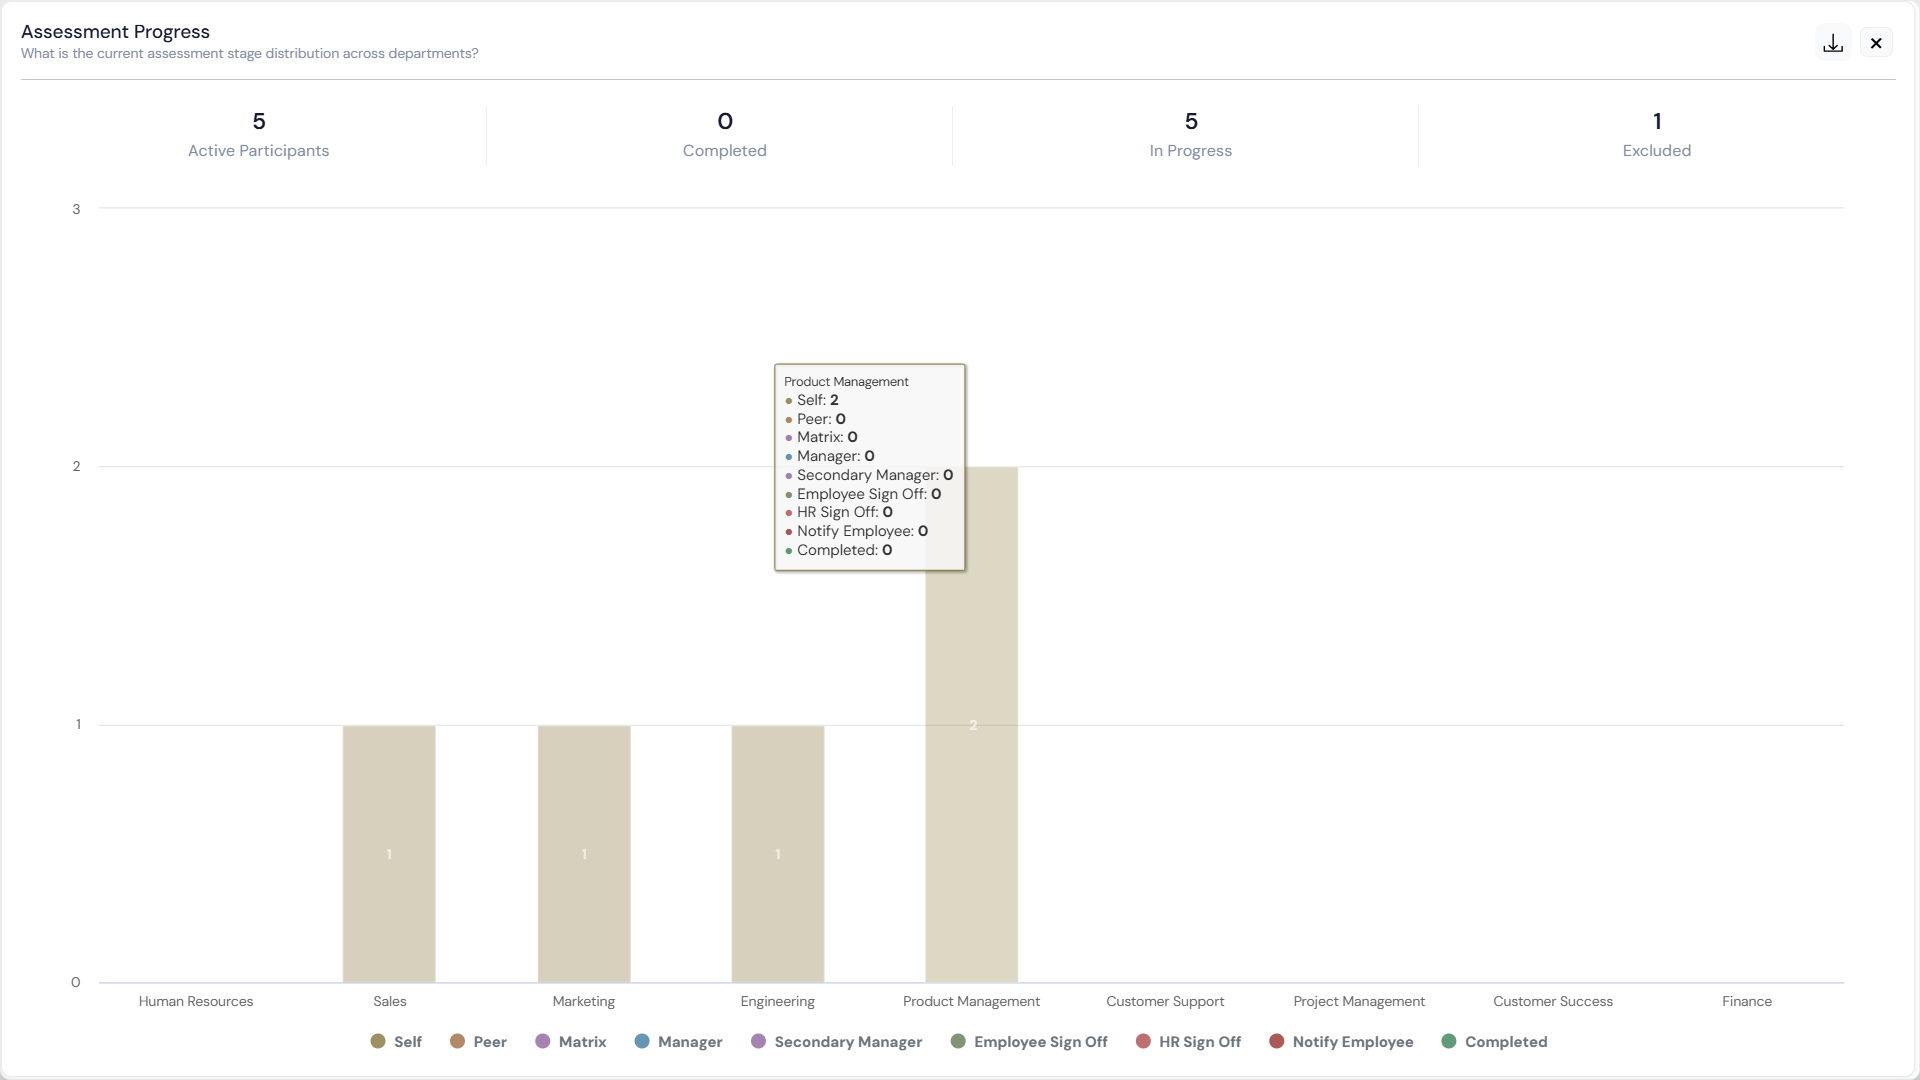
- Review the four summary cards: Self-Assessment Pending, Manager Assessment Pending, Sign-off Pending, and Completed.
- In Chart view, read the horizontal 100%-stacked bar, one bar per department with four stage segments.
- Use the Assessment Stage filter to highlight departments stuck at a specific stage.
- Use the Review Cycle / TAC filter to scope assessment data to a specific cycle.
Drill Down Into Employee-Level Data
- Click a department bar or table row on the Goals or Competency Activities widget to open the L1 Department view.
- Review the status summary row and the employee table listing each employee's item count and status breakdown.
- Click an employee row to open the L2 Employee view.
- Review that employee's full list of goals or activities, including status, created date, and target date (for goals only).
- Use the breadcrumb to navigate back up through each level.
Adoption Dashboard Scenarios and Their Outcomes
| Scenario | What Happens |
|---|---|
| You apply a Goal Created Date or Activity Created Date filter. | Profit.co counts only the items created within the selected period, and it leaves the underlying goal and activity records unchanged. |
| You drill down from a department into an individual employee's record. | Profit.co carries the active Created Date filter through the department and employee views, and it keeps the comparison consistent across every drill-down level. |
| You open an employee's individual goals or activities from the drill-down view. | Profit.co displays that employee's record to you silently, and it sends no notification to the employee or their manager. |
| You switch a widget from Chart view to Table view. | Profit.co redisplays the same filtered data in a table layout, and it keeps the applied filters and scope unchanged. |
| You click the Download button on a widget. | Profit.co exports the currently filtered view, and it does not alter the underlying goals, activities, or assessment records. |
Best Practices for Using the Adoption Dashboard
- Set the Goal Created Date or Activity Created Date filter to the current cycle before reviewing adoption, since leaving it on All dates blends historical entries with anything created in the current period.
- Use the Review Cycle / TAC filter on the Assessment Progress widget when comparing stage completion across cycles, since Assessment Progress does not have its own Created Date filter.
- Enable the By Location toggle for site-specific reporting instead of exporting the full organization view and filtering afterward, since Location filtering already scopes the widget natively.
- Check the Assessment Stage filter to isolate departments stuck at Sign-off Pending before a cycle closes, rather than scanning the full stacked bar chart department by department.
- Use the breadcrumb to return to the L1 Department view after reviewing an individual employee's record, rather than reapplying filters from the top-level Adoption tab.
Related Articles
- How to view the goal dashboard in Profit.co?
- What are Competency Activities?
- How to Re-open the submitted manager and self-assessment in the performance module?
Frequently Asked Questions
No. The Review Cycle / TAC filter scopes the dashboard to a single cycle at a time. Select a different cycle to compare periods one at a time.
They apply to all three widgets. Location, Business Unit, and the By Business Unit / By Location toggle scope every widget on the Adoption tab, including Assessment Progress.
No. Each widget has its own Download button, so exporting one widget's view doesn't include data from the other two.
Execute your strategy with confidence
Connect OKRs, tasks, and teams in one place with Profit.co
