The X-matrix looks complicated because it compresses a whole plan onto one page. Built in the right order, it’s straightforward. Built in the wrong order, it turns into a grid of dots nobody can read.
In this guide
- What the X-matrix shows
- The order to fill it
- Drawing the correlations
- A worked example: one X-matrix, start to finish
- Reading a finished X-matrix
- How full should it be?
- Variations on the layout
- Common mistakes
- Templates vs building your own
- What building the matrix needs from the software
- What it costs to keep a matrix, not a file
- Building the X-matrix in Profit.co
- Questions this article answers
Key Takeaways
- →Fill it in planning order: breakthroughs, annual objectives, priorities, KPIs, owners. Skipping ahead produces priorities that serve nothing.
- →Grade correlations by dependency, not importance. Strong means the target would likely be missed without this priority.
- →Blank cells are an honest answer. Dot inflation is what makes a grid say nothing.
- →Read it both ways before calling it done: breakthrough down to owner, and any priority back to a breakthrough.
- →Use a template for the layout, never for its content, and move out of it once the plan is agreed.
- →A static file drifts from the business within a quarter. The matrix only earns its place if it is tracked.
What the X-matrix shows
The X-matrix is the one-page summary of a hoshin plan. A large X divides the center into four triangles, each facing one side of the page. Each side lists one element of the plan, and the corner grids record how the elements on adjacent sides relate to each other.
The classic layout, popularized in the West by Thomas Jackson’s work on hoshin kanri for lean enterprises, places the elements like this:
| Side | Element | Horizon |
|---|---|---|
| South (bottom) | Breakthrough objectives | Three to five years |
| West (left) | Annual objectives | This year |
| North (top) | Improvement priorities | This year |
| East (right) | Targets to improve, or KPIs | This year, measured monthly |
| Far east | Resources: the people and teams who own each priority | This year |
Layouts vary between organizations and tools. Some put scorecard perspectives on one side, some swap positions. What matters is that the four elements, objectives, priorities, KPIs and owners, are all present and connected.
The order to fill it
Fill the matrix in the order the planning logic runs, which is roughly anticlockwise from the bottom.
1. Breakthrough objectives
Start with the few multi-year changes the organization is committed to. Three to five is common. More than that and the matrix stops being a statement of focus.
2. Annual objectives
For each breakthrough, what must be true by the end of this year? Fill the corner grid between breakthroughs and annual objectives as you go: each annual objective should connect to at least one breakthrough. One that connects to none is worth questioning before it goes further.
3. Improvement priorities
The work that will deliver the annual objectives. This is where discipline matters most; see Choosing the vital few. Fill the corner grid between annual objectives and priorities.
4. KPIs
The measures that will show whether the priorities are working. Each needs a definition, baseline and target; see Writing KPIs for the X-matrix. Fill the corner grid between priorities and KPIs. This grid holds the plan’s most important claims.
5. Owners
One accountable owner for each priority and each KPI, with supporting teams marked. Fill the resource grid. If one person appears against most priorities, you have found a capacity problem.
Drawing the correlations
Each corner grid uses marks to show how strongly items relate. Traditionally these are a filled circle for strong, an open circle for medium and a triangle for weak; some tools use primary, secondary and partial contribution. The grid between priorities and KPIs deserves the most care, because each mark there is a claim that a piece of work will move a result.
- Grade by dependency, not importance. Strong means the KPI target would likely be missed without this priority.
- Every KPI has at least one strong link. Otherwise nobody is directly working on it.
- Strong links fit the gap. The contributions claimed by a KPI’s strong links can’t exceed the movement its target needs.
- Blanks are allowed. A blank cell is an honest answer, not a gap to fill.
Grading in depth is covered in Primary, secondary, partial, and what each strong mark should state in The X-matrix is a set of hypotheses.
A worked example: one X-matrix, start to finish
The steps are easier to follow with a real-looking plan. Here is a simplified X-matrix for an illustrative industrial equipment maker, built in the order above.
1. Breakthrough objectives (2026 to 2028)
| # | Breakthrough |
|---|---|
| B1 | Grow services to 40% of sales |
| B2 | Reach best-in-class operating margin |
| B3 | Halve value-chain emissions intensity |
2. Annual objectives (2027), with their breakthrough links
| # | Annual objective | Serves |
|---|---|---|
| A1 | Services share at 34% by December | B1 (strong) |
| A2 | Operating margin up 1.5 points | B2 (strong), B1 (medium) |
| A3 | 40% of steel spend with low-carbon suppliers | B3 (strong) |
| A4 | Four more sites at operational maturity level 2 | B2 (medium) |
3. Priorities, with their annual-objective links
| # | Priority | Serves |
|---|---|---|
| P1 | Open three regional service centers | A1 (strong) |
| P2 | Launch multi-year service contracts | A1 (strong), A2 (medium) |
| P3 | Pricing discipline program | A2 (strong) |
| P4 | Low-carbon steel sourcing agreements | A3 (strong) |
| P5 | Site maturity roll-out, wave 2 | A4 (strong), A2 (weak) |
4. KPIs, with the priorities correlated to each
| KPI | Baseline → target | Strong | Medium or weak |
|---|---|---|---|
| Services share of sales | 31% → 34% | P1, P2 | — |
| Contract attach rate (leading) | 22% → 35% | P2 | P1 |
| Price realization | +0.5% → +2% | P3 | P2 |
| Low-carbon share of steel spend | 12% → 40% | P4 | — |
| Sites at maturity level 2+ | 4 → 8 | P5 | — |
5. Owners
| Priority | Owner | Supporting teams |
|---|---|---|
| P1 | Head of service operations | Real estate, regional sales |
| P2 | Commercial director | Legal, service sales |
| P3 | Head of pricing | Regional sales |
| P4 | Chief procurement officer | Sustainability |
| P5 | VP operations | Site leaders |
A few things to notice. Every KPI has at least one strong link. P1 and P2 together carry the services KPI, so their claimed contributions must fit inside its three-point gap. The contract attach rate is a leading KPI paired with the lagging services share, which lets the monthly review see whether P1 and P2 are working long before the annual number moves. And no owner appears against more than one priority.
Reading a finished X-matrix
A well-built matrix can be read in two directions, and it’s worth checking both before calling it done.
- Top down, “why” to “how”: start from a breakthrough, follow the corner grid to its annual objectives, then to the priorities that serve them, then to the KPIs that will show progress, then to the owners. If any chain breaks, something is missing.
- Bottom up, “how” to “why”: start from any priority and trace it back to a breakthrough. A priority that can’t be traced is either missing a link or doesn’t belong on the matrix.
- Every breakthrough reaches an owner through an unbroken chain.
- Every priority traces back to a breakthrough.
- Every KPI has a strong link and a baseline.
- No owner is overloaded. Check the resource column for repeated names.
How full should it be?
| Side | Typical range | Warning sign |
|---|---|---|
| Breakthrough objectives | 3 to 5 | More than 6 |
| Annual objectives | 3 to 8 | Any without a breakthrough link |
| Priorities | 5 to 12 at group level | More than the review can discuss monthly |
| KPIs | 5 to 15 | KPIs without a strong link |
Ranges are common practice, not rules. Your review capacity is the real limit.
A readable X-matrix is a plan someone chose. An unreadable one is a list nobody pruned.
Variations on the layout
The classic layout isn’t the only one in use, and it doesn’t need to be.
- Scorecard perspectives on one side. Some organizations replace one element, or add a band, with Balanced Scorecard perspectives so the matrix doubles as a balance check. Profit.co’s X-matrix places perspectives along the bottom.
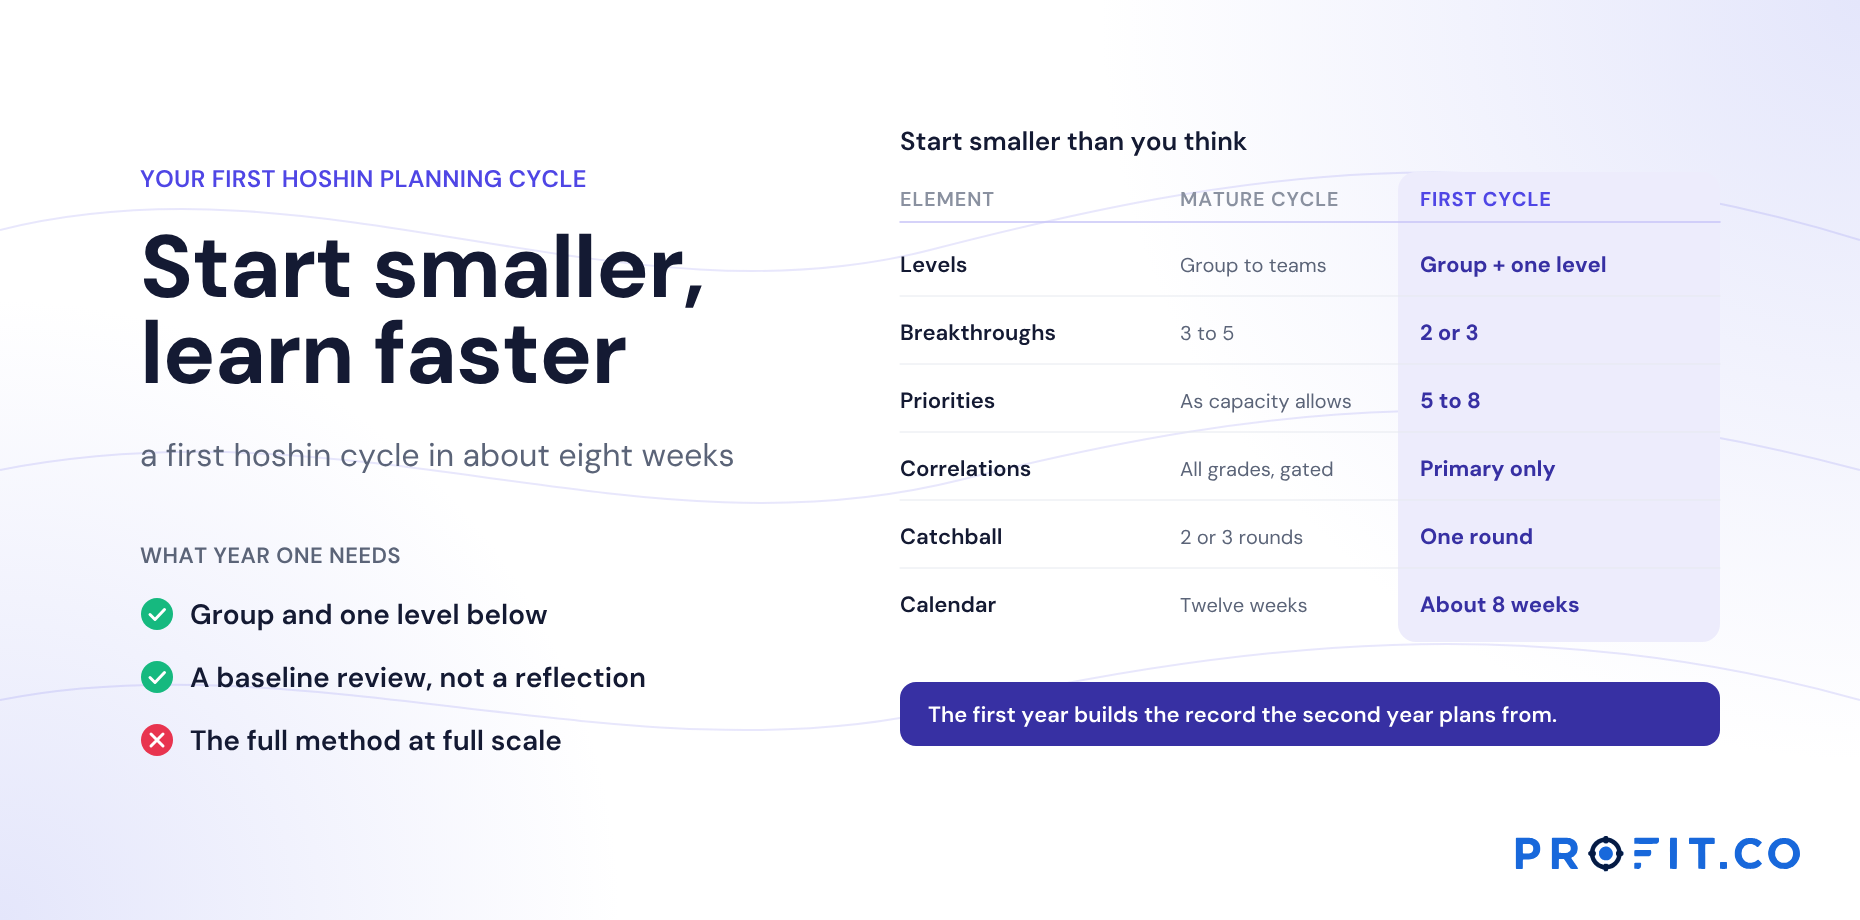
- Simplified first-year matrices. Teams new to hoshin often drop the breakthrough-to-annual grid and keep only priorities, KPIs and owners. That’s a reasonable start; see your first hoshin planning cycle.
- Nested matrices. In a cascade, a group priority becomes a site’s objective, and each site builds its own smaller matrix. See cascading the plan.
- Digital matrices. In software, each element and correlation is a record, so the matrix can be filtered, drilled into and viewed across years rather than read as a single poster.
How long it takes
For a group-level matrix like the example above, expect roughly a day of the planning offsite for priorities, correlations and owners once breakthroughs and annual objectives are agreed, plus two to three weeks of catchball before the targets are final. A first-time matrix takes longer, mostly because KPI definitions and baselines aren’t ready.
Common mistakes
- Filling it in one sitting, all sides at once. The logic runs in order; skipping ahead produces priorities that serve no objective.
- Dot inflation. Adding marks so no priority looks orphaned, until the grid says nothing.
- KPIs that are really priorities. “Launch the pricing tool” is work, not a measure. The KPI is what the launch should change.
- Shared owners. “Operations” can’t check in. A named person can.
- Treating it as finished. The matrix is the start of the year’s plan, not the end of the planning season. It has to be tracked to be useful.
Templates vs building your own
X-matrix templates, in Excel or slides, are useful for one thing: getting the layout right the first time. They don’t help with the hard part, which is deciding what goes in each side and which correlations are real.
- Use a template for the layout, especially the first time, so the corner grids line up and nothing is forgotten.
- Don’t use a template’s content. Example objectives and priorities pull the room towards generic plans. The thinking has to come from your reflection and your breakthroughs.
- Move out of the template once it’s agreed. A template is a drafting surface. The plan has to be tracked month by month, and a static file drifts from the business within a quarter.
A broader look at X-matrix templates, A3s, bowler charts and the other hoshin artifacts will be covered in a forthcoming guide to hoshin kanri tools.
What building the matrix needs from the software
The third bullet above is the whole product requirement in one line. A template is a drafting surface; the plan has to be tracked month by month. Every difference between a drawn matrix and a tracked one comes back to a single question: is a correlation a mark, or is it a record?
A mark can hold a shape. A record can hold a grade, the mechanism behind it, the contribution it claims, the lag window before that contribution should appear, and the signal that would kill it. Everything the gate on day three of the offsite produces needs somewhere to live, and a grid of circles has nowhere.
| Building step | What the tool has to hold | How to test it in a demo |
|---|---|---|
| 1. Breakthroughs | Objectives on a multi-year period, with cumulative movement | Show me a 2026 to 2028 objective and how far it has moved |
| 2. Annual objectives | A link from each annual objective up to its breakthrough | Open an annual objective and show what it serves |
| 3. Priorities | Priorities as rows with owners, not labels on a diagram | Add a priority and assign it, on screen |
| 4. KPIs | Definition, formula, baseline, source and owner per KPI | Click a KPI and show me its card |
| 5. Owners | One named owner per priority and KPI, filterable | Show me everyone who owns more than two rows |
| Correlations | Grade plus mechanism, contribution, lag window and kill signal | Click a dot and show me what opens |
| Across years | Last year’s matrix still readable beside this year’s | Open a closed year and an open draft at once |
Row 6 is the one that separates a diagramming tool from strategy execution software.
Row 5 answers the capacity question this article raises twice, at step 5 and in the final check. “If one person appears against most priorities, you have found a capacity problem” is only useful if you can actually see it, which means owners have to be data rather than text in a cell. The method is in the capacity check.
Row 7 is the one nobody tests, because its cost arrives twelve months later. A tool that overwrites the matrix each cycle makes your first planning season look fine and your second start from a blank page. What changes when the X-matrix is live covers the difference in practice, and hoshin kanri software vs Excel covers where a spreadsheet version stops holding up.
What it costs to keep a matrix, not a file
An X-matrix template costs nothing, and for the first season that is a fair trade. The cost appears at the second one, when the reflection needs last year’s correlations with their verdicts and finds a file that was overwritten in March, plus a folder of slide decks nobody can reconcile.
When comparing quotes, compare shapes rather than headline numbers. OnStrategy lists $200 per month for unlimited users. i-nexus publishes a free Starter tier for up to five users and $28 per user per month at its Standard tier. The difference matters at step 5 of the build: a matrix needs its owners inside the system, and owners sit across divisions and sites rather than only in the planning team.
Profit.co publishes two plans, Essentials and Enterprise, and quotes against modules and scale rather than a public seat rate. For this article the relevant point is scope. Hoshin Kanri sits in Essentials with OKRs and Goals, Balanced Scorecard and Strategy Roadmap, so the scorecard perspectives mentioned under variations, the multi-year breakthroughs at step 1 and the quarterly OKRs that carry each priority all run on one data model. Split them across tools and the corner grids stop connecting anything. The rest of what to total before comparing is in what drives the cost of hoshin kanri software, and the evaluation questions in the seven pass/fail tests.
The 30-day free trial is long enough to rebuild your current matrix as records and read it both ways, which is the check this article ends on.
Building the X-matrix in Profit.co
Profit.co’s X-matrix places objectives, priorities and activities, KPIs and Balanced Scorecard perspectives on the four sides, with owners shown on every priority and KPI. Correlations are graded as primary, secondary or partial contribution. Each item is a record with live progress, so the matrix built in planning is the one tracked through the year. Objectives can carry multi-year strategy periods for breakthroughs. See the planning software page, and the hoshin kanri software page for how the matrix runs once built.
Read against the build order above, that means step 1 has a place for multi-year objectives, step 5 makes overloaded owners visible as a filter rather than an impression, and the correlation grid between priorities and KPIs holds graded records rather than marks. The bowler chart then takes the monthly plan values for each KPI, which is the step that turns the finished matrix into something the January review can run from.
Free Product Demo
Build next year’s X-matrix from this year’s
A 30-minute walkthrough, tailored to your team.
Book a free demo
What happens in the call
How your teams set goals, track progress and review results.
Strategy, performance, projects and engagement on one platform, with AI.
A practical path to align teams, execute faster and drive results.
Questions this article answers
A one-page hoshin kanri plan. A large X divides the center into four triangles, each facing one element of the plan, and the corner grids show how breakthrough objectives, annual objectives, priorities, KPIs and owners relate to each other.
Breakthrough objectives, then annual objectives, then improvement priorities, then KPIs, then owners, filling each corner grid as you go. This follows the planning logic from why to how.
Commonly three to five breakthroughs, three to eight annual objectives, five to twelve group-level priorities and five to fifteen KPIs. The real limit is how many rows your monthly review can discuss.
Traditionally a filled circle means a strong correlation, an open circle medium and a triangle weak. Some tools use primary, secondary and partial contribution instead.
A template gets the layout right the first time. Software is what keeps the plan once it is agreed, because each correlation becomes a record with a grade and a history rather than a mark on a file that drifts within a quarter.
Yes. Objectives, priorities, KPIs and Balanced Scorecard perspectives sit on the four sides, owners appear on every priority and KPI, and correlations are graded as primary, secondary or partial contribution.