A goal-tracking dashboard is a live view of progress against defined objectives – showing whether goals are on track, who owns each one, and when progress was last updated. For individuals, it replaces weekly status emails with a single, always-current record. For teams, it replaces manager guesswork with a shared view of what is moving and what isn’t. Most organizations build one and wonder why no one uses it. The answer is almost always structural: a single generic view was built for everyone, which means it works well for no one.
Table of Contents
- Why Individual and Team Dashboards Need Different Views
- What to Track on an Individual Goal Dashboard
- What to Track on a Team Goal Dashboard
- How to Set Up a Goal Dashboard: 5 Steps
- Common Goal Dashboard Mistakes
- Goal Dashboard FAQs
This guide explains what to track at each level, how to set up dashboards that get used, and the four mistakes that make most dashboards irrelevant within a quarter.
Why Individual and Team Dashboards Need Different Views
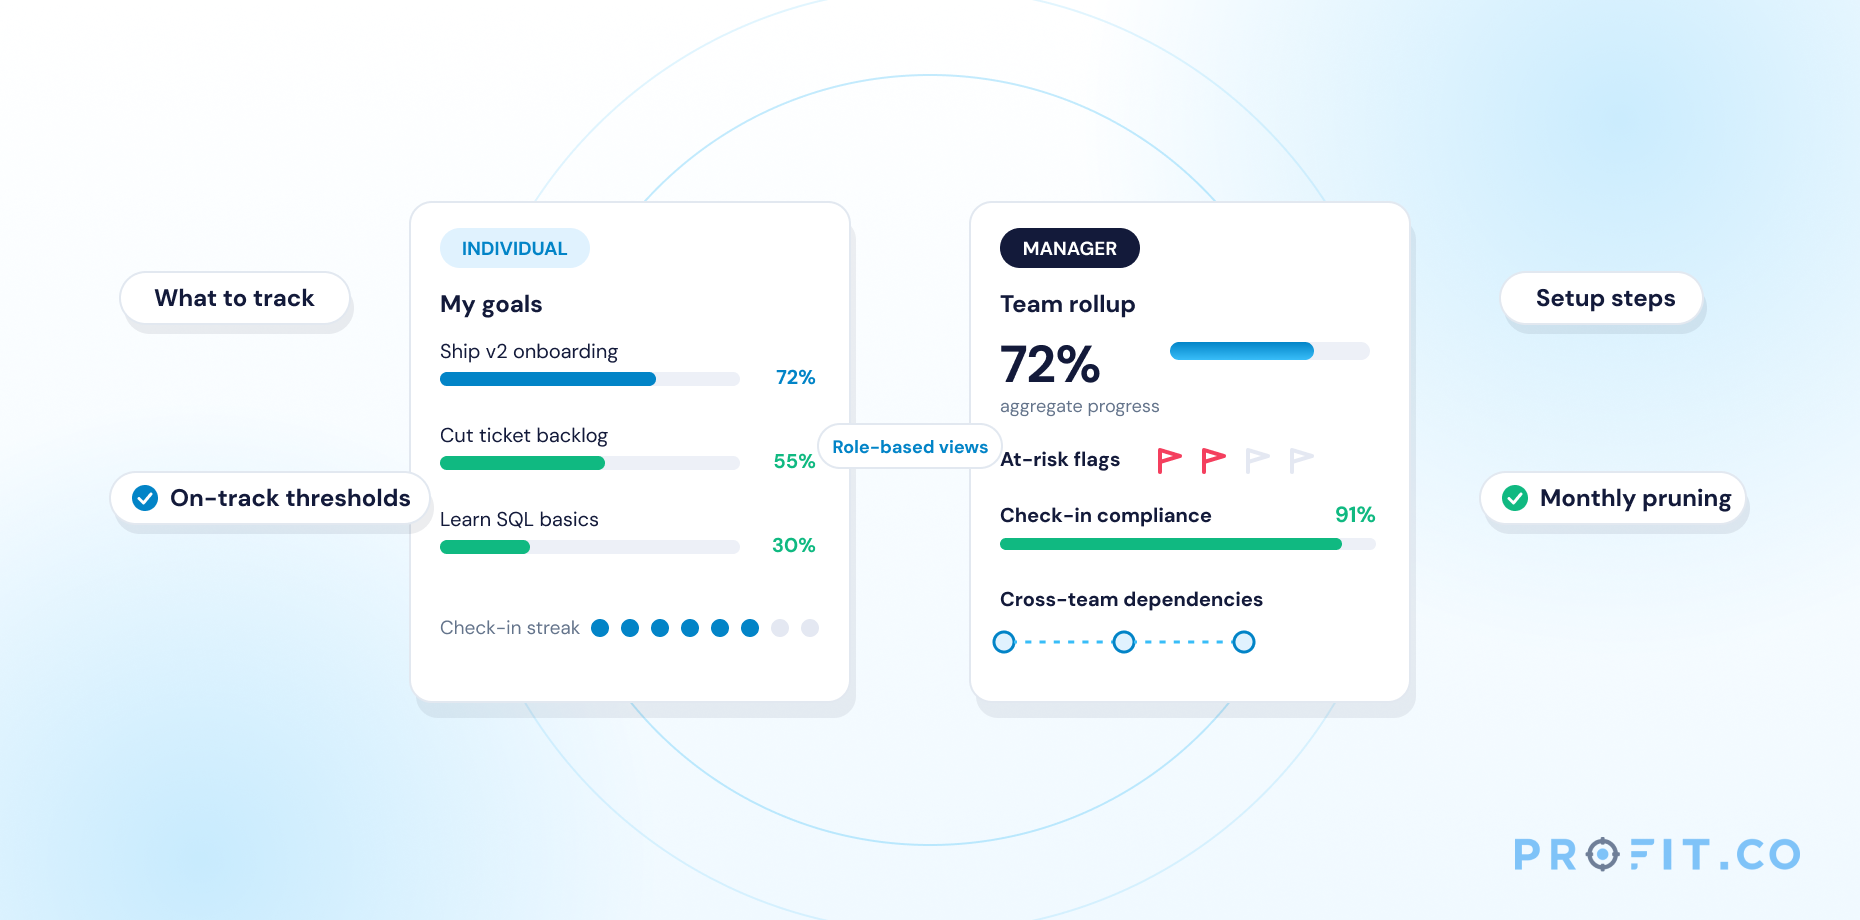
An individual dashboard and a team dashboard look similar on the surface – both show goals, completion percentages, and status labels. But they serve fundamentally different decisions.
| Dimension | Individual Dashboard | Team Dashboard |
|---|---|---|
| Primary question answered | Am I on track? | Who on my team needs attention today? |
| Primary user | Contributor / individual contributor | Manager / team lead |
| Focus | Personal progress and check-in history | Risk visibility, compliance rate, dependencies |
| Key signal | Progress % against my own target | At-risk goals across all team members |
| Design priority | Accountability and clarity | Signal over noise – surface problems fast |
Cramming both into one generic “goals page” is the primary reason most dashboards go unused within six weeks. When a manager and a contributor see the same view, neither sees what they need. Contributors see too much noise – everyone else’s goals, aggregate metrics they cannot act on. Managers see too little signal – individual progress buried inside team-wide averages.
Build them separately. Link them together. If you are currently running OKRs in a single shared view and wondering why check-in rates are low, this is where the friction starts. For a broader look at what dashboards contribute to goal progress overall, see how OKR dashboards help you progress towards your goals faster.
What to Track on an Individual Goal Dashboard
Five metrics belong on every individual goal dashboard. Each answers a specific question a contributor needs before a check-in.
Current goal status (on-track / at-risk / off-track)
A single traffic-light indicator answering “do I need to act today?” Status should be set by the contributor at each check-in, not auto-calculated from a single data point.
Check-in cadence and last update date
If the last update was three weeks ago, the goal is not being managed. This field makes staleness visible without the manager having to chase.
Progress percentage against target
The raw number (75% toward a $200K sales target, not “good progress”). Percentages force specificity and make it easy to spot goals that haven’t moved between check-ins.
Linked team or company objective
Every individual goal should trace back to a higher-level goal. When that link is visible on the dashboard, contributors can answer “does my work actually connect to what we’re focused on this quarter?” without asking their manager.
Historical trend line
The current percentage matters less than whether progress is accelerating or stalling. A goal at 40% in week two is fine. A goal at 40% in week six with no movement is a problem. A trend line makes this visible without manual analysis.
Marcus Webb, an operations lead at Vantage Logistics, added a trend line view to his personal OKR dashboard after his Q3 review revealed he had been “on track” by percentage until week eight – but actual movement had stopped in week four. “The status label said on track,” he said. “The trend showed a straight line.”
What to Track on a Team Goal Dashboard
A team dashboard is not a collection of individual dashboards. It is a risk-management tool. Six elements make it functional for a manager:
Aggregate team progress
One number showing average completion rate across all team goals. Not for precision – for a quick read on whether the team is ahead or behind the expected pace.
Individual member status at a glance
A roster-style view with one status indicator per person. The manager should not have to click into each goal to see who is struggling.
Goals flagged at-risk or off-track, by person
Pulled to the top of the view, not buried in scroll. If two people on the team both have at-risk goals, the manager needs to see both in the same glance.
Check-in compliance rate
What percentage of team members have checked in this week. A team with 40% check-in compliance is not running OKRs – it is maintaining a goal-entry habit with no follow-through. See how top teams win with weekly OKR check-ins for what separates teams with high compliance from those without.
Cross-team dependencies
Any goal on the team’s dashboard that is blocked by or blocking another team’s goal. These need surfacing before they become escalations.
Quarter-over-quarter trend
Is this team’s average completion rate higher or lower than last quarter? This is the metric that tells a leader whether the OKR program is improving execution or logging activity.
How to Set Up a Goal Dashboard: 5 Steps
Define What “On Track” Means Before Building Views
Before choosing software or laying out any view, answer one question: at week six of a twelve-week quarter, what progress percentage qualifies as “on track”? Most teams never decide this explicitly and end up with dashboards where every goal shows green until week ten. A widely used rule: 50% completion at week six = on track; 75% at week nine = on track. Set these thresholds in writing before anyone logs a goal. Without them, status labels reflect optimism, not reality.
Choose Individual vs. Team Default View by Role
Contributors should see their individual dashboard first when they open the tool. Managers should see the team dashboard first. This is not a preference setting – it is the difference between a tool that gets used and one that gets bypassed. Set the default view in platform settings by role, not by user request.
Set a Check-in Cadence and Enforce It
Weekly check-ins are the standard for OKR programs with quarterly goals. Decide the day, decide who triggers the update (the contributor, not the manager), and configure automated reminders. A dashboard updated once per month is a monument, not a management tool. If your OKR management platform supports scheduled nudges, turn them on from day one. For the mechanics of running this cadence well, see what are weekly check-ins in OKR.
Connect the Dashboard to a Recurring Meeting
A goal dashboard that does not feed a meeting will be ignored within six weeks. The team dashboard should be the opening view in every weekly or bi-weekly team sync. If progress hasn’t moved on a goal, that is the agenda item – not a side note. The meeting format reinforces the update behavior; the update behavior keeps the dashboard accurate. The Progress, Plans, and Problems (PPP) methodology is a simple structure for running that sync consistently.
Review and Prune Stale Goals Monthly
At the end of each month, review the dashboard for goals that have not been updated, goals that have been completed but not closed, and goals that no longer reflect current priorities. A dashboard with thirty active goals, twelve of which are stale, trains teams to ignore the whole thing. Prune ruthlessly. A shorter list of actively managed goals outperforms a comprehensive list nobody trusts.
Common Goal Dashboard Mistakes
Too Many Metrics With No Clear Signal
More data is not more useful. A dashboard tracking fifteen metrics – each slightly different, none clearly flagged as the one that matters – forces users to build their own interpretation every visit. Cap individual dashboards at five to eight metrics. Make the most important number the largest element on the screen.
Self-Reported Status With No Verification
If status is set entirely by contributors and never checked against any external input, it reflects optimism. Connect at least one automated data source per goal type – sales data from a CRM, ticket volume from a support tool, task completion from a project platform – to give self-reported status a reality check. Profit.co’s OKR management platform connects to 100+ data sources for exactly this reason.
Dashboard Disconnected From Meetings
If the dashboard is not opened during team meetings, it will not be updated before team meetings. The tools teams use in meetings are the tools teams maintain. This is not a discipline problem – it is a design problem. Fix it by making the dashboard the literal first thing opened in every weekly sync.
No Distinction Between Individual and Team Views
The most common setup failure: one generic “goals” page showing everyone’s goals in one list. Managers cannot find risk items. Contributors cannot locate their own progress without filtering. Design for the use case from the start. If your current tool forces a single shared view, that is worth factoring into your next platform evaluation.
Ready to build a goal dashboard your team will actually use?
Goal Dashboard FAQs
A goal-tracking dashboard should include current goal status (on-track, at-risk, off-track), progress percentage against target, last check-in date, the linked team or company objective, and a trend line showing whether progress is moving. Individual dashboards prioritize personal accountability; team dashboards prioritize risk visibility for managers. Both should be accessible from the same platform without toggling between tools.
An individual dashboard answers “am I on track?” – showing personal progress percentage, check-in history, and trend over time. A team dashboard answers “who needs my attention today?” – surfacing at-risk goals, check-in compliance rates, and cross-team dependencies across all members. Both require separate, purpose-built views; one generic list serves neither role.
Weekly, at minimum – aligned to the check-in cadence for quarterly OKRs. Daily updates are only necessary for goals whose tracking metric changes daily (sales pipeline, support ticket volume). Consistency matters more than frequency: irregular updates erode a dashboard’s signal value faster than any single missed week.
Look for separate individual and team views by role, configurable check-in reminders, integration with data sources your team already uses (CRM, project tools, BI platforms), trend visualization, and automatic at-risk flagging. Review what OKRs are before evaluating tools – the methodology shapes what the dashboard must surface. For enterprise-scale setups, the enterprise OKR dashboard guide covers additional structure.