Analysts often file strategy deployment tools under strategic portfolio management, and buyers end up comparing them as if they did the same job. They don’t. One manages a portfolio of investments. The other manages whether those investments are changing the results the strategy needs.
In this guide
- Two jobs that get confused
- Where they overlap
- When you need which
- Running both together
- A worked example: one transformation, two views
- Three integration patterns
- Who owns what
- If you already own a portfolio tool
- Common objections
- Benefits realization is not the same as evidence of effect
- Data to exchange between the two systems
- How to tell from a demo
- What the second layer costs
- Questions this article answers
Key Takeaways
- →SPM manages projects, programs and investments. Deployment manages objectives, targets and results.
- →SPM asks whether the project delivered what it promised. Deployment asks whether the result it was chosen to move is moving.
- →A portfolio can be delivered perfectly and the strategy can still fail.
- →Three integration patterns: deployment-led, portfolio-led, or one unified platform.
- →The handover that matters runs from the strategy office to the portfolio office, in time for the next funding decision.
- →Benefits realization checks at closure; deployment evidence checks monthly, while there is still time to act.
Two jobs that get confused
Both categories connect work to strategy, so from a distance they look alike. Up close, they manage different things.
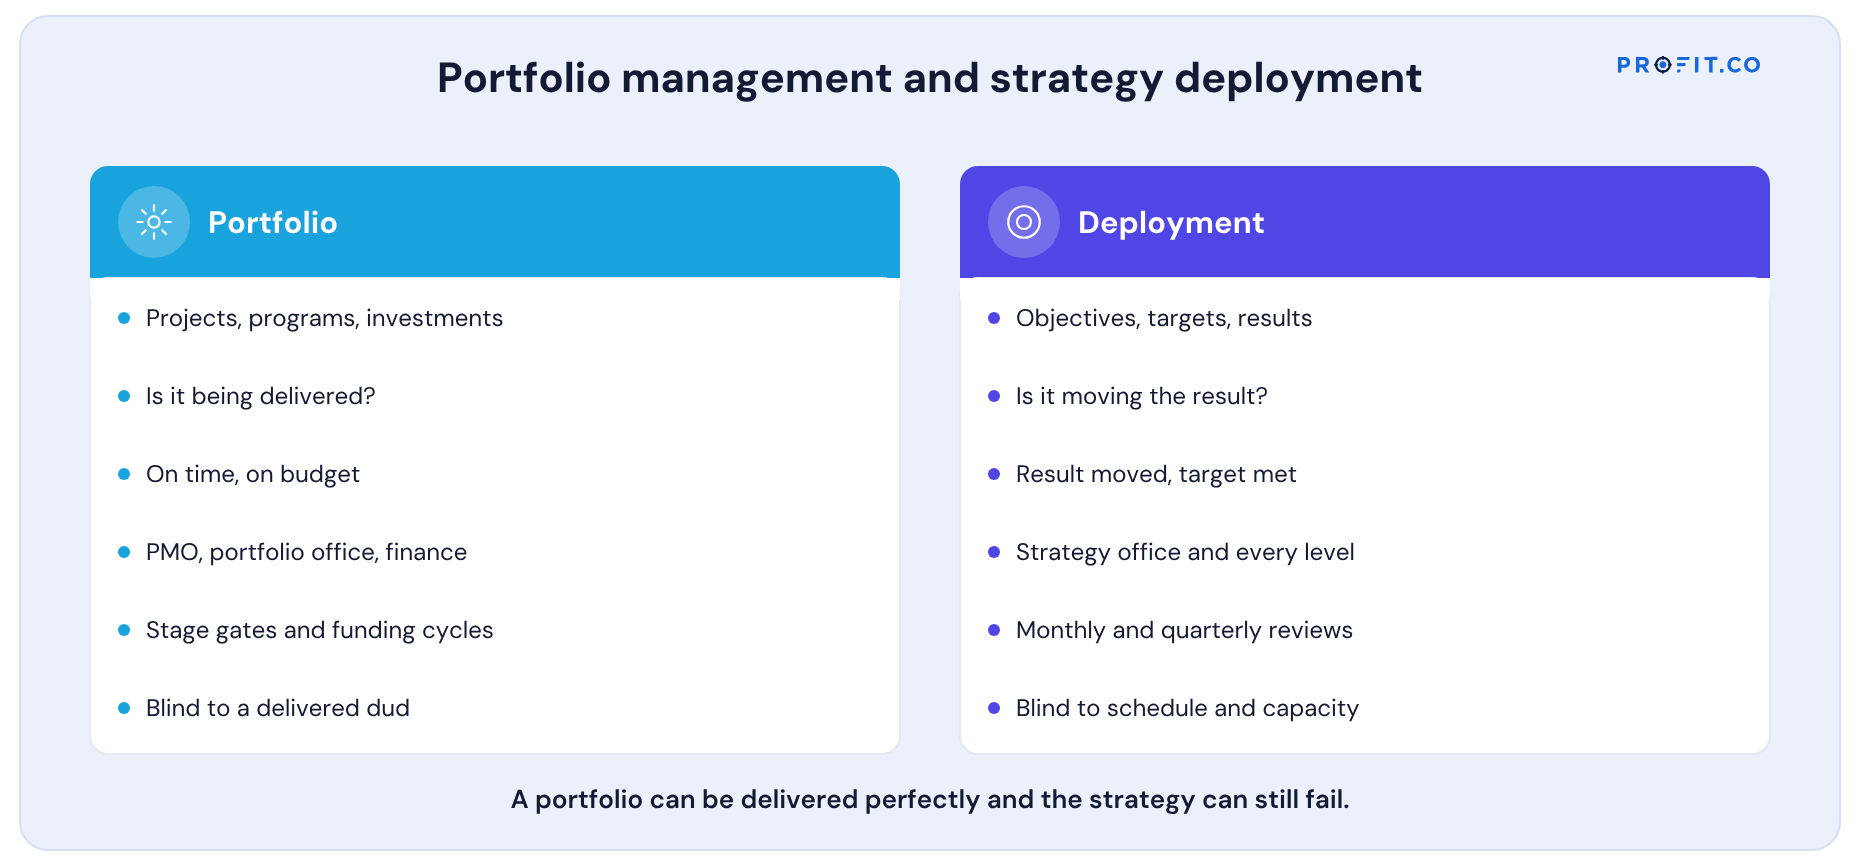
The table below sets them side by side. Read the last row first: each category’s blind spot is the other one’s core question.
| Measure | Strategic portfolio management | Strategy deployment |
|---|---|---|
| Unit managed | Projects, programs, investments | Objectives, targets, results |
| Core question | Are we funding the right work, and is it being delivered? | Are our strategic choices reaching every level, and is the work moving the results? |
| Measure of success | On time, on budget, benefits forecast | Result moved, target met |
| Typical owner | PMO, portfolio office, finance | Strategy office, objective owners, every level |
| Users | Project and program managers | Leaders, managers and teams across the organization |
| Cadence | Stage gates, funding cycles, project reporting | Planning season, monthly and quarterly reviews, check-ins |
| Typical blind spot | Delivered projects that didn’t move results | Funding, scheduling and capacity detail |
Where they overlap
Both link work to objectives. SPM tools typically let projects be tagged to strategic objectives, and deployment tools typically let initiatives be tracked under objectives. That overlap is why they get compared.
The difference is in what happens after the link is drawn. An SPM tool asks whether the project is delivering what it promised. A deployment tool asks whether the result the project was chosen to move is moving. A project can be green on every portfolio measure and still have no effect on the strategy.
A portfolio can be delivered perfectly and the strategy can still fail. The two facts live in different systems unless someone connects them.
When you need which
| Your situation | Likely need |
|---|---|
| Strategy is mostly delivered through large capital or IT programs, and the main risk is choosing and delivering them | SPM first |
| Strategy depends on behavior change across many teams, with few large projects | Strategy deployment first |
| Large programs and many teams both matter, and results are lagging despite good delivery | Both, connected |
| You already have SPM and roll-ups look healthy while key results don’t move | Add deployment |
That last row has a name and a diagnosis: Alignment Isn’t Effect: Why Well-Aligned Plans Still Miss.
Running both together
- Objectives live in the deployment layer, with targets negotiated by level.
- Projects live in the portfolio layer, with funding, schedule and delivery.
- Each project names the result it should move, and the expected time lag.
- Project progress flows to the deployment layer, where it is shown beside the result.
- Decisions flow back: a project whose result isn’t moving is reviewed for reallocation at the next portfolio cycle.
The last point is the one most organizations miss. Without it, the portfolio cycle funds projects on delivery performance alone, and a delivered project with no effect keeps its budget.
A worked example: one transformation, two views
Here is a hypothetical transformation seen two ways, through the portfolio view and the deployment view:
| Question | Portfolio view | Deployment view |
|---|---|---|
| Service network program status | Green: on time, 4% under budget | Initiative 85% complete |
| Contract model project | Amber: legal approval two weeks late | Dependency for one region’s target; region notified |
| Services share of sales | Not tracked | Flat; flagged as outcome lag in month four |
| Decision at Q2 | Release next funding tranche | Diagnose: centers open, calls still routed centrally; fix routing |
Both views are accurate. Only together do they produce the right decision: keep funding the network, and fix the routing that stops it working.
Three integration patterns
| Pattern | How it works | Suits |
|---|---|---|
| Deployment-led | Objectives and targets in the deployment tool; major projects in the portfolio tool, linked as initiatives | Strategy delivered mainly through behavior change and many teams |
| Portfolio-led | Portfolio tool is the system of record; deployment tool adds objectives, targets and evidence above it | Strategy delivered mainly through large programs |
| Unified platform | Objectives, OKRs, scorecards and project portfolios on one data model | Organizations that want to avoid synchronizing two systems |
Each pattern works if the result each project should move is named and visible beside the project’s delivery. Each fails if the portfolio cycle funds projects on delivery alone.
Who owns what
| Activity | Portfolio office | Strategy office | Objective owners |
|---|---|---|---|
| Deciding which projects to fund | Leads | Contributes evidence | Propose |
| Tracking project delivery | Leads | Informed | Informed |
| Negotiating targets by level | Informed | Leads | Negotiate |
| Linking projects to results | Contributes | Leads | Own the link |
| Judging whether projects moved results | Informed | Leads | Report evidence |
| Reallocating funding on evidence | Executes | Recommends | Consulted |
The handover that matters most runs from the strategy office to the portfolio office: evidence of effect, in time for the next funding decision.
What that office should own, and what it should stop doing, is in Strategy Deployment for Strategy and Transformation Offices.
If you already own a portfolio tool
- Can it show a delivered project whose result hasn’t moved? If not, you’re missing the upward direction.
- Are targets negotiated anywhere? If only budgets are negotiated, targets are probably cascaded.
- Do teams outside projects use it? If not, strategy reaches projects but not the rest of the organization.
- Does evidence feed the next funding cycle? If not, delivered projects with no effect keep their budgets.
Two or more answers of “no” suggest adding a deployment layer, not replacing the portfolio tool.
Common objections
| Objection | Response |
|---|---|
| “Our portfolio tool already links projects to objectives.” | Linking is alignment. The question is whether it shows whether each project is moving its objective’s result. |
| “We measure benefits realization.” | Benefits are usually forecast at approval and checked at closure. Deployment checks monthly, with an expected lag, while there’s time to act. |
| “Another tool means another system to maintain.” | True if the two aren’t connected. A unified platform, or a clear integration pattern, avoids it. |
| “Our strategy is all projects.” | Then start portfolio-led, and add the evidence of effect above it. |
Benefits realization is not the same as evidence of effect
Portfolio teams often answer the effect question with benefits realization: forecast benefits at approval, check them at closure. It’s a valuable practice, and it differs from deployment evidence in three ways.
| Benefits realization | Deployment evidence | |
|---|---|---|
| When checked | At stage gates and closure | Monthly, from the expected lag onwards |
| What is measured | The project’s own forecast benefits | The strategic result the project was chosen to move |
| What happens on a miss | Lessons learned after closure | Corrective action or reallocation during the year |
The two complement each other. Benefits realization keeps projects honest about their own promises; deployment evidence keeps the strategy honest about whether those promises add up to the result it needs.
Data to exchange between the two systems
- From portfolio to deployment: project status, percent complete and key milestones, linked to the objective each project serves.
- From deployment to portfolio: whether the result each project should move is moving, after its expected lag.
- Both ways: a shared identifier for each project and objective, so links survive renames.
- On a schedule: in time for each monthly review and each funding cycle.
If these four flows exist, the two systems can each do their job without either pretending to be the other.
How to tell from a demo
- Ask what the tool shows for a project that finished on time and changed nothing. A portfolio tool shows green. A deployment tool shows the gap.
- Ask who updates what. If project managers update everything, it’s a portfolio tool. If owners of results and objectives check in too, it’s deployment.
- Ask how targets are agreed between levels. Portfolio tools rarely handle this; deployment tools should.
The full version of that script, with pass conditions, is in How to Evaluate Strategy Deployment Software.
What the second layer costs
Adding a deployment layer above an existing portfolio tool is usually cheaper than organizations expect, because the expensive part, project and resource management, is already bought. What is being added is objectives, targets and evidence, used by a wider group of people but at lower intensity.
Among published alternatives, OnStrategy lists $200 per month for unlimited users. i-nexus publishes a free Starter tier for up to five users and $28 per user per month at its Standard tier. For either, the integration question decides the real cost: whether project status can flow in on a schedule without someone re-keying it.
Profit.co publishes two plans, Essentials and Enterprise, quoting against modules and scale rather than a public seat rate. Because project portfolios sit on the same platform as OKRs and Goals, Balanced Scorecard and Hoshin Kanri, the unified pattern above needs no integration at all. What Drives the Cost of Hoshin Kanri Software lists the rest to total.
Profit.co runs strategy deployment, OKRs, scorecards and hoshin plans on one model, with project portfolios on the same platform, so a program’s delivery and the result it should move appear together. See the strategy deployment software page.
Free Product Demo
See delivery and effect side by side
A 30-minute walkthrough, tailored to your team.
Book a free demo
What happens in the call
How your teams set goals, track progress and review results.
Strategy, performance, projects and engagement on one platform, with AI.
A practical path to align teams, execute faster and drive results.
Questions this article answers
Portfolio management decides which projects to fund and tracks their delivery. Strategy deployment connects objectives to targets and work at every level and tests whether the work is moving the results.
Organizations that deliver strategy through large programs and many teams usually do. Smaller organizations, or those with few large projects, often need only one.
Because projects can be on time and on budget without moving the results they were chosen to move. Delivery and effect need to be tracked together.
No. Benefits realization forecasts at approval and checks at closure, against the project’s own promises. Deployment evidence checks monthly from the expected lag onwards, against the strategic result the project was chosen to move.
Four flows: project status into the deployment layer, result movement back to the portfolio layer, a shared identifier so links survive renames, and a schedule that fits both the monthly review and the funding cycle.