

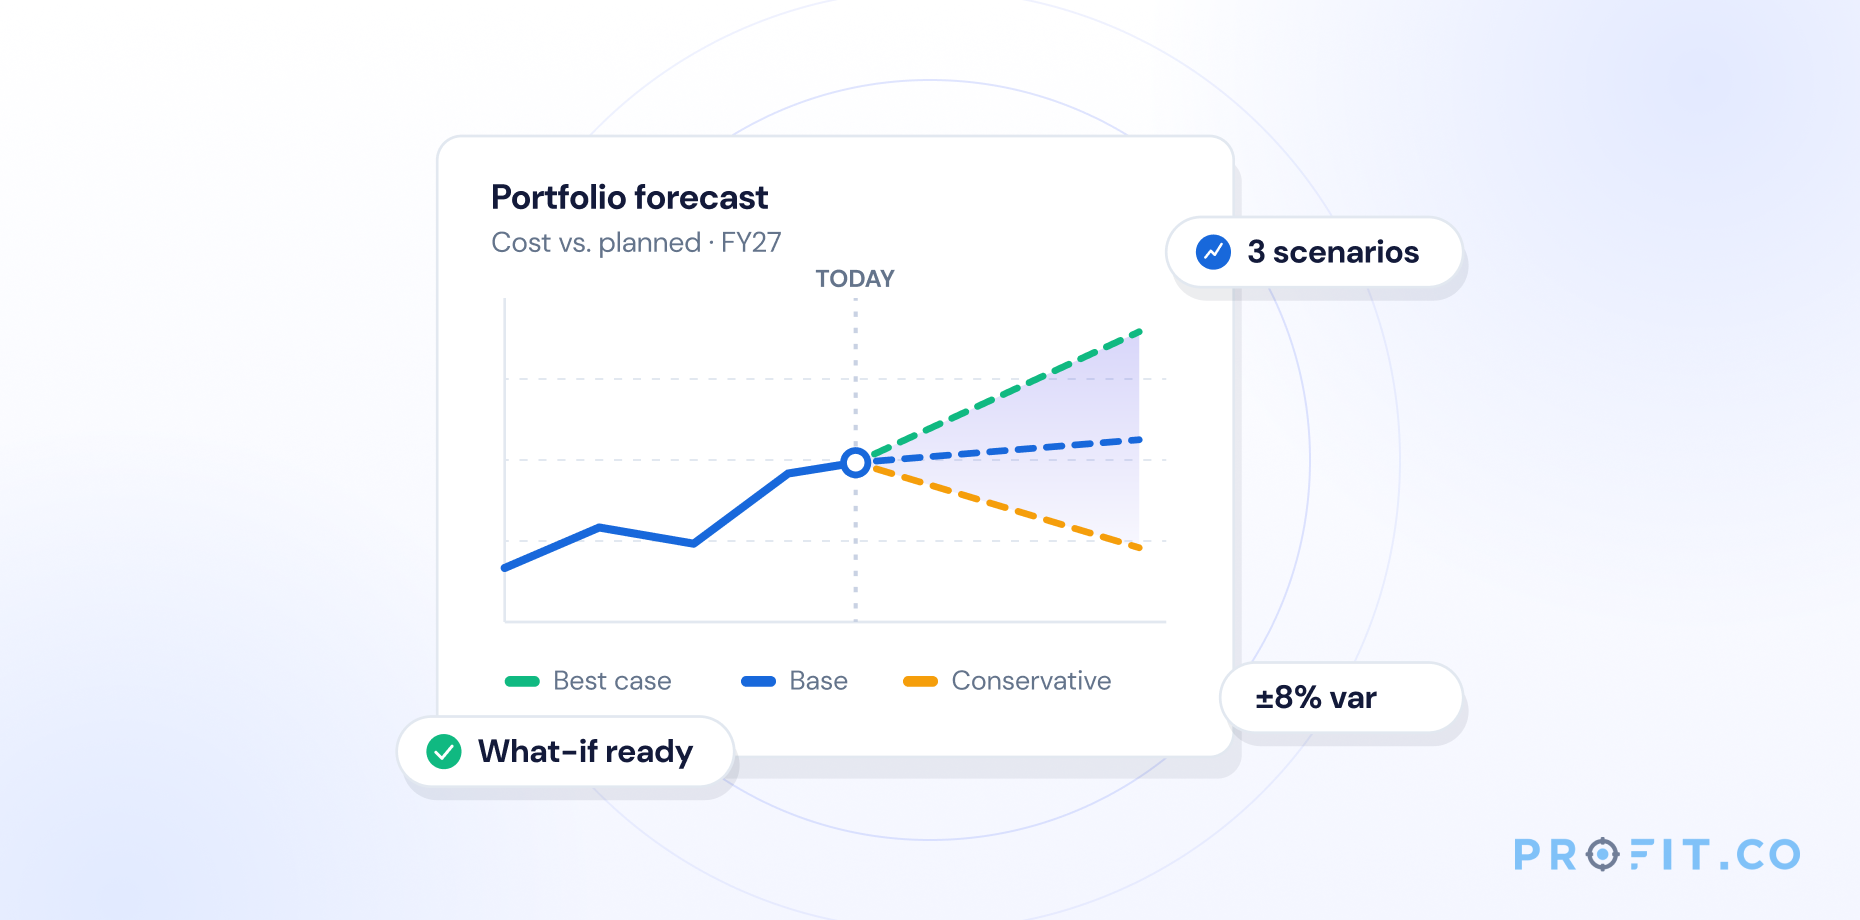
PPM forecasting is the capability that tells a portfolio leader whether the current project mix will deliver its expected outcomes – on time, within budget, and aligned to active strategic priorities – before the quarter ends. Scenario modeling is what enables them to test alternatives before committing resources. Together, they are the difference between a PPM platform and a project tracking tool.
In this guide
- What Is PPM Forecasting – and Why Does It Matter for Portfolio Decisions?
- What Is Scenario Modeling in PPM – and What Should It Enable?
- What to Look for in a PPM Platform’s Forecasting Capabilities
- PPM Platform Comparison: Forecasting and Scenario Modeling
- PPM Forecasting Use Cases: How Enterprise Teams Apply It
- Connect Your PPM Forecasting to Live OKRs with Profit.co
- IT Portfolio Management Maturity Model: Where Does Your Organisation Sit?
- How PPM Platforms Integrate with Financial Systems
- Common PPM Forecasting Mistakes to Avoid
- What the Right Platform Does for PPM Forecasting and Scenario Modeling
- Profit.co’s PPM Forecasting and Scenario Modeling Capabilities
- PPM Forecasting Best Practices
- PPM Forecasting and Scenario Modeling Questions and Answers
TL;DR – Most PPM platforms offer project tracking. Far fewer offer genuine portfolio forecasting – the ability to model resource capacity, financial burn, and strategic outcome probability across the full project mix simultaneously. Scenario modeling is rarer still: the ability to run a “what if we cut budget by 20%?” analysis and see the portfolio-wide impact before the decision is made. This guide covers the specific capabilities to evaluate, a platform comparison table, the IT portfolio maturity model, and how financial system integration determines whether forecast data is reliable or manually maintained.
What Is PPM Forecasting – and Why Does It Matter for Portfolio Decisions?
PPM forecasting is the capability that projects the expected outcomes of the current project portfolio – financial, resource, and strategic – forward in time, so portfolio leaders can identify emerging risks and make resource decisions before they become crises. It operates across four dimensions:
Resource Capacity Forecasting
Projects future resource availability across the team and compares it to committed portfolio demand – identifying overallocation, capability gaps, and hiring needs weeks before they become delivery blockers. A PPM platform without resource capacity forecasting requires portfolio managers to maintain this view manually in a spreadsheet – which means it is always two weeks behind the decisions that need it.
Financial Forecasting
Projects budget burn rates, cost-to-completion estimates, and variance trends forward from the current period – so finance and portfolio leaders can see whether the portfolio is on track to deliver within budget before the quarter-end review makes the gap visible. The critical distinction: financial forecasting in PPM is not the same as financial reporting. Reporting shows what happened. Forecasting shows what will happen if current trends continue. For how PPM and financial tracking must work together to make this possible, the full guide covers the integration architecture required.
Timeline Forecasting
Models schedule risk across the portfolio – identifying which projects are at risk of milestone slippage, what the downstream dependencies are, and what the portfolio-level impact is if a key project delays. Timeline forecasting requires integration with the project execution layer; platforms that forecast at the portfolio level without reading actual task completion data produce misleading confidence levels.
Strategic Outcome Forecasting
The most advanced – and least commonly provided – forecasting capability: projecting whether the portfolio will deliver its expected strategic outcomes given current execution velocity. This requires the platform to hold both the strategic goals (OKRs or balanced scorecard objectives) and the project portfolio in the same system, so the connection between delivery progress and strategic impact is live rather than asserted at the planning stage.
A PPM platform that can forecast cost and timeline but not strategic outcome is not a portfolio management tool – it is a project tracking tool with more seats and a higher price.
What Is Scenario Modeling in PPM – and What Should It Enable?
Scenario modeling is the capability that allows portfolio leaders to test the impact of hypothetical decisions on the portfolio before committing to them. It is not a planning feature – it is a decision support feature. The value is not in building the scenarios; it is in reaching the right investment decision faster and with more confidence. For how scenario planning connects to OKRs and strategy execution more broadly, see the scenario planning process guide.
A mature scenario modeling capability in a PPM platform enables five specific use cases:
Portfolio Investment Scenarios
Add, remove, or reprioritise projects within a constrained budget envelope and see the portfolio-level impact instantly – which Key Results are at risk, which resource pools are affected, and what the revised financial position looks like. This replaces the multi-day spreadsheet analysis that most PMOs currently run before a portfolio review.
Resource Reallocation Scenarios
Model the impact of moving a team or individual from one project to another – what accelerates, what slips, and whether the net impact on strategic priorities is positive. Without this capability, resource reallocation decisions are made on the basis of the loudest stakeholder, not the most accurate portfolio model.
Budget Constraint Scenarios
Apply a budget reduction (typically 10-25%) and model which projects survive, which are deferred, and what the strategic impact is across the resulting portfolio. This is the scenario most commonly required in Q3 and Q4 budget cycles – and the one that most PPM platforms cannot run without a manual export to a financial model. For how what-if planning enables faster decisions during disruptions, the full guide covers the operational mechanics.
Timeline Sensitivity Scenarios
Model the portfolio-wide impact if a key project slips by a defined number of weeks – which dependent projects are affected, what the resource implications are, and how the strategic calendar is altered. The input is a single assumption; the output is a revised portfolio view that reflects every downstream effect.
Capacity Planning Scenarios
Model the portfolio that is achievable given a defined resource envelope – answering the question “what can we deliver this quarter with our current team?” rather than “will our current team deliver our current portfolio?” The distinction is critical for organisations that consistently commit to more than their capacity can support.
Scenario modeling is not a planning feature – it is a decision support feature. The value is not in building the scenarios; it is in making the investment decision faster and with more confidence than a spreadsheet analysis allows.
What to Look for in a PPM Platform’s Forecasting Capabilities
The following capability checklist covers the six evaluation dimensions that distinguish enterprise-grade PPM forecasting from basic project tracking with a portfolio view:
Live Data Integration – Not Manual Entry
Forecasting that depends on manual data entry is forecasting that is always wrong. Evaluate whether the platform pulls resource actuals from integrated tools (Jira, Azure DevOps, timesheets), financial actuals from connected ERP or finance systems, and milestone completion from project execution data – automatically and on a defined refresh cadence. Ask the vendor: what is the lag between an action in the source system and its reflection in the portfolio forecast?
Scenario Comparison View
The platform must enable simultaneous comparison of two or more portfolio scenarios – not sequential switching between saved views. If reviewing a scenario requires abandoning the current view to load another, meaningful comparison is not possible in a live meeting. Evaluate whether the scenario comparison view shows the delta between scenarios (resource impact, financial impact, strategic outcome impact) in a single screen.
OKR or Strategic Goal Integration
Forecasts that are disconnected from strategic goals answer the wrong question. A portfolio that delivers on time and on budget but misses its strategic Key Results has not succeeded – it has executed efficiently in the wrong direction. Evaluate whether the platform connects project forecasts to active OKRs or strategic objectives, so the forecast view shows both delivery confidence and strategic contribution simultaneously. See 10 great PMO OKR examples for how PMOs structure this connection in practice.
Resource Capacity Model – Not Just Allocation View
An allocation view shows where resources are currently committed. A capacity model shows the gap between committed demand and available supply – forward in time. Evaluate whether the platform models capacity at the role, team, and individual level; whether it reflects planned absences and part-time allocations; and whether capacity constraints are surfaced automatically as risks in the portfolio forecast rather than requiring manual inspection.
Financial Modelling Depth
Evaluate three specific financial modelling capabilities: cost-to-completion estimates (not just budget-vs-actuals), earned value management (EVM) metrics (SPI and CPI), and multi-currency support for global portfolios. EVM is the strongest indicator of forecasting maturity – it requires the platform to connect budget, schedule, and scope simultaneously, which most tools approximate rather than calculate precisely.
Automated Reporting and Board-Ready Outputs
A forecast that requires a PMO analyst to build a PowerPoint before it reaches the board is not an operational forecast – it is a reporting exercise that happens to use platform data as input. Evaluate whether the platform generates portfolio status reports, executive dashboards, and scenario comparison documents automatically from live data, in formats that do not require reformatting before distribution.
PPM Platform Comparison: Forecasting and Scenario Modeling
Buyer’s Comparison Table — 2026. For a broader evaluation of the best PPM software platforms including implementation considerations, the full comparison covers six leading solutions.
| Capability | Profit.co | Planview | MS Project Online | Smartsheet | Monday.com |
|---|---|---|---|---|---|
| Resource capacity forecasting | Native, role + individual | Native, enterprise depth | Limited, Power BI needed | Partial, via dashboards | Not native |
| Financial forecasting + EVM | Native with EVM | Full EVM suite | Basic, no EVM | Not available | Not available |
| Scenario modeling | Investment + resource scenarios | Full scenario comparison | Not available | Not available | Not available |
| OKR / strategic goal integration | Native — OKR + PPM in one platform | Separate tool required | Separate tool required | Separate tool required | Separate tool required |
| Automated board reports | AI-generated from live data | Template-based | Manual export required | Dashboard exports | Manual |
| IT portfolio maturity support | Level 2-5 | Level 3-5 | Level 1-3 | Level 1-2 | Level 1 |
| Implementation timeline | 2-4 weeks | 3-6 months | 4-8 weeks | 1-2 weeks | 1-2 weeks |
For organisations at IT portfolio maturity Level 3 or above, the minimum requirement is native scenario modeling, financial forecasting with EVM, and OKR or strategic goal integration. Below Level 3, lighter-weight platforms may be appropriate starting points with a defined upgrade path.
PPM Forecasting Use Cases: How Enterprise Teams Apply It
Portfolio Investment Review – Meridian Software
Context: Sarah Chen, PMO Director, runs a quarterly portfolio review with 14 active projects across three product lines.
How forecasting is applied: The portfolio forecast runs continuously from live Jira and timesheet data. Before each quarterly review, Sarah runs two scenarios: the baseline (current commitments) and a constrained scenario (10% budget reduction applied to the bottom-quartile strategic contributors). The constrained scenario is built and shared in the review itself – not prepared in advance – because the platform generates the comparison in real time.
Outcome
Portfolio review preparation time reduced from 3 days to 4 hours. The constrained scenario identified two projects consuming 18% of portfolio budget at below-threshold strategic contribution – both were deferred in Q3, freeing capacity for one high-priority initiative that had been queued for two quarters.
Resource Reallocation Decision – Vantage Logistics
Context: Marcus Webb, VP Operations, manages a capital project portfolio of 8 infrastructure initiatives. A supplier delay on Project 4 created a 6-week gap in the critical path.
How scenario modeling is applied: Marcus ran a resource reallocation scenario – moving the Project 4 team to Project 7 for the 6-week window and modeling the downstream impact on both projects and on the three projects that shared resources with either. The scenario showed that Project 7 would accelerate by 4 weeks, and that one shared resource (a structural engineer) would be overallocated in Week 4 of the reallocation window – flagged before the move was made.
Outcome
The reallocation was executed with one modification (the structural engineer was backfilled from a sub-contractor pool). Project 7 completed 3.5 weeks ahead of its revised baseline. The overallocation risk that would have caused a delay was identified and resolved before it occurred.
Budget Constraint Scenario – Clearfield Group
Context: Fiona Murphy, Portfolio Director, was asked by the CFO in Week 8 of Q3 to model the impact of a 15% reduction in the IT portfolio budget for the remainder of the year.
How scenario modeling is applied: Fiona built the budget constraint scenario by applying the 15% reduction and running the platform’s prioritisation model against the current portfolio. The platform ranked projects by strategic contribution score (derived from OKR alignment), retained the top 80% of strategic value within the reduced budget envelope, and identified four projects for deferral and one for cancellation.
Outcome
The scenario analysis was completed in 6 hours and presented to the CFO the same week. The CFO approved the portfolio with one modification. Total analysis time: 6 hours versus the previous year’s 11 days.
Connect Your PPM Forecasting to Live OKRs with Profit.co
IT Portfolio Management Maturity Model: Where Does Your Organisation Sit?
The IT portfolio management maturity model defines five levels of portfolio management capability. Understanding your organisation’s current maturity level determines which PPM platform capabilities are prerequisite versus aspirational. For a self-assessment diagnostic, see Profit.co’s PPM maturity assessment, and the detailed maturity model breakdown covering each level’s platform requirements and upgrade triggers.
Level 1 – Ad Hoc
Characteristics: Projects are managed individually with no portfolio view. Resource allocation is negotiated informally. Forecasting does not exist as a formal capability.
Platform requirement: Basic project management tool with task tracking and deadline visibility. Smartsheet or Monday.com are appropriate starting points. The priority at Level 1 is establishing a single source of project truth, not forecasting capability.
Upgrade trigger: When the number of active projects exceeds 10 and resource conflicts are causing delivery failures.
Level 2 – Defined
Characteristics: A portfolio view exists across active projects. Resource allocation is tracked centrally. Portfolio reporting is produced on a defined cadence. Forecasting is manual – PMO analysts maintain forecast models in spreadsheets updated from project status reports.
Platform requirement: A PPM platform with portfolio dashboard, resource allocation view, and financial tracking. The priority is replacing manual reporting with data-driven dashboards.
Upgrade trigger: When manual forecast production consumes more than 2 days per reporting cycle.
Level 3 – Managed
Characteristics: Portfolio forecasting is automated from connected source systems. Resource capacity planning extends at least one quarter forward. Financial forecasting uses actual burn rates rather than planned rates. Portfolio investment decisions are made with scenario analysis – but scenarios are built manually and take 2-5 days to produce.
Platform requirement: A PPM platform with native financial forecasting, integrated resource capacity planning, and EVM support. The priority is reducing scenario analysis time from days to hours.
Upgrade trigger: When portfolio reviews are delayed by scenario preparation time, or when the PMO cannot respond to mid-quarter budget changes without a multi-day analysis cycle.
Level 4 – Quantitatively Managed
Characteristics: Scenario modeling is native and real-time – portfolio scenarios are built and compared in live review sessions. OKR or strategic goal integration connects every project to a measurable strategic outcome. Resource capacity forecasting extends to the annual planning horizon. Financial forecasting includes cost-to-completion estimates with EVM variance thresholds that trigger automatic escalation.
Platform requirement: A fully integrated PPM platform with native OKR management, scenario modeling, EVM, and automated reporting. Profit.co or Planview’s enterprise tier are the primary options at Level 4.
Upgrade trigger: When portfolio forecasting is reliable at the project level but not at the strategic outcome level – the signal that delivery management and strategy management are still disconnected.
Level 5 – Optimising
Characteristics: Portfolio forecasting continuously models strategic outcome probability, not just delivery metrics. AI-driven anomaly detection identifies portfolio risks before they appear in manual review. The PMO operates as a strategic capability rather than a delivery oversight function. Investment decisions at the portfolio level are made in hours, not weeks. For the predictive analytics that enable Level 5, see predictive analytics in PPM: what today’s tools deliver and what’s coming next.
Upgrade trigger: When the platform provides all the data but portfolio decisions are still slow – indicating that the governance model, not the tooling, is the constraint.
How PPM Platforms Integrate with Financial Systems
The reliability of PPM financial forecasts depends entirely on the quality of the financial data feeding them. Platforms that rely on manual financial data entry produce forecasts that are accurate at month-end and unreliable in the three weeks between updates. For the complete guide to PPM vs ERP and project financial management, the full breakdown covers every integration pattern from basic budget tracking to payment-level operations.
| Integration Capability | What It Enables | Risk Without It |
|---|---|---|
| Actuals pull from ERP (Workday, SAP, Oracle, NetSuite) | Budget-vs-actual and cost-to-completion calculated from real spend data | Manual entry produces 2-4 week lag in financial forecast accuracy |
| Budget commitment sync | Committed spend from purchase orders and contracts reflected in portfolio budget | Over-commitment is invisible until invoices arrive |
| Headcount cost integration | Resource cost calculations use actual loaded labour rates, not estimates | Resource scenarios produce inaccurate financial models |
| Multi-currency support | Global portfolio financial positions expressed in a single reporting currency with live FX rates | Manual currency conversion creates reconciliation risk |
| Finance system write-back | Approved portfolio budget changes push to the ERP without re-entry | Dual entry creates version control failures between PPM and finance systems |
Five evaluation questions to ask vendors before selecting a PPM platform:
Update Frequency
What is the update frequency for financial actuals pulled from the connected ERP – real-time, daily batch, or manual trigger?
Integration Direction
Does the platform support bi-directional integration (pulling actuals from finance, pushing approved budgets back) or read-only pull?
Labour Cost Calculation
How are labour costs calculated – from loaded headcount rates defined in the platform, or from actual payroll data pulled from the HRIS?
Data Divergence Handling
What happens when the ERP data and the PPM platform data diverge – which system is treated as the source of truth, and how are reconciliation errors surfaced?
Multi-Currency Support
Is multi-currency support native (with live FX rates) or manual (requiring a PMO analyst to update exchange rates on a defined cadence)?
Common PPM Forecasting Mistakes to Avoid
1. Treating Forecast Data as Planning Data
A forecast is a projection of what will happen given current conditions and trends. A plan is a commitment about what should happen. Using forecast data as a plan – setting targets based on what the forecast shows rather than what strategy requires – produces self-fulfilling mediocrity: the portfolio optimises for what is achievable, not for what is needed.
2. Manual Data Entry in the Forecast Layer
A PPM forecast that requires manual financial or resource data entry from project managers is not a live forecast – it is a monthly survey. Manual entry introduces human error, update lag, and selective optimism into every forecast cycle. Integrate the source systems before committing to any forecasting capability.
3. Running Scenarios in Spreadsheets Outside the Platform
If the scenario modeling exercise involves exporting portfolio data to Excel, building the scenario, and then presenting it separately from the platform, the platform does not support scenario modeling – it supports data export. The scenario must be buildable, comparable, and shareable inside the platform for it to function as a decision support tool.
4. Forecasting at the Project Level Without Portfolio Roll-Up
A project-level forecast shows whether one project is on track. A portfolio-level forecast shows whether the organisation’s entire investment mix is producing the intended strategic return. Organisations that forecast at the project level and aggregate manually produce portfolio views that are always inconsistent – because each project’s forecast uses different assumptions, time horizons, and risk adjustments.
5. Disconnecting Forecasts from Strategic Goals
A portfolio forecast that shows delivery confidence without strategic outcome confidence is a schedule and budget tool, not a portfolio management tool. Before selecting a PPM platform, confirm that the forecast view connects to active strategic goals – OKRs, balanced scorecard objectives, or named strategic priorities.
6. Building Scenarios for Presentation Rather Than Decisions
Scenario modeling that is done to prepare a presentation rather than to support a live decision creates scenarios that are optimised for appearance rather than accuracy. The scenarios that matter are the ones built in the room, with the decision-makers present, with the authority to commit to the chosen option in the same session.
What the Right Platform Does for PPM Forecasting and Scenario Modeling
The most common PPM forecasting failure is not a software problem – it is an architecture problem. Portfolio forecasting data lives in the PPM platform. Strategic goals live in an OKR platform. Financial actuals live in the ERP. Resource actuals live in the HRIS or timesheet system. With four separate systems, no single view is current.
A connected PPM platform closes that gap. Six capabilities it must provide:
| Capability | What It Prevents |
|---|---|
| Native OKR or strategic goal integration | Portfolio forecasts disconnected from strategic outcome probability |
| ERP and financial system integration | Manual financial data entry that produces stale, inaccurate cost forecasts |
| Native scenario modeling (in-platform, not spreadsheet) | Scenario analysis that takes days and cannot be done in a live review session |
| Resource capacity model with forward planning | Resource conflicts identified after commitment rather than before |
| EVM (Earned Value Management) | Financial forecasting that tracks spend without connecting it to schedule and scope progress |
| Automated board-ready reporting | PMO analysts spending 2-3 days per review cycle building presentations from platform data |
Profit.co’s PPM Forecasting and Scenario Modeling Capabilities
Profit.co is the only PPM platform that holds OKR management, project portfolio management, resource management, and financial tracking in a single data layer – so portfolio forecasts are connected to strategic outcomes by architecture, not by integration.
- →
Scenario planning – build, compare, and commit to portfolio scenarios in a live review session, with resource, financial, and strategic outcome impact shown simultaneously across all scenarios.
- →
Financial management and investment tracking – budget-vs-actual, cost-to-completion, and EVM metrics calculated from integrated financial system data, updated automatically on a defined cadence.
- →
Resource capacity planning – forward-looking capacity model at role and individual level, with automatic over-allocation alerts and scenario-based reallocation modeling.
- →
OKR-connected portfolio view – every project in the portfolio linked to the Key Results it is designed to move, with live progress visible in the portfolio forecast as a live strategic contribution metric.
- →
AI-driven project agents – automated anomaly detection surfaces budget, schedule, and resource variance before they become portfolio risks, with AI-generated status reports that replace manual PMO reporting cycles.
- →
100+ integrations including Workday, SAP, Oracle, Jira, and Azure DevOps – so every forecast is built from source-system data, not from manually entered estimates.
PPM Forecasting Best Practices
- ✓
Integrate source systems before activating forecasting – a forecast built on manual data entry is a survey, not a projection.
- ✓
Connect every portfolio project to a strategic goal or OKR – forecasts that do not show strategic outcome probability answer the wrong question.
- ✓
Run scenario modeling inside the platform, not in a spreadsheet – if the scenario cannot be built and compared in a live session, it is not an operational decision support tool.
- ✓
Use EVM metrics (SPI and CPI) as the baseline for financial forecasting – spend-vs-budget alone does not account for whether the work the spend produced is on schedule.
- ✓
Define resource capacity at the role level before the quarter begins – reallocation scenarios require a baseline capacity model to produce meaningful outputs.
- ✓
Establish a warning threshold for portfolio-level metrics (not just project-level) – a portfolio where every project is individually Green but strategically misaligned is not a healthy portfolio.
- ✓
Use scenario modeling to support live decisions, not to prepare presentations – the scenario that matters is the one built with decision-makers in the room.
- ✓
Review forecast accuracy after every quarter – compare forecast-vs-actual across resource, financial, and strategic dimensions to identify which forecast assumptions are consistently wrong.
Make Your Next Portfolio Review a Decision Session, Not a Status Update
PPM Forecasting and Scenario Modeling Questions and Answers
PPM forecasting is the capability that projects the expected outcomes of a project portfolio – resource availability, financial burn, schedule confidence, and strategic goal contribution – forward in time. It differs from project tracking in that it operates across the full portfolio simultaneously, enabling portfolio leaders to identify emerging risks and make resource decisions before they become delivery failures.
Scenario modeling in PPM is the capability that allows portfolio leaders to test the impact of hypothetical decisions – adding or removing a project, reallocating a team, applying a budget constraint – on the full portfolio before committing to them. A mature scenario modeling capability runs inside the PPM platform, enables side-by-side comparison of two or more scenarios, and shows resource, financial, and strategic outcome impact simultaneously.
The IT portfolio management maturity model defines five levels: Level 1 (Ad Hoc – individual project tracking, no portfolio view), Level 2 (Defined – portfolio dashboard, manual forecasting), Level 3 (Managed – automated forecasting, manual scenario analysis), Level 4 (Quantitatively Managed – real-time scenario modeling, OKR integration), and Level 5 (Optimising – AI-driven anomaly detection, continuous strategic outcome forecasting). Each level defines the platform capabilities required and the upgrade trigger that indicates readiness to move to the next level. See the full maturity model breakdown for detailed assessment criteria.
PPM financial integration pulls actuals from ERP systems (Workday, SAP, Oracle, NetSuite) on a defined cadence, calculates cost-to-completion and EVM metrics from real spend data, and in bi-directional integrations, pushes approved budget changes back to the finance system without re-entry. The critical evaluation question is update frequency – integrations that batch-update weekly produce forecasts that are stale for 6 of every 7 days.
Project Portfolio Management (PPM) governs the execution of a portfolio of projects – evaluating resource allocation, financial performance, and delivery confidence across active initiatives. Strategic Portfolio Management (SPM) extends that scope to include the investment decision layer – evaluating which projects should be funded, deferred, or cancelled based on their alignment to strategic goals and OKRs. Modern PPM platforms with OKR integration and scenario modeling capabilities operate across both domains.
Project management tools track individual project execution – tasks, timelines, and team collaboration within a single project. PPM platforms govern the full portfolio – evaluating which projects to fund, forecasting portfolio-level resource and financial outcomes, modeling investment scenarios, and connecting delivery performance to strategic goals. PPM is the strategic layer above project management, not a more powerful version of it.
OKR integration changes the question PPM forecasting answers – from whether a project will deliver on time and on budget, to whether the portfolio will deliver the strategic outcomes committed to this quarter. Without OKR integration, a portfolio can achieve 100% on-time and on-budget delivery while contributing nothing to the organisation’s strategic priorities. With OKR integration, every forecast shows delivery confidence and strategic contribution simultaneously – making portfolio reviews strategy conversations, not status updates.


