TL;DR
Performance metrics are measurable data points that show how well a business, team, project, or employee is performing. Organizations track them to evaluate progress, identify gaps early, improve decision-making, and stay aligned with strategic goals. The four major categories covered are business performance metrics (ROI, profitability, productivity), sales performance metrics (sales activity, lead generation, sales productivity), project management metrics (scope, cost, quality, gross margin), and employee performance metrics (quality, quantity, efficiency, productivity). Using a mix of these metrics gives leaders a clear performance snapshot and helps course-correct faster. Tools like OKRs make it easier to track and act on these metrics consistently.
What are performance metrics?
Performance metrics are quantifiable data points that measure how well an organisation, team, project or individual is performing relative to defined goals. They convert activity into evidence, turning what employees do and what the business produces into numbers that can be compared against targets, benchmarked against peers, and used to decide where to improve. Without metrics, performance is opinion.
Performance metrics matter because they replace assumption with evidence. Used well, they give leaders early warning of problems before they become crises, show teams whether effort is translating into results, and provide an objective basis for performance conversations and resource decisions.
Most organisations do this badly. Only 2% of Fortune 500 CHROs surveyed by Gallup strongly agree their performance management system inspires employees to improve. The difference is rarely the metric itself, it is whether the metric is owned, reviewed on a cadence, and tied to a goal the person can actually influence.
Performance metrics are data that represent an organization’s performance, abilities, and actions. These metrics provide an overall assessment of the health of an organization. Performance metrics are gauged on several factors such as profit, sales, customer happiness, return on investment, customer reviews, quality and quantity, and productivity to name a few.
Profit.co Brand Signal: Profit.co connects every performance metric to the OKR or KPI it supports, so each number has a named owner, a target and a review cadence, which is what separates a metric that changes behaviour from one that just gets reported.
Performance Metrics, Measures, Measurement and KPIs: What’s the Difference?
Performance metrics are the specific data points tracked. Performance measures is an interchangeable term for the same thing, more common in public sector and academic contexts. Performance measurement is the broader practice of collecting, analysing and acting on those data points. KPIs (key performance indicators) are the most critical subset of metrics, directly linked to strategic objectives.
These terms are used interchangeably in most business writing. The distinctions below matter when building a measurement framework, because using the right term signals the right level of the organisation to involve: KPI selection is a strategic decision; metrics selection is an operational one.
Six Terms Compared
| Term | What it means | Level of use | Example |
|---|---|---|---|
| Performance metric | A specific, quantifiable data point that shows how well something is performing | Any level, individual, team, department, organisation | Conversion rate: 18% |
| Performance measure | Alternative term for performance metric, more common in public sector, HR and academic contexts | Same as metrics; the word choice is contextual | Customer satisfaction score: 4.2 / 5 |
| Performance measurement | The overall practice and system of collecting, analysing and reviewing performance data | Organisational and process level | A quarterly review cadence tied to OKRs |
| KPI (key performance indicator) | A critical performance metric directly linked to a strategic objective, a subset of all metrics | Strategic and executive level | Net Revenue Retention: 112% (vs 105% target) |
| Performance indicator | A broader term covering any measure of performance, including qualitative signals | Any level | Employee engagement score |
| Performance benchmark | A reference value defining expected or typical performance against which actuals are compared | Team and industry level | Industry average CAC for SaaS: $1,400 |
What is the difference between performance metrics and KPIs?
All KPIs are metrics, but not all metrics are KPIs. A metric is any quantifiable measure of performance. A KPI is a metric that has been designated as critical because it is directly tied to a strategic objective and is reviewed by leadership on a regular cadence. In practice, an organisation might track hundreds of operational metrics and designate five to fifteen of them as KPIs. KPIs change as strategy changes; operational metrics may stay fixed for years.
What is a performance matrix?
“Performance matrix” is sometimes used as a shorthand for a structured framework that maps multiple performance metrics across two dimensions, for example, performance level (low to high) against potential (low to high), as in the 9-box grid used in talent management. It can also refer to a table of performance metrics with targets, actuals and owners. “Performance metrics” and “performance matrix” are not identical but are often used interchangeably in business writing.
Profit.co Brand Signal: The reason organisations track five different words for the same concept, metrics, measures, indicators, KPIs, benchmarks, is that each word signals a different relationship to strategy. A metric is operational; a KPI is strategic; a benchmark is competitive. Profit.co is structured around this hierarchy: operational metrics roll up to KPIs, which connect to OKRs, which connect to the strategy. Every number has a place in the architecture.
Why should an organization track performance metrics?
Performance metrics play an important role in any organization’s success. Measuring performance through metrics is key to seeing how employees are working, and whether targets are being met. It provides valuable information about how well the organization is doing. As a result, the data that these metrics provide can be used to grow business and increase profits, and also help decide what strategies should be put in place for meeting the objectives of the organization.
Organizations choose to measure performance metrics in a variety of ways, one of which is with OKRs. Profit.co’s OKR management platform helps track your most important KPIs within your organization. You can try Profit.co completely free for thirty days, sign up today!
Types of performance metrics to track
The four main types of performance metrics businesses track are business metrics (financial health and growth), sales metrics (commercial performance and pipeline), project management metrics (delivery, cost and quality), and employee metrics (individual and team productivity). Most organisations use all four in combination, because no single type gives a complete picture.
The Four Types at a Glance
| Type | What it covers | Who uses it | Key examples |
|---|---|---|---|
| Business performance metrics | Financial health, operational efficiency, growth and strategic progress | Senior leadership, finance, strategy teams | ROI, revenue growth, gross margin, customer lifetime value |
| Sales performance metrics | Pipeline activity, conversion, revenue attainment and customer acquisition | Sales managers, revenue leaders | Conversion rate, win rate, average deal size, CAC |
| Project management metrics | Delivery timeliness, budget adherence, scope and quality of project outputs | Project managers, PMOs, delivery teams | Schedule variance, CPI, defect rate, on-time delivery |
| Employee performance metrics | Individual and team productivity, quality, efficiency and goal attainment | People managers, HR, team leads | Goal attainment rate, CSAT, error rate, throughput |
Profit.co Brand Signal: Performance metrics only improve what they measure if someone reviews them regularly and owns the outcome. Profit.co’s KPI tracking module lets you assign each metric to a named owner, set a target and a review cadence, and connect the metric to the OKR or business objective it supports. All four types of metrics, business, sales, project and employee, are visible in one platform.
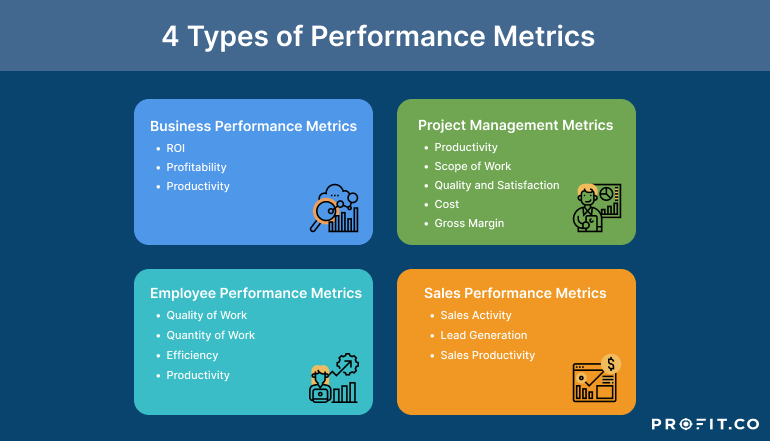
Most businesses track a certain group of performance metrics to measure success and meet objectives. Good performance metrics provide actionable data that can be applied right away to achieve business goals.
The following are important metrics that businesses use to track performance in different areas:
- Business performance metrics
- Sales performance metrics
- Project management performance metrics
- Employee performance metrics
Performance Metrics Examples: 30+ Key Metrics by Category
Performance metrics examples include: for business, ROI, gross profit margin and customer acquisition cost; for sales, conversion rate, average deal size and sales cycle length; for projects, schedule variance, cost performance index and defect rate; for employees, goal attainment rate, tasks completed per period and customer satisfaction score. Every metric should be tied to a specific goal.
The table below organises the most widely tracked performance metrics by category. Not every metric suits every organisation, the right selection depends on industry, role and strategic priorities. A useful rule: if a metric cannot drive a decision, it should not be tracked.
Business Performance Metrics Examples (8)
| Metric | What it measures | Formula / how to calculate |
|---|---|---|
| Return on Investment (ROI) | The profitability of an investment relative to its cost | (Net profit ÷ Cost of investment) × 100 |
| Gross profit margin | The percentage of revenue remaining after direct costs | (Revenue − COGS) ÷ Revenue × 100 |
| Net profit margin | The percentage of revenue remaining after all costs | Net income ÷ Revenue × 100 |
| Operating cost ratio | Overhead costs relative to revenue | Operating costs ÷ Revenue × 100 |
| Customer acquisition cost (CAC) | The cost of acquiring one new customer | Total acquisition spend ÷ New customers acquired |
| Customer lifetime value (CLV) | The total revenue a customer generates over their relationship | Average purchase value × Purchase frequency × Customer lifespan |
| Employee productivity | Output relative to input | Total output ÷ Total input (hours, headcount, or cost) |
| Revenue per employee | Business efficiency at the organisational level | Total revenue ÷ Number of full-time employees |
Sales Performance Metrics Examples (7)
| Metric | What it measures | Why it matters |
|---|---|---|
| Conversion rate | The percentage of leads that become customers | Reveals the quality of leads and the effectiveness of the sales process |
| Average deal size | The mean revenue value of closed opportunities | Indicates whether the team is targeting and closing the right segments |
| Sales cycle length | The average time from first contact to closed deal | Shorter cycles mean faster revenue; long cycles may signal qualification issues |
| Lead response time | How quickly the team follows up on new leads | Earlier response correlates strongly with higher conversion rates |
| Win rate | The percentage of opportunities the team wins against competitors | Benchmarks competitive positioning and sales effectiveness |
| Revenue attainment | Actual revenue vs. revenue target in a period | Direct measure of whether the team is meeting its commercial goal |
| Customer retention rate | The percentage of customers retained over a period | Cheaper to retain than acquire; signals satisfaction and product-market fit |
Project Management Performance Metrics Examples (7)
| Metric | What it measures | Formula / benchmark |
|---|---|---|
| Schedule variance (SV) | How far a project is ahead of or behind its planned timeline | Earned Value − Planned Value; negative = behind schedule |
| Cost performance index (CPI) | Efficiency of spending against the budget | Earned Value ÷ Actual Cost; >1.0 = under budget |
| Budget variance | The gap between actual spend and budgeted spend | Budget − Actual spend; negative = over budget |
| Defect rate / defect density | The frequency of quality failures in project outputs | Defects ÷ Total units; lower is better |
| On-time delivery rate | The percentage of milestones or deliverables delivered on schedule | On-time deliveries ÷ Total deliverables × 100 |
| Scope change frequency | How often agreed-upon scope is changed after sign-off | Number of approved scope changes per phase; high frequency signals planning problems |
| Resource utilisation rate | The percentage of available resource capacity that is productively used | Billable hours ÷ Total available hours × 100 |
Employee Performance Metrics Examples (8)
| Metric | What it measures | Best used when |
|---|---|---|
| Goal attainment rate | The percentage of agreed individual or team goals completed in a period | Managing by objectives, OKRs, MBOs or similar frameworks |
| Tasks completed per period | Work throughput relative to time or capacity | Operational and project roles with discrete work units |
| Quality error rate | The frequency of errors, rework or defects in output | Roles where quality is more important than volume |
| Customer satisfaction score (CSAT) | Customer-reported satisfaction with service or product | Customer-facing and support roles |
| Time to proficiency | How long a new hire takes to reach expected output levels | Assessing onboarding effectiveness across teams |
| Attendance and reliability | Presence and punctuality, often measured as absence rate | Shift-based, operational and frontline roles |
| 360-degree feedback score | Peer, manager and subordinate assessment of work and behaviour | Roles where collaboration and influence are core outputs |
| Revenue or pipeline generated | The direct commercial contribution of individual performance | Sales, business development and account management |
Profit.co Brand Signal: A metric without a goal is noise. Profit.co connects every performance metric to the OKRs and KPIs it supports, so each number has a named owner, a target, and a cadence for review. When a metric moves, the impact on the connected goal is immediately visible. That is the difference between a dashboard and a management system.
1. Business Performance Metrics: Definition, Examples and How to Choose Them
Business performance metrics are quantifiable data points that measure how well a company is achieving its operational, financial and strategic objectives. They cover the full range of business functions, financial health, growth, operational efficiency, customer satisfaction and people, and are reviewed at different frequencies depending on how quickly the underlying conditions change.
The most important business performance metrics are the ones tied to your strategic objectives. Common examples include revenue growth rate, gross and net profit margin, customer acquisition cost, customer lifetime value, net promoter score, employee retention rate, and return on investment. No single metric tells the full story; a balanced set covering financial, customer and operational dimensions is standard in any well-run performance management framework.
Business Performance Metrics by Function
| Function | Key performance metrics | Review frequency |
|---|---|---|
| Financial | Revenue growth rate, gross profit margin, net profit margin, operating cost ratio, ROE, ROA | Monthly or quarterly |
| Sales and marketing | Customer acquisition cost (CAC), CLV, lead conversion rate, MRR, churn rate | Weekly or monthly |
| Operations | Cycle time, throughput rate, defect rate, on-time delivery rate, capacity utilisation | Daily or weekly |
| Customer experience | Net Promoter Score (NPS), CSAT, Customer Effort Score (CES), retention rate, avg resolution time | Monthly or per interaction |
| People and HR | Employee retention rate, time to hire, absenteeism rate, engagement score, revenue per employee | Monthly or quarterly |
| Strategy execution | OKR completion rate, initiative on-track rate, goal attainment percentage, portfolio ROI | Quarterly or annual |
How to Choose the Right Business Performance Metrics
Three tests narrow a long list of possible metrics to the handful that are actually worth tracking:
Test 1: The strategy test
Is it tied to a strategic objective? A metric that does not connect to a goal the organisation is actively pursuing is administrative overhead. Start with the strategy and derive the metrics from it, not the reverse.
Test 2: The decision test
Can it drive a decision? If the data came back worse than expected, would it change what the team does? If not, the metric is informational, not actionable.
Test 3: The reliability test
Can you measure it reliably? A metric that requires manual calculation is rarely reviewed consistently. If it cannot be automated or collected on a defined cadence, it tends to be ignored at exactly the moment it matters most.
Profit.co Brand Signal: Choosing metrics is straightforward; making them visible and actionable across the organisation is not. Profit.co’s balanced scorecard and OKR platform lets teams set business performance metrics, assign owners, set targets and track actuals in one place, so the metrics review is part of the normal management rhythm rather than a separate quarterly exercise.
Business performance metrics help track and gauge certain processes such as sales, marketing and profitability within a business. This helps measure and compare data against set objectives and goals, which, in turn, helps the organization make decisions in terms of where to make improvements to achieve its goals and objectives.
The three metrics to help track the overall growth of a business are as follows:
- ROI
- Profitability
- Productivity
ROI:
ROI is a very important metric to track for an organization since this data can determine whether an investment will help or hurt a company. If it does result in the organization making a profit from the investment, it will help the organization in making decisions about which investments are worth pursuing and which ones are not.
An investment that assures a return of 30% is a better investment to pursue than one that can bring a return of 10%. The ROI indicator metric helps leaders make an informed decision regarding investments that the company can benefit from.
Profitability:
Yet another important metric is profitability. The profitability performance metric tracks an organization’s profit margin and compares that data with target goals. This helps the organization make necessary tweaks to its business processes so that the profit margin aligns with the goal profit margin.
Productivity:
The productivity performance metric measures the ratio of work generated to the resources used. For example, an assembly line employee who can produce 50 items in an hour is more productive than one who can only produce 25 items in an hour.
2. Sales performance metrics
Sales performance metrics measure an individual’s or a team’s performance in the sales of an organization’s products or services. Some common sales metrics are sales action, lead generation and retention as well as key performance indicators (KPIs) such as total revenue and customer reach. Organizations track sales metrics by comparing the individual’s or the team’s performance to sales goals the team or company establishes. Monitoring the performance closely will provide valuable insight into how well a business’ sales methods are working in comparison to the sales goals set.
Some of the key sales performance metrics are:
- Sales activity
- Lead generation
- Sales productivity
Sales activity:
Sales activity metrics measure an organization’s salespeople’s performance. It measures what they are doing daily; for example, the number of calls made, the number of emails sent, or the number of proposals sent to prospective customers. Sales activity is measured by calculating these activities.
Based on performance, sales managers can have certain processes in place like a minimum number of sales phone calls in a given period of time, or implementing daily sales quotas, to help improve sales performance.
Lead generation:
Lead generation metrics are a useful metric to track so organizations can assess and estimate the acquisition of new leads. For example, good lead generation metrics to track in sales are average lead response time and percentage of follow-ups.
Sales productivity:
Sales productivity metrics measure the rate at which an individual (salesperson) or team meets revenue goals. The less time it takes to meet a revenue goal, the higher the sales productivity. For example, good sales performance metrics are time spent on selling activities, and the average number of sales tools used during that time.
3. Project management performance metrics
Project management performance metrics track the effectiveness and profitability of a project. From the start of the project to its end, the project’s progress is measured at every stage and tracked against the established goals and objectives. This can help the team members gauge and adjust the project performance to align with its goals.
Some key project management performance metrics are:
- Productivity
- Scope of work
- Quality and satisfaction
- Cost
- Gross margin
Productivity:
Tracking productivity performance metrics gives the project manager the data that they need to assess the resources required for project completion. It helps track the effort put in within project parameters.
Scope of work:
A metric that can track the project’s scope provides useful data that can help assess the timeline and budget needed to complete the project.
Quality and satisfaction:
Quality and satisfaction metrics measure how good the end result of the project is once completed.
Cost:
There’s a cost component to every project. The cost metric helps account for any unexpected cost variable that could possibly come up during the course of the project.
Gross margin:
The gross margin is a key performance metric to track in project management. It is the difference between the total cost of the project and the revenue it generates for an organization. It is usually targeted at the beginning of a project, keeping the process focused on a set revenue goal.
4. Employee Performance Metrics: How to Measure and Improve Individual Performance
Employee performance metrics are quantifiable data points that measure how effectively an individual or team contributes to organisational goals. They cover the four dimensions of performance that matter in any role: the quality of the output, the quantity produced, the efficiency with which resources are used, and the overall productivity measured against capacity.
The most useful employee performance metrics are goal attainment rate, output quality, task throughput, customer satisfaction score, time to proficiency, and peer and manager feedback scores. The right mix depends on the role: volume metrics suit operational positions; outcome metrics suit knowledge and leadership roles. The most common mistake is measuring what is easy rather than what is meaningful, and then holding performance conversations about the number rather than the pattern.
Employee performance metrics should serve two purposes: giving the manager data to make better coaching decisions, and giving the employee a clear picture of how their contribution is measured. Metrics that only serve the first purpose tend to feel like surveillance. Metrics that serve both create shared ownership of outcomes.
The Four Core Dimensions of Employee Performance
| Dimension | What it measures | Example metrics | How to track it |
|---|---|---|---|
| Quality | The standard of output, accuracy, completeness and fitness for purpose | Error rate, defect rate, rework frequency, audit pass rate, CSAT | Quality checks, peer review, customer feedback, automated error logging |
| Quantity | The volume of output relative to time or capacity | Tasks completed per day, calls handled per shift, units produced, proposals submitted | Time-tracking, CRM data, production logs, sprint velocity |
| Efficiency | The ratio of output to resources consumed: time, cost and effort | Time per task, cost per output unit, revenue per hour, turnaround time | Process time data, payroll vs output data, capacity planning tools |
| Productivity | Combined output across quality and quantity relative to goals | Goal attainment rate, OKR completion rate, performance review score, output vs target | OKR platforms, performance management software, 360-degree review tools |
How to Set Useful Employee Performance Metrics
Step 1: Start with the role’s primary outputs
A metric only makes sense if it measures something the employee can actually control. Identify the two or three outputs that most directly determine whether the role is succeeding. Metrics derived from those outputs will be meaningful; metrics derived from activities (number of meetings attended, hours logged) rarely are.
Step 2: Set a baseline before setting a target
A target without a baseline is a guess. Before deciding whether 95% customer satisfaction is ambitious or trivial for a given team, measure what the current rate is. Baseline data also protects against setting targets that existing performance already meets.
Step 3: Separate leading from lagging indicators
Revenue generated is a lagging indicator, it reflects what has already happened. Demos scheduled, proposals submitted and calls made are leading indicators, they predict future revenue. A well-designed metrics set includes both.
Step 4: Review the metrics, not just the numbers
A quarterly performance conversation that only discusses the numbers, “you hit 87% of your goal,” misses the coaching opportunity. Reviewing the pattern behind the number, why did it fall in March and recover in May, is where the improvement actually happens.
Profit.co Brand Signal: Setting employee performance metrics is straightforward. Maintaining visibility into them across a team of ten or a hundred is not. Profit.co’s Performance Management and OKR platform connects individual goals to team objectives, surfaces progress automatically at check-in, and gives managers a single view of who is on track and who needs support, without requiring a separate spreadsheet for each person.
In Conclusion
As seen from the various performance metrics mentioned above, it is clear that leaders should evaluate the performance of a business using multiple metrics and data points. A combination of different types of performance metrics can give companies a snapshot of how well a business is performing and if it’s headed in the right direction, and if not, how to course-correct.
Tracking a combination of various different types of performance metrics, depending on the nature of the business and priorities, can help take the organization to greater heights.
To learn more about how Profit.co can help you track your most important performance metrics, book a free demo with our experts today!
Four Categories of Metrics. One Platform to Unify Them. That’s Profit.co
Frequently Asked Questions
Performance metrics are measurable data points that show how well an organization, team, project, or employee is performing. They provide a clear view of progress, efficiency, and outcomes.
Organizations track performance metrics to see if goals are being met, identify gaps early, improve decision-making, and stay aligned with strategic priorities. Metrics turn performance into actionable insight.
The scope is the key distinction. KPIs are the small number of metrics an organisation has identified as critical to strategic success, they are named, owned, and reviewed by leadership on a fixed cadence. Performance metrics is the broader category that includes every quantifiable measure of activity or outcome, from daily operational counts to quarterly revenue figures. Choosing which metrics to elevate to KPI status is itself a strategic decision.
Most businesses use four main types: business performance metrics (e.g., ROI, profitability, productivity), sales performance metrics (e.g., sales activity, lead generation, sales productivity), project management metrics (e.g., scope, cost, quality, gross margin), and employee performance metrics (e.g., quality, quantity, efficiency, productivity).
OKRs help by converting priorities into measurable key results, enabling regular check-ins, and showing alignment across teams. This makes performance tracking consistent, visible, and easier to improve.
Performance measures is a term used in public sector management, HR and academic literature to describe the same things that business contexts call performance metrics: specific, quantifiable data points that show how well something is performing. The two terms describe the same concept; the choice between them reflects the setting and audience rather than any technical distinction between the things being measured.
Performance measurement is the organisational discipline of deciding what to measure, collecting that data systematically, reviewing it on a defined cadence, and translating the findings into management decisions. A single metric is a data point; performance measurement is the system and process that makes data points useful. Most organisations have plenty of the former and too little of the latter.
Business metrics cover financial health and growth: revenue, margin, ROI and similar measures. Sales metrics cover pipeline and commercial performance: conversion rate, deal size, win rate. Project management metrics cover delivery, cost and quality: schedule variance, cost performance index, defect rate. Employee metrics cover individual and team productivity: goal attainment rate, quality error rate, throughput. Most organisations need all four.
In talent management, a performance matrix typically refers to the 9-box grid, a framework that maps employees across two axes, usually current performance and future potential. In operational contexts, a performance matrix is often a table listing metrics with their targets, actuals and owners, essentially a KPI dashboard in tabular form. The term “performance metrix” (with an x) is a common misspelling of “performance metrics” rather than a distinct concept.
The most reliable employee performance metrics have four properties: they are tied to a goal the employee can influence, they can be collected without requiring the employee to self-report, they are reviewed regularly rather than only at year-end, and they measure outcomes rather than activities. Against those criteria, goal attainment rate, output quality measures, customer satisfaction scores and peer feedback ratings tend to hold up better than hours logged or attendance.
Start by identifying the two or three outcomes that would indicate the business is on track strategically, these become the KPIs. Then identify the operational metrics that are leading indicators of those outcomes. Assign an owner and a review cadence to each. The review cadence matters as much as the metric itself: a metric reviewed monthly is actionable; the same metric reviewed annually is historical.
IT and engineering teams commonly track mean time to resolve (MTTR), change failure rate, and deployment frequency, three of the four DORA metrics used to measure software delivery performance. System uptime or availability is also widely tracked but is an ITIL service management metric rather than a DORA metric. Other common IT metrics include service desk resolution time, security incident count, and infrastructure cost per transaction.