

The Progress S-Curve widget lets you compare how much work your project has actually completed against how much the schedule expected by now, right from the project dashboard. A single SPR score alongside the chart tells you whether the project is ahead, on track, or behind.
Table of Contents
What is the Progress S-Curve Widget?
The Progress S-Curve widget is a chart on the project Dashboard tab that plots two lines over the project timeline: Actual Progress, a solid line built from real task completions rolling up through milestones, and Planned Progress, a dashed line built from the planned start and end dates set on tasks and milestones.
Three figures sit above the chart: Actual Progress, Planned Progress, and SPR (Schedule Performance Ratio), the ratio of the two that tells you whether the project is ahead of, on, or behind schedule. A time interval selector lets you switch the chart's resolution, and a notice bar flags any items without scheduled dates.
| Line | Where the Data Comes From |
|---|---|
| Actual Progress | Real task completions rolling up through milestones to the project, the same value shown in the project's Progress field. |
| Planned Progress | Planned start and end dates set on tasks and milestones, calculated as of the current reference date. |
Because Planned Progress is derived entirely from scheduled dates, the widget is only fully informative once your project's tasks and milestones carry planned start and end dates.
Why the Progress S-Curve Widget Matters?
Before this widget, confirming schedule health meant manually comparing individual task due dates against completion status across the project. The S-Curve puts Actual Progress and Planned Progress on one chart with a single SPR score, so the comparison takes one glance instead of a manual audit.
How It Works?
Step 1
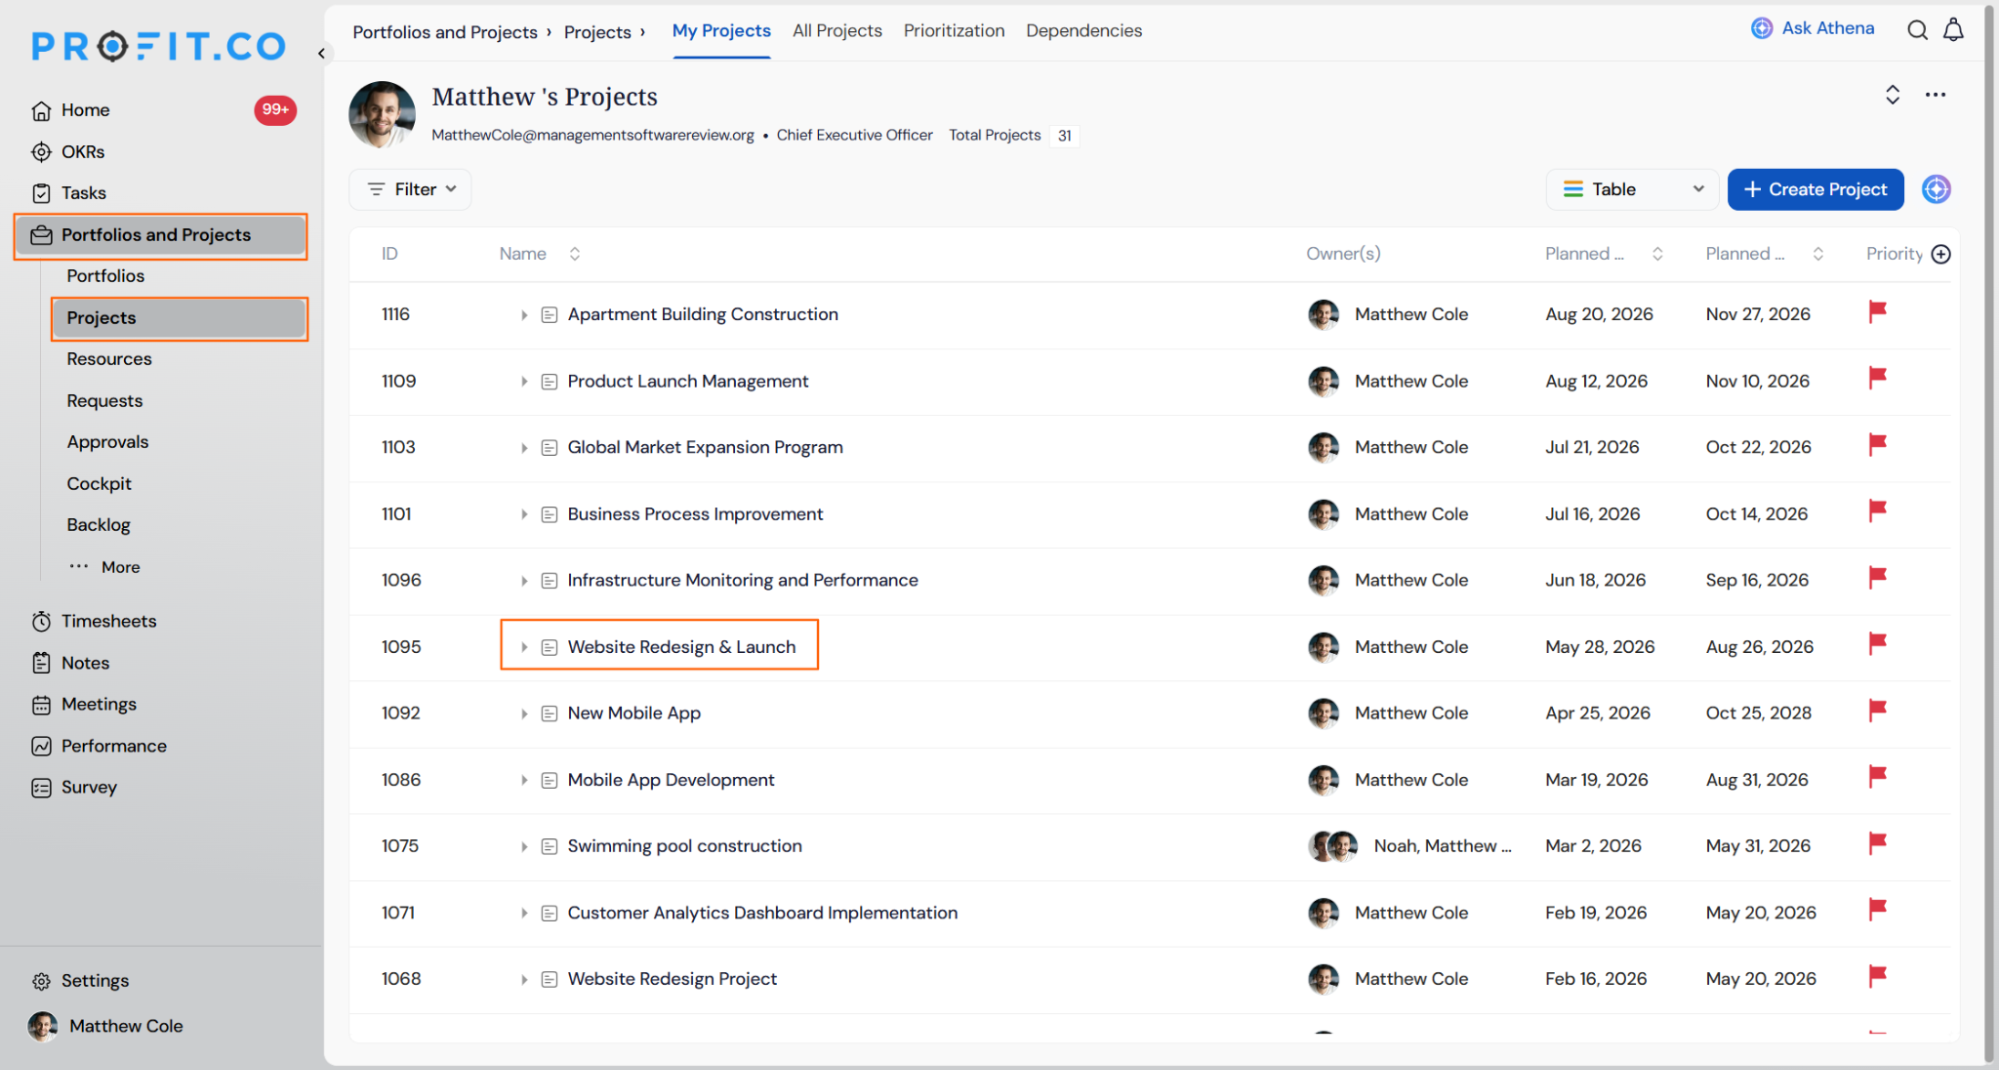
- Navigate to Portfolios and Projects → Projects.
- Open the project you want to review.
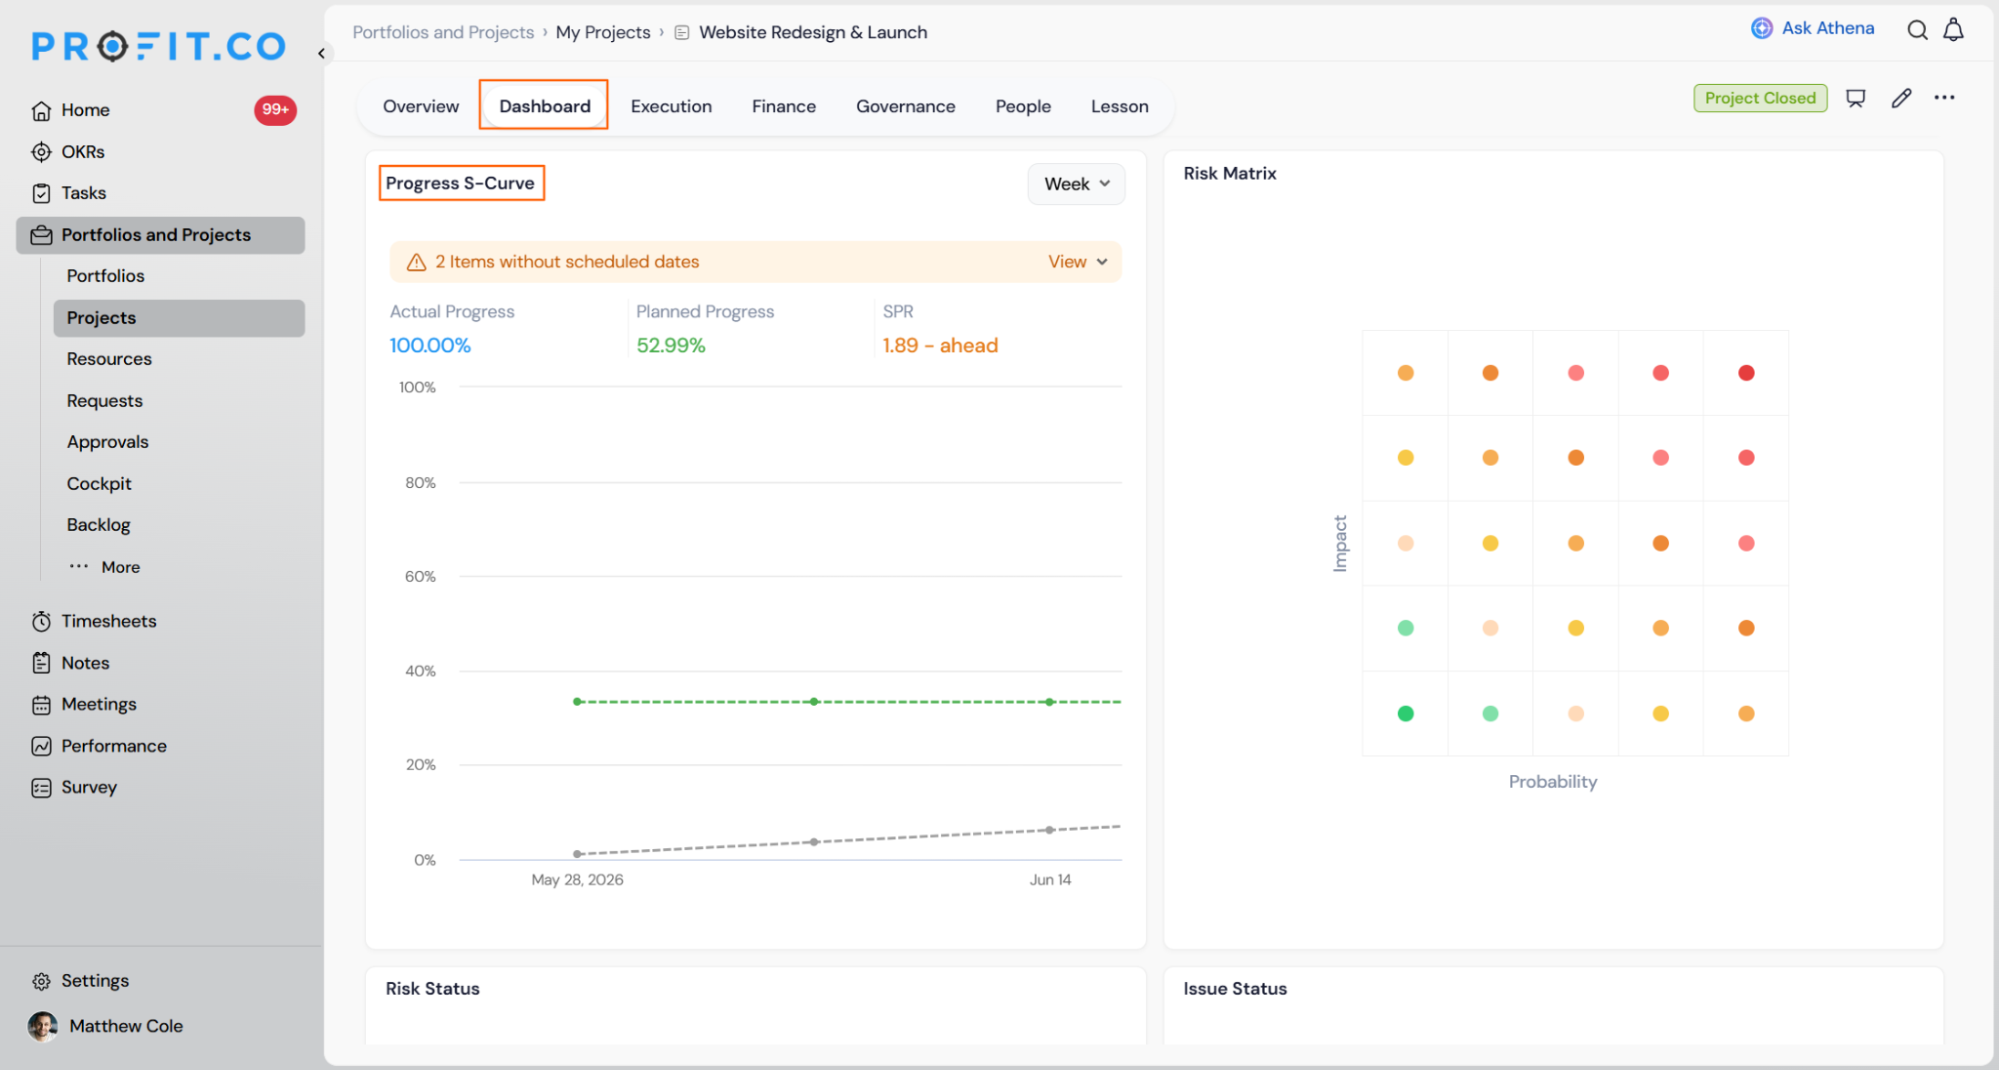
- Click the Dashboard tab.
- Locate the Progress S-Curve widget on the Dashboard tab.
- Review the Actual Progress, Planned Progress, and SPR figures above the chart.
- Identify the solid Actual Progress line and the dashed Planned Progress line.
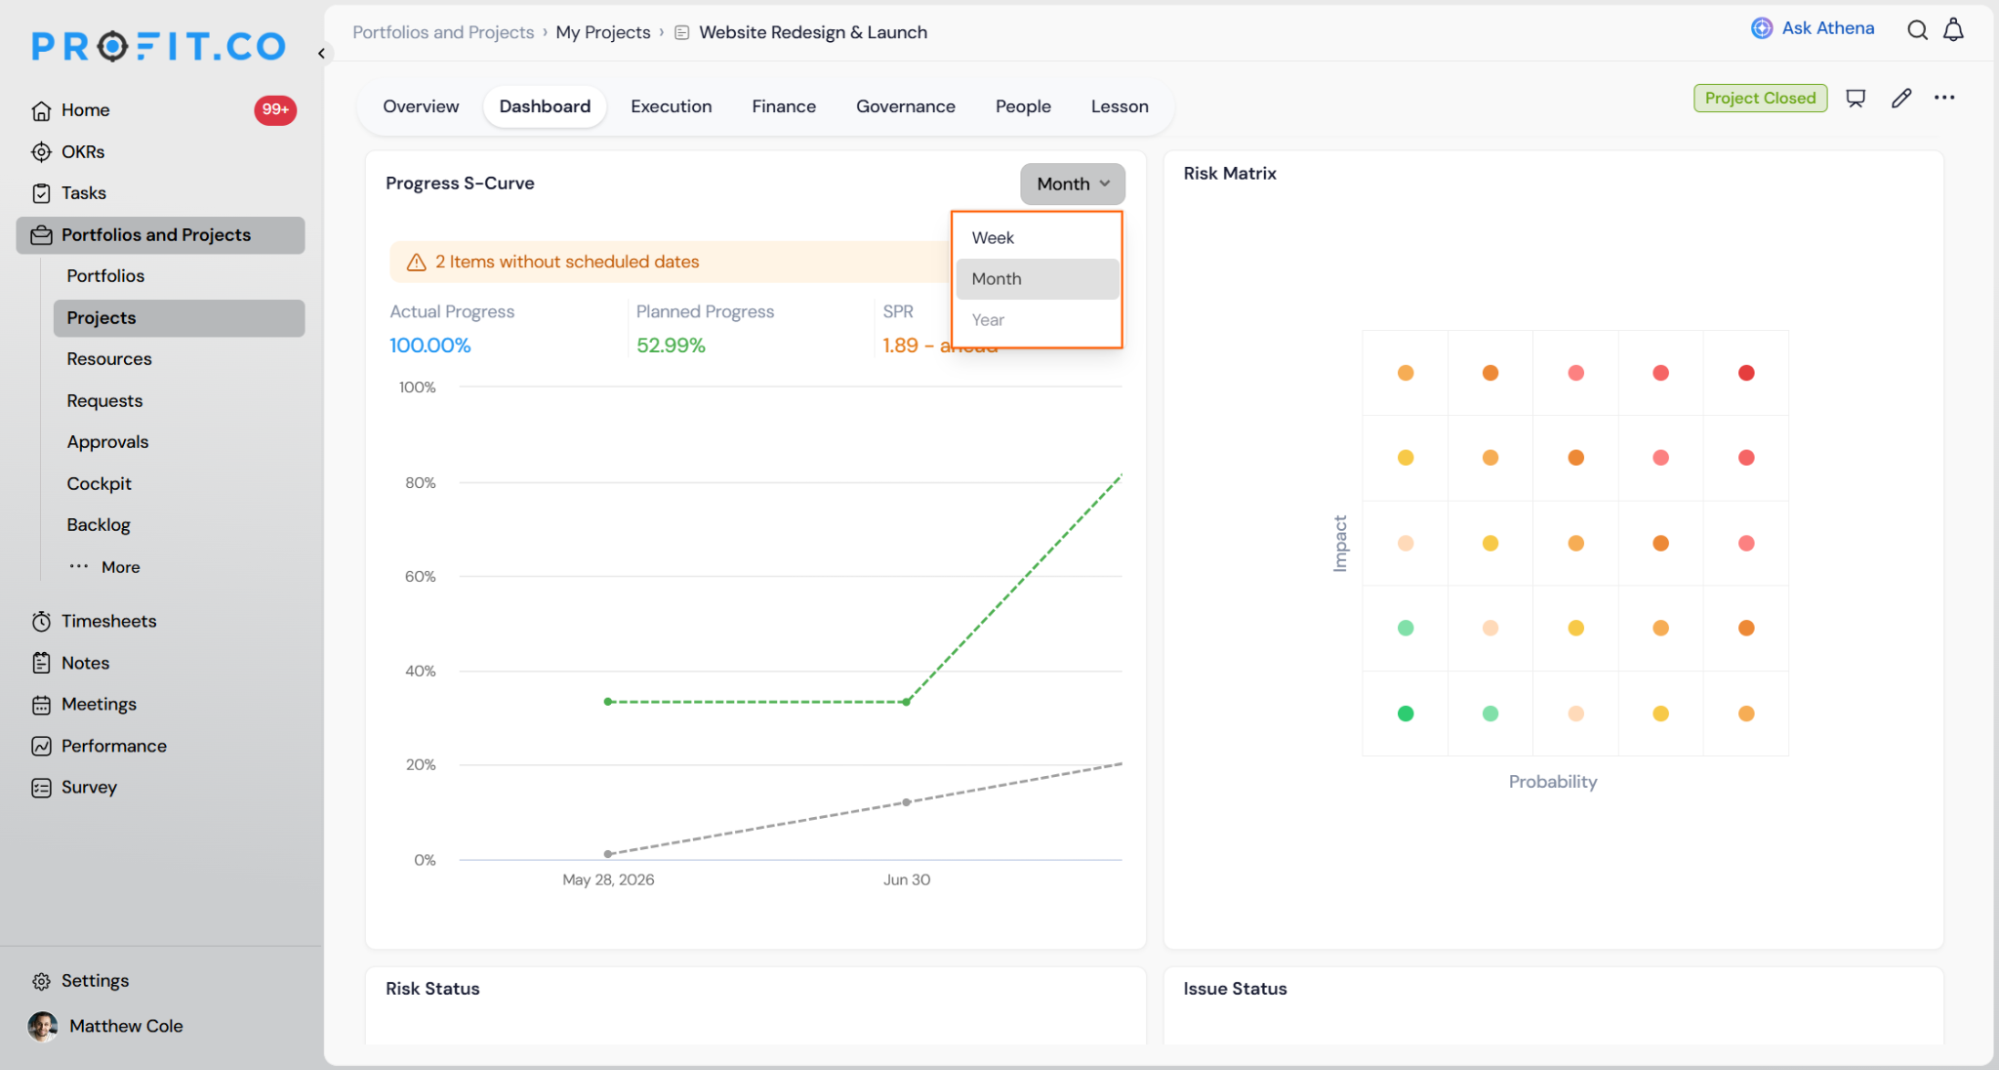
- Click the time interval selector in the widget header.
- Switch between Week and the other available intervals.
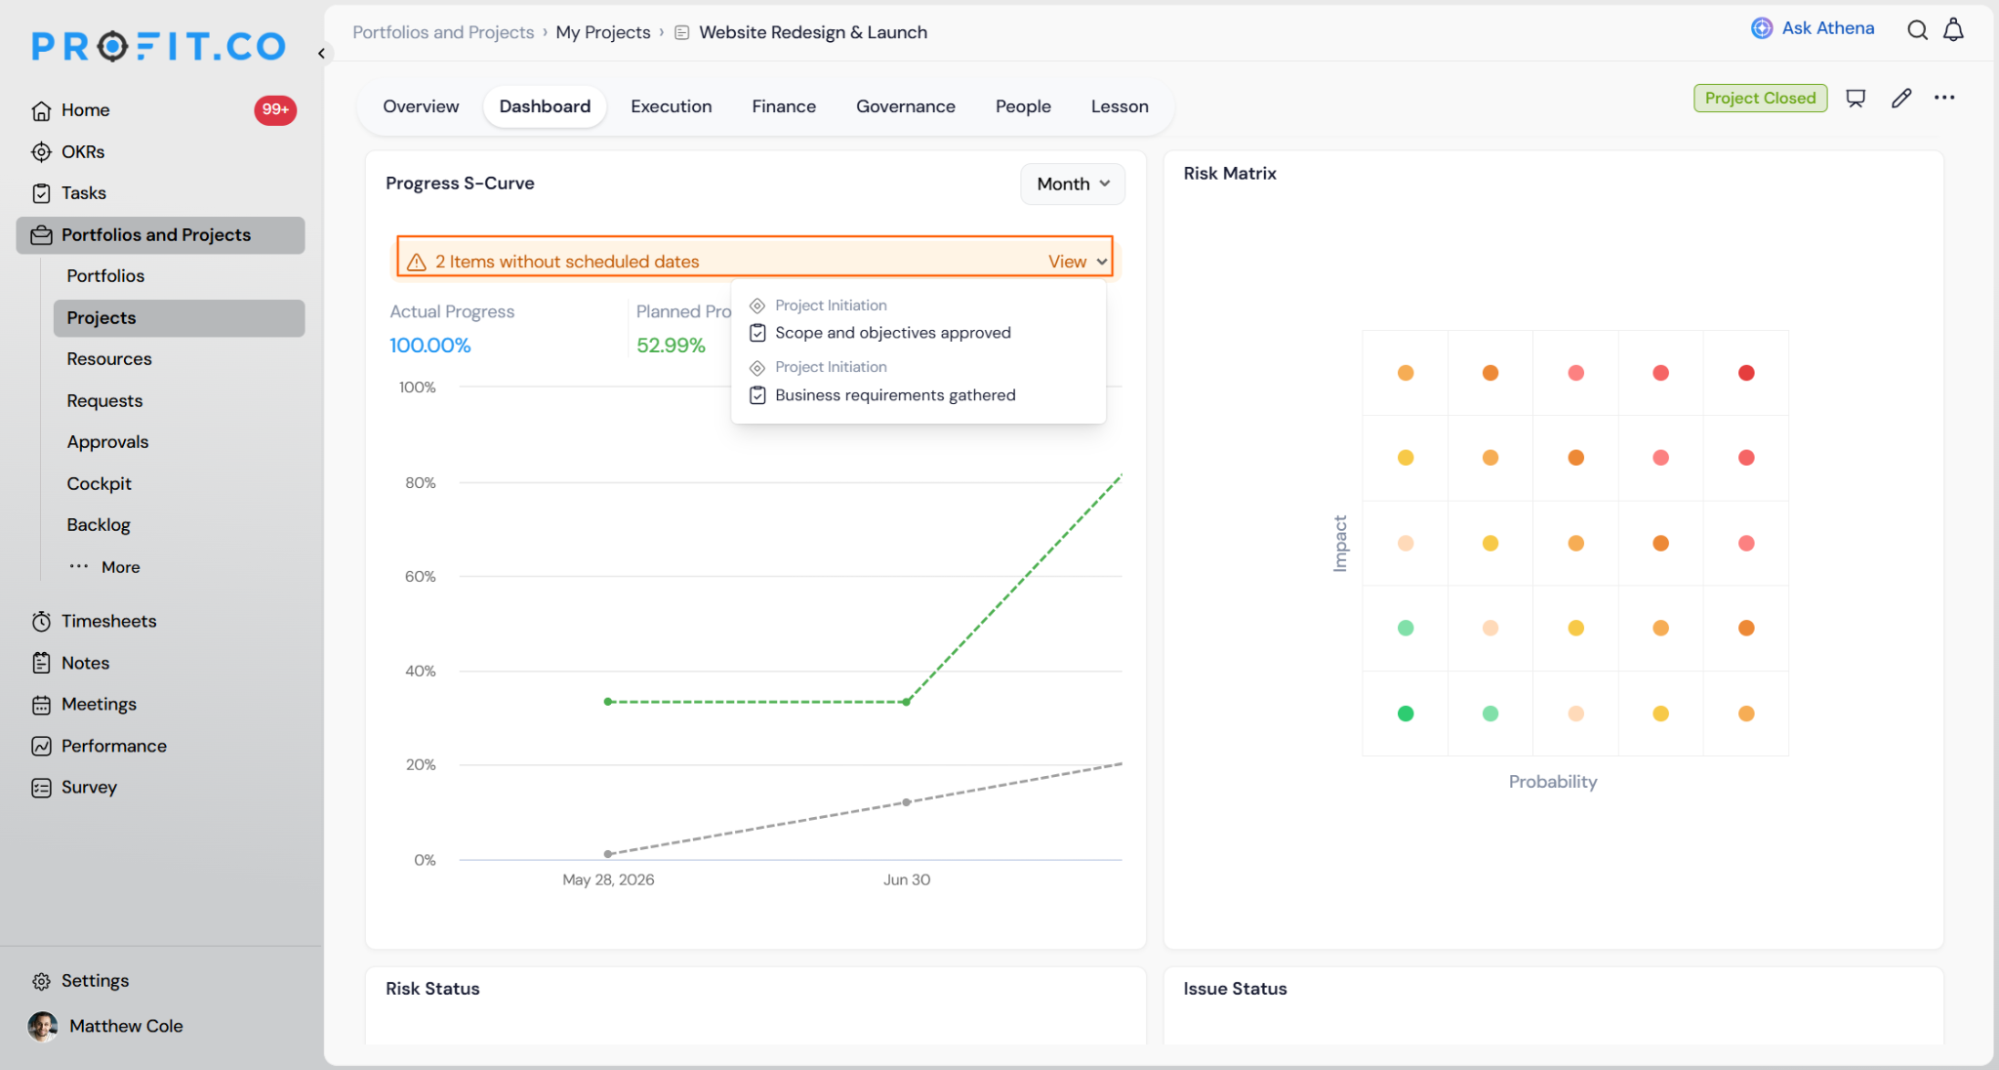
- Click View on the notice bar.
- Add or correct planned dates for the flagged items.
Progress S-Curve Widget Scenarios and Their Outcomes
This section covers what the chart and SPR score actually show under different scheduling conditions, not how to operate the widget.
| Scenario | What Happens |
|---|---|
| Your project has planned start and end dates on every task and milestone. | Profit.co calculates Planned Progress from real schedule dates at every point on the timeline, producing the most accurate SPR score and a full S-shaped curve. |
| Your project has some tasks or milestones without scheduled dates. | Profit.co counts each unscheduled item as 0% in the Planned Progress rollup and lists the exact count in the notice bar, pulling the SPR score down until dates are added. |
| Your project has no dated tasks or milestones, but the project record itself has planned start and end dates. | Profit.co falls back to the project's own planned dates and draws Planned Progress as a straight diagonal line instead of an S-shaped curve. |
| Your project has no planned dates anywhere, including at the project level. | Profit.co cannot draw the Planned Progress line or calculate SPR, and displays only the Actual Progress line on the chart. |
| Your project has Weighted Progress configured through the Project Weightage modal. | Profit.co calculates Planned Progress as a weighted average based on each milestone's assigned weight instead of a simple average across all milestones. |
Understanding SPR (Schedule Performance Ratio) Scores
Note
The widget displays this score as SPR (Schedule Performance Ratio). It is calculated using the same Schedule Performance Index formula documented for Profit.co's project schedule calculations: Actual Progress divided by Planned Progress.
The SPR figure is the fastest way to read schedule health without comparing the two lines yourself.
| SPR Value | Status | What It Means |
|---|---|---|
| Below 1.0 (e.g. 0.53) | Behind schedule | Actual Progress trails Planned Progress. The project is completing less work than the schedule expected by this point. |
| Around 1.0 (0.95-1.05) | On track | Actual Progress and Planned Progress run close together, following the schedule as planned. |
| Above 1.0 (e.g. 1.28) | Ahead of schedule | Actual Progress exceeds Planned Progress. Worth investigating whether scope was underestimated rather than assuming strong execution. |
Best Practices for the Progress S-Curve Widget
- Prioritize adding planned dates to backlog and unscheduled tasks first. Every item without dates counts as 0% in the Planned Progress rollup until it is scheduled, understating the real SPR.
- Treat an SPR above 1.0 with the same scrutiny as one below 1.0. Running ahead of schedule can mean scope was underestimated or quality checks are being rushed, not only strong execution.
- Configure Weighted Progress through the Project Weightage modal when milestones carry unequal effort, so a two-week milestone does not carry the same influence on SPR as a twelve-week one.
- Clear the unscheduled items notice on a regular cadence rather than at project close. This keeps Planned Progress on the true S-shaped curve instead of the less precise project-level diagonal fallback.
- Match the chart's time interval to your review cadence. A shorter interval surfaces schedule drift earlier, before it compounds into a larger SPR gap.
Related Articles
Frequently Asked Questions
No. The time interval selector only changes the chart's display resolution. Task and milestone planned dates stay exactly as scheduled.
Yes. Actual Progress matches the Progress field in the project's right panel, since both come from the same task completion rollup.
It opens the list of tasks and milestones missing planned dates so you can review and add dates directly.
Yes, where applicable. Planned Progress rolls up through the Task → Milestone → Project → Portfolio hierarchy, though the widget itself is displayed at the project level.
Execute your strategy with confidence
Connect OKRs, tasks, and teams in one place with Profit.co
