Most lists of hoshin kanri tools describe each tool on its own. That’s how they get used, too: as separate templates. The more useful question is what each tool takes from the others and what it hands on.
In this guide
- Three groups, one cycle
- Planning tools
- Tracking tools
- Problem-solving tools
- What each tool hands on
- A worked example: one red row through the toolkit
- Which tool answers which question
- Who uses which tools
- Five toolkit mistakes
- A minimum toolkit and a full one
- A reference card for every tool
- Paper, spreadsheet or system, tool by tool
- What a disconnected toolkit costs
- The toolkit in Profit.co
- Questions this article answers
Key Takeaways
- →Three groups plus two connectors: planning, tracking, problem-solving, with catchball and PDCA joining them.
- →If a tool’s output doesn’t reach the next tool, it isn’t part of the system. It’s paperwork.
- →Most review questions map to a specific tool. An unanswerable question usually means that tool isn’t in use.
- →The A3 coach role is the one most often missing, and its absence shows in weak root causes.
- →A blank owner column, or one that says “the team”, means that tool will decay.
- →Paper is best where people think together; a system where many people, places and months stay connected.
Three groups, one cycle
Hoshin kanri borrows most of its tools from quality management, where they were developed to be used together. Sorted by what they do, they fall into three groups, plus two that connect them.
| Group | Tools | Question each group answers |
|---|---|---|
| Planning | X-matrix; the seven management and planning tools; strategy A3; goal trees | What will we bet on, and who owns each bet? |
| Tracking | Bowler chart; four-quadrant chart; countermeasure sheets; review formats | Are the bets on plan, and are they working? |
| Problem-solving | A3; 5 whys; fishbone diagrams; Pareto charts | Why is this gap happening, and what will fix it? |
| Connecting | Catchball; PDCA | How do levels agree, and how does the plan learn? |
Planning tools
The X-matrix is the one-page plan: breakthrough and annual objectives, priorities, KPIs, owners, and the correlations between them. Building one is covered in How to Build an X-Matrix for Hoshin Kanri, Quadrant by Quadrant; templates are covered in X-Matrix Template for Hoshin Kanri: What a Good One Includes.
The seven management and planning tools, such as affinity diagrams, tree diagrams and prioritization matrices, help a planning team move from a pile of ideas to a short list of priorities. See The Seven Management and Planning Tools in Hoshin Kanri.
The strategy A3 summarizes a single objective on one page: why it matters, where it stands, what will be done and how it will be measured. See The Strategy A3 in Hoshin Kanri: One Objective on One Page.
Tracking tools
The bowler chart shows each row’s plan and actual by month, with the owner’s explanation of every gap. The four-quadrant chart plots KPI progress against initiative progress, which shows where work is done but results aren’t following. Countermeasure sheets record the cause, action, owner and recovery date for every off-track row. Together they turn the plan into a monthly conversation.
Each has an article of its own: Bowler Chart Template for Hoshin Kanri: Structure, Formulas, Colors, The Four-Quadrant Chart: Plotting KPIs Against Initiatives in Hoshin Kanri and Countermeasure Sheets in Hoshin Kanri: Tracking Actions on Off-Track Objectives.
Problem-solving tools
When a row stays red, a one-line countermeasure isn’t enough. The A3 structures a deeper investigation: current condition, target, root cause, countermeasures and follow-up, on a single page. Inside it, root-cause tools such as 5 whys, fishbone diagrams and Pareto charts do the analysis. See When a Red Bowler Row Needs an A3 in Hoshin Kanri and Root-Cause Tools for Hoshin Kanri Gaps: 5 Whys, Fishbone, Pareto.
What each tool hands on
| Tool | Takes from | Hands to |
|---|---|---|
| Planning tools | Last year’s reflection; candidate ideas | The X-matrix |
| X-matrix | Planning tools; catchball | The bowler: what to track |
| Bowler | The X-matrix; owners’ check-ins | Countermeasures; the four-quadrant view |
| Countermeasure sheet | Red bowler rows | Next month’s bowler |
| A3 | Rows red for two months or more | Countermeasures, or catchball |
| Catchball | Draft plans; A3 findings | The X-matrix: revised targets and priorities |
If a tool’s output doesn’t reach the next tool, it isn’t part of the system. It’s paperwork.
Read the last column top to bottom and the loop appears. Where it breaks, and why it is almost always the same link, is in The Hoshin Loop: From X-Matrix to Bowler to A3 and Back.
A worked example: one red row through the toolkit
An illustrative services objective goes red in July and stays red in August.
| Month | Tool | What happens |
|---|---|---|
| July | Bowler | Row turns red; owner’s check-in names a cause: low contract attach rate in new territories |
| July | Countermeasure sheet | Action: retrain service sales in two regions; recovery date September |
| August | Bowler | Still red; second consecutive month |
| August | A3 | Root cause found: calls still routed to head office, so new centers rarely meet customers |
| September | Countermeasure, then catchball | Routing rules changed; priority measure changed from centers opened to calls served locally; Q4 target reopened |
| October | X-matrix | Priority’s measure and target updated, with the reason recorded |
Illustrative.
Six tools, one thread. If any step is missing, especially the last, the organization solves the July problem and keeps the flawed measure that hid it.
Which tool answers which question
Most review questions map to a specific tool. When a meeting can’t answer a question, it’s usually because the tool that answers it isn’t in use.
| Question in the room | Tool that answers it |
|---|---|
| Which bets did we place, and who owns each? | X-matrix with owners |
| How strongly do we expect this priority to move that KPI? | Correlation grades and the correlation record |
| Is each row on plan this month? | Bowler chart |
| Is the work done but the result not following? | Four-quadrant chart; exception list |
| What is being done about this red row? | Countermeasure sheet |
| Why does this gap keep recurring? | A3 with root-cause tools |
| Did the countermeasure work? | The A3’s check, after the expected lag |
| Should the target change? | Catchball |
| What did we learn this year? | Reflection across matrix, bowler and closed A3s |
Who uses which tools
| Role | Uses most | Contributes to |
|---|---|---|
| Executive team | X-matrix, four-quadrant chart, exception list, quarterly decisions | Breakthroughs, catchball, A3 coaching |
| Objective and KPI owners | Bowler, countermeasure sheet, A3 | Check-ins, countermeasures, A3s |
| A3 coach | A3, root-cause tools | Review of every A3 before it commits work |
| Planning or strategy lead | Planning tools, review formats, reflection | The cadence and the gates |
| Team leads | Team OKRs or task lists under priorities | Key results that roll up to the matrix |
The coach role is often missing. Without someone whose job is to challenge the thinking in an A3, root causes tend to be the first plausible explanation, and countermeasures tend to be the owner’s existing plan relabelled.
Five toolkit mistakes
- Using the tools out of order. Writing A3s before the bowler is running, or drawing correlations before priorities are chosen. Each tool depends on the output of the one before it.
- An A3 for everything. If every red cell gets an A3, A3s become paperwork. Use the escalation triggers.
- A bowler without countermeasures. Colors with no cause or action turn the monthly review into a status meeting.
- A matrix without a correlation record. The dots look decisive and can’t be tested.
- All seven planning tools, every year. They are for the stages where planning goes vague, not a mandatory sequence.
The toolkit is small. The discipline is in using each tool for the question it answers, and in passing its output to the next one.
A minimum toolkit and a full one
| Measure | Minimum | Full |
|---|---|---|
| Planning | X-matrix with owners | Plus correlation record, prioritization matrix, strategy A3s, other planning tools as needed |
| Tracking | Bowler with comments | Plus four-quadrant chart, exception list, countermeasure sheets, dashboards |
| Problem-solving | A3 for persistent gaps | Plus a coach, root-cause tools and A3 review by everyone committed |
| Connecting | Monthly review | Plus quarterly review, catchball sessions and an annual reflection |
Most organizations should start with the minimum and add tools as the questions they can’t answer become clear. Hoshin Kanri Tools for Mid-Sized Companies lays out a three-year sequence.
A reference card for every tool
| Tool | Owner | Cadence | Input | Output |
|---|---|---|---|---|
| X-matrix | Executive team | Annual, revised quarterly | Reflection; planning tools; catchball | Bets, grades, owners |
| Correlation record | KPI owner with priority owner | Annual, revised quarterly | Planning debate | Mechanism, lag, kill signal |
| Bowler chart | Row owners | Monthly | Check-ins | Plan against actual, with comments |
| Four-quadrant chart | Planning lead | Monthly | Matrix and check-ins | Outcome-lag and unexpected-win cases |
| Countermeasure sheet | Row owners | Monthly | Red rows | Cause, action, expected effect, result |
| A3 | Gap owner, with a coach | When triggered | Persistent gaps | Root cause, countermeasures, check, plan change |
| Catchball | Objective owners and receiving levels | Planning; when targets change | Draft targets; A3 findings | Agreed targets with reasoning |
| Reflection | Planning lead with owners | Annual | The year’s record | Verdicts and lessons |
Two columns explain most toolkit problems. When the owner column is blank or says “the team”, the tool decays. When the input column describes something that isn’t produced anywhere, the tool runs on guesswork.
Paper, spreadsheet or system, tool by tool
| Tool | Paper or wall | Spreadsheet | Connected system |
|---|---|---|---|
| Planning tools | Best | Possible | Captures the output |
| X-matrix | Good for drafting | Workable for one team | Needed once levels and owners multiply |
| Bowler | Fine for a single board | Workable; fragile with many editors | Current without anyone building it |
| A3 | Good for thinking | Awkward | Keeps it with its gap, its review and its verdict |
| Catchball | Good in one room | Poor | Needed across sites and rounds |
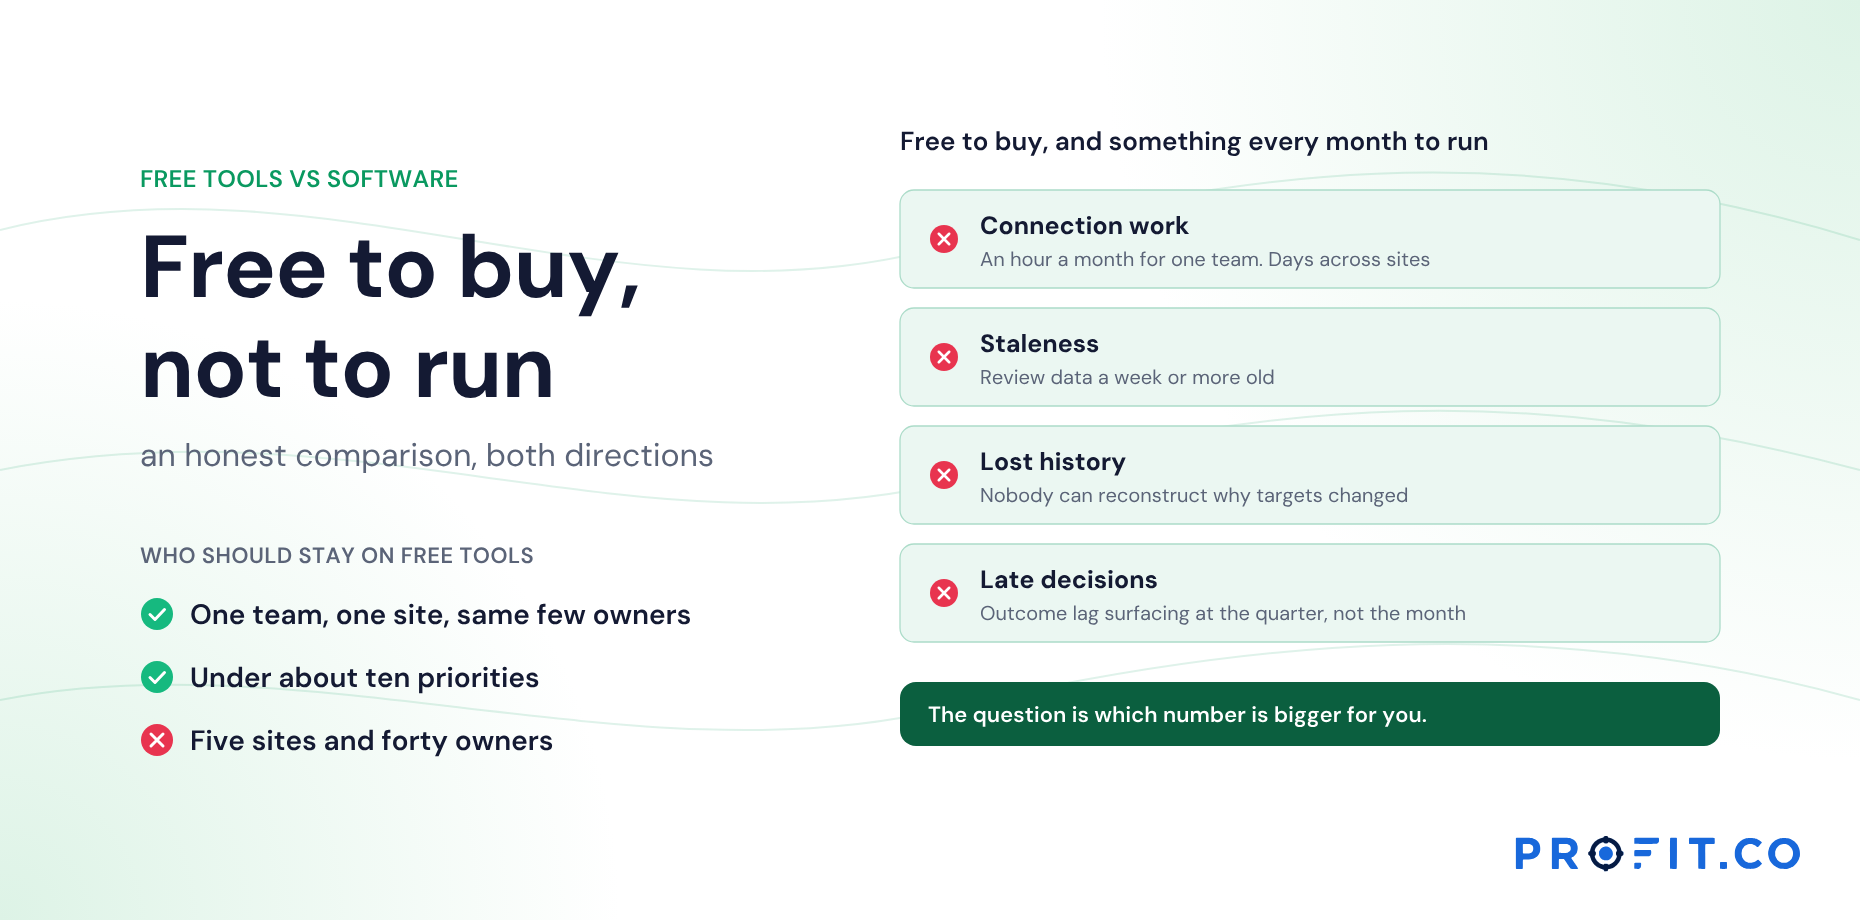
The pattern is consistent. Paper is best where people think together; a system is best where many people, places and months have to stay connected. See Free Hoshin Kanri Tools vs Software: An Honest Comparison.
What a disconnected toolkit costs
Every tool in the reference card is free to adopt. The cost is in the handovers, and the worked example shows where it lands: six tools over four months, each one correct, with the whole value sitting in the last row. Stop at September and the services gap is fixed for one quarter. Reach October and the measure that hid it is fixed for good.
Read the reference card’s input column as a bill of materials and the hidden work becomes visible. The four-quadrant chart needs matrix correlations and check-ins on a common period. The A3 needs the bowler row, the gap and the correlation. Catchball needs the draft target and the A3 finding. Held in separate files, somebody assembles each of those inputs by hand every month, and the tool quietly stops being used the month nobody has time.
Among published alternatives, OnStrategy lists $200 per month for unlimited users. i-nexus publishes a free Starter tier for up to five users and $28 per user per month at its Standard tier. The “who uses which tools” table above is the seat question in one view: five roles, and the two widest, owners and team leads, are the ones a per-seat model prices out first.
Profit.co publishes two plans, Essentials and Enterprise, quoting against modules and scale rather than a public seat rate. Hoshin Kanri sits in Essentials alongside OKRs and Goals, Balanced Scorecard and Strategy Roadmap, which is what lets the team-leads row of that table exist at all. What drives the cost of hoshin kanri software lists the rest to total, and the 30-day free trial covers one monthly cycle of the tracking group.
The toolkit in Profit.co
Profit.co holds the X-matrix, bowler chart and four-quadrant chart on the same objectives. Profit.co’s exception queue flags each correlation whose hypothesis didn’t hold, and initiative escalation flags delivery problems, so outcome lag reaches the review as a named item rather than something someone has to spot.
The countermeasure A3 is built in: opened from an exception, an escalation or a red bowler cell, written on a two-sided sheet with Ishikawa and 5 Whys editors, reviewed by everyone whose work it commits, and judged after the expected lag. Its Act step writes back to the matrix. Catchball runs as a session on each objective, and PDCA cycles and huddles run on the same platform. More on the Hoshin Kanri software page.
Free Product Demo
See your toolkit as one system
A 30-minute walkthrough, tailored to your team.
Book a free demo
What happens in the call
How your teams set goals, track progress and review results.
Strategy, performance, projects and engagement on one platform, with AI.
A practical path to align teams, execute faster and drive results.
Questions this article answers
The X-matrix, bowler chart, four-quadrant chart, countermeasure sheets, A3, catchball and PDCA, plus the seven management and planning tools used during planning.
The X-matrix and the bowler chart. Together they set the plan and track it monthly. Add countermeasure sheets and A3s once the monthly review is running.
Planning tools and the X-matrix are Plan; the bowler and check-ins are Do and Check; A3s, countermeasures and catchball are Act, which feeds back into the next plan.
The A3 coach. Without someone whose job is to challenge the thinking, root causes tend to be the first plausible explanation and countermeasures tend to be the owner’s existing plan relabelled.
Look at two columns on its reference card. If the owner is blank or “the team”, nobody maintains it. If its input is something no other tool produces, it runs on guesswork.
Yes. Each depends on the output of the one before it, so writing A3s before the bowler runs, or grading correlations before priorities are chosen, produces work that cannot be used.