
Release Highlights
A quick-glance summary of all features shipped in this release. Click any feature to jump to the full detail below.
| STRATEGY (Strategy Roadmaps, Balanced Scorecard, OKR Management, Hoshin Kanri) | ||
|---|---|---|
| S.No | Feature Name | Key Benefit |
| 1 | Progress Trend Chart for OKR Fulfillment | See whether OKR progress is improving or slipping over time, with one-click filtering to at-risk items. |
| 2 | Organization-Wide Default View for the OKR List | Ensure every team reviews OKRs on the same columns, new users inherit the layout automatically. |
| 3 | Department Reflection Export to PDF | Export the full reflection cycle, OKR hierarchy, next-quarter plans, and responses, into one ready-to-share PDF. |
| 4 | Ownership Boundaries for Aligned OKRs | Restrict definitional field edits on aligned OKRs to the owning department, preventing unintended cross-department changes. |
| 5 | Convert OKR Items to a Different Type | Restructure objectives, child objectives, and initiatives in place, with all check-in history and comments preserved. |
| 6 | Restrict Edits on Reset Key Results | Lock finalised key results after reflection so historical period data remains accurate and unalterable. |
| 7 | Live Preview When Building Saved Views | See exactly which OKRs a filter returns as you build it, before saving the view. |
| 8 | Plan vs Actual Presentation Style in KR Progress-Hierarchical View | Export a ready-to-present PowerPoint showing planned vs actual progress for every key result, side by side. |
| 9 | Flexible Check-In Type for Key Results | Log progress on key results at any time without being tied to a fixed check-in date or schedule. |
| 10 | OKR Progress Reference During Reflection and PPP Review | Answer reflection and PPP questions informed by live OKR data, without leaving the review panel. |
| 11 | Company Branding in OKR Progress Presentation Export | Automatically apply the company logo and brand colours to every exported OKR PowerPoint slide. |
| 12 | User Groups for Ownership Across OKRs, Tasks, and PPM | Assign a named group as owner across OKRs, Tasks, and PPM, with privilege controls and impact-aware modification alerts before any change is applied. |
| 13 | Velocity Row in KPI Quick View | See the signed gap between Actual and Target per period, with colour-coded directional indicators, in the BSC Quick View. |
| 14 | Sorting and Reordering in the Balanced Scorecard | Sort or drag scorecard items into any preferred order, saved privately and reflected in exports and PowerPoint. |
| 15 | PDF Export for the Check-In Discipline Widget | Export the Check-In Discipline widget as a presentation-ready PDF alongside the existing CSV option. |
| 16 | Improvements for KPI Type and Progress Calculation | Remove invalid KPI configurations at source and grey out incompatible calculation methods to prevent silent errors. |
| PROJECTS (Task Management, Portfolios And Projects, Timesheets, Notes And Meetings) | ||
|---|---|---|
| S.No | Feature Name | Key Benefit |
| 1 | Mandatory Attachment Option for Tollgate Checklists | Enforce documentation standards by requiring file uploads before a tollgate checklist item can be marked complete. |
| 2 | KPI Creation at the Portfolio Level | Create and track outcome KPIs directly at the portfolio level, independent of the project progress roll-up. |
| 3 | Project Category Assignment for Templates | Organise project templates by category so teams find the right template faster when starting a new project. |
| 4 | Portfolio-Level Resource Management | Manage, allocate, and monitor resources across all portfolio projects from a single People tab with Capacity Workbench. |
| 5 | Decimal Value Support for Project and Portfolio KPIs | Set KPI targets and log check-ins with decimal precision for accurate currency and numeric tracking. |
| 6 | AI Status Report Templates for Portfolio Summaries | Choose from multiple AI-generated report templates, including a visual Dashboard for leadership, matched to your audience at the click of a button. |
| 7 | Associated KR roll-up on project and portfolio list views | See how many Key Results are aligned to any project or portfolio, and everything beneath it, directly from the list view. |
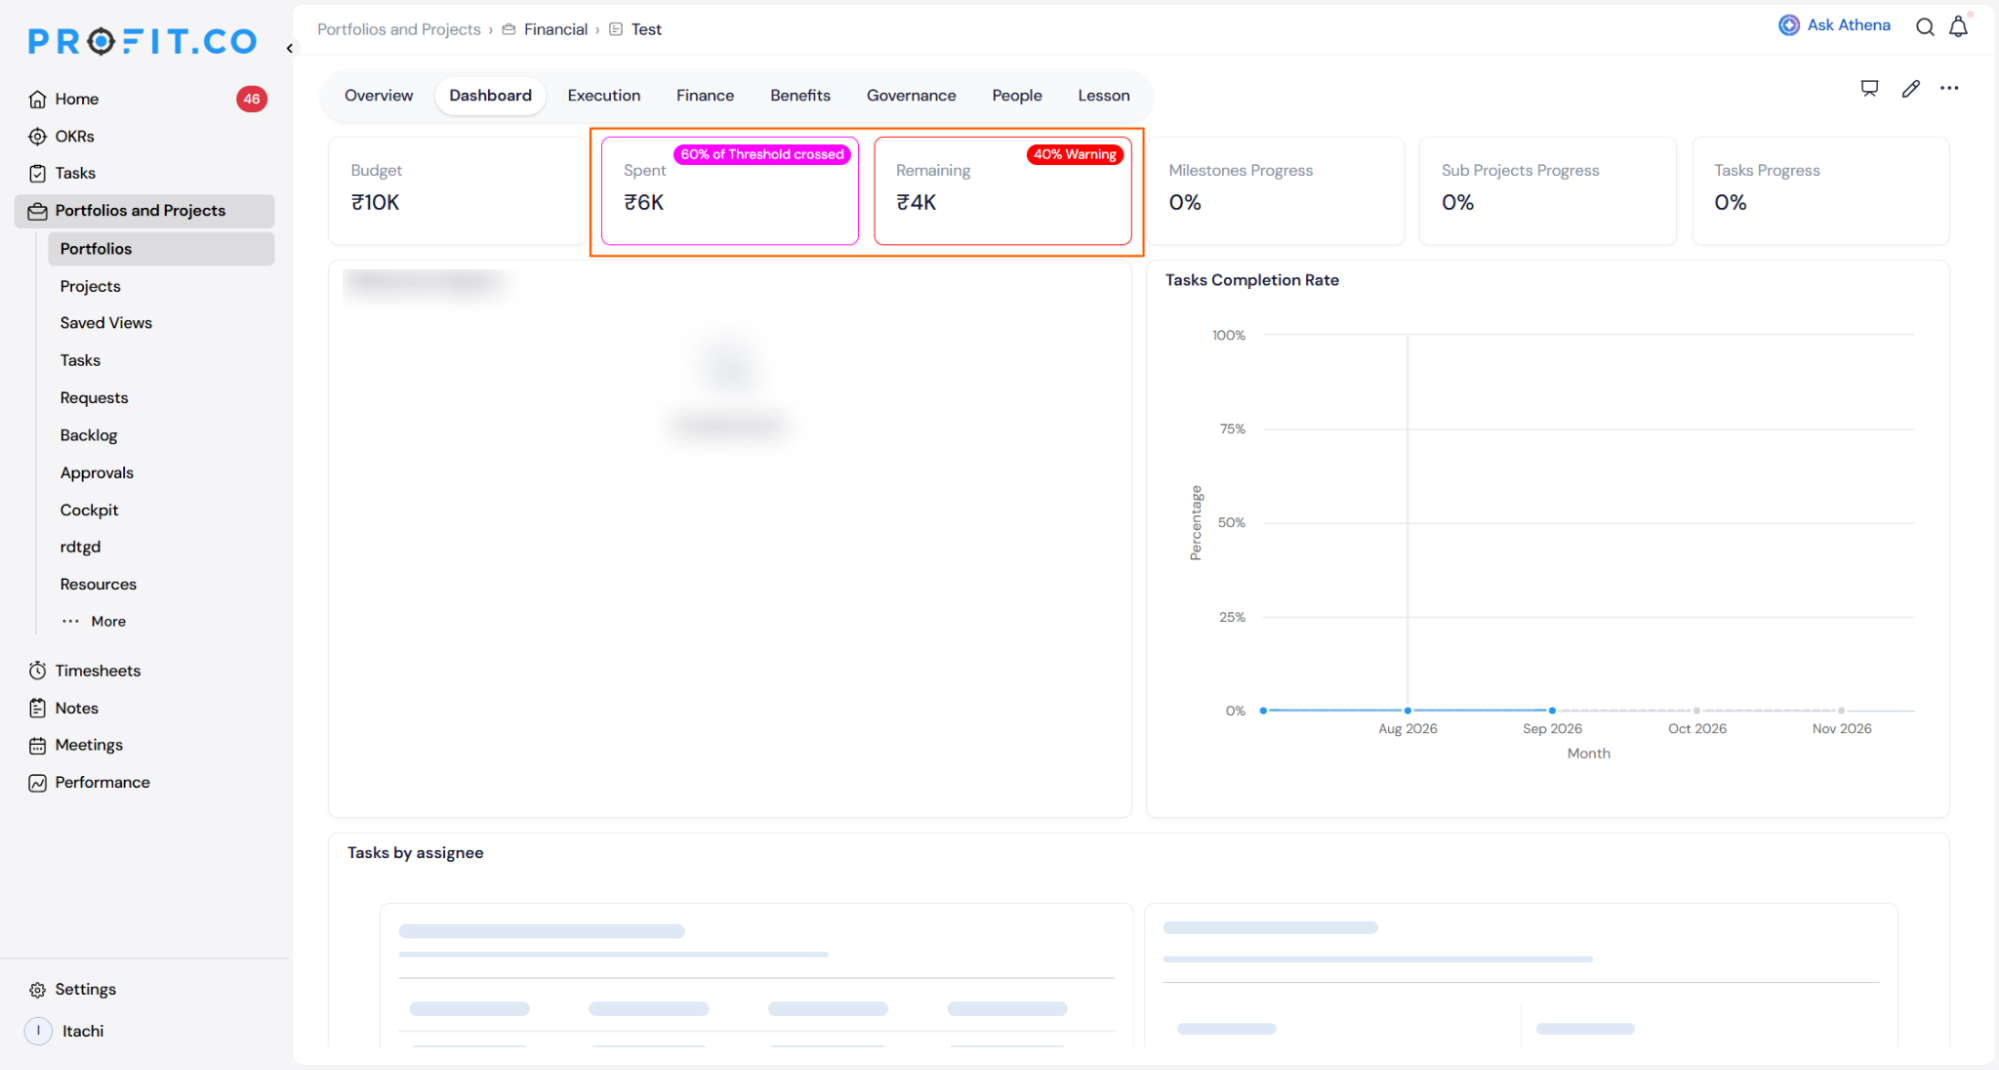
| 8 | Portfolio Financial Alerts and Spend Threshold Dashboard | Get automatic alerts and a unified dashboard when project spend crosses warning, critical, or overrun thresholds. |
| 9 | Activity Logs for Portfolio and Project Management | View a full chronological history of every change made to a project, who did it, what changed, and when. |
| 10 | Email Notifications for PPM and Task Action Center Events | Automatically notify the right people when milestones, tasks, or projects are assigned, overdue, or approved. |
| PERFORMANCE (Performance, Goals, Development Plans, Recognition, Survey) | ||
|---|---|---|
| S.No | Feature Name | Key Benefit |
| 1 | Threshold-Based Rating Derivation for Reviews | Automatically derive final review ratings from percentage score ranges, configured globally or per template. |
| 2 | Bell Curve Support for Non-Calibrated Reviews | Enable Bell Curve evaluations per review template without toggling the global setting. |
| 3 | Excluded Users Panel for Active Review Cycles | Instantly surface and resolve assessment gaps when an employee is terminated during an active review cycle. |
| 4 | Clearer Progress Display in the Review Cycle Summary Bar | See clearly labelled completed and pending counts with completion percentages for each assessment stage. |
| 5 | CSV Export for Competency/Performance Cockpit Charts | Extract competency and performance review data to CSV directly from the Cockpit for offline analysis. |
| 6 | Filter Support for Individual Development Plans | Filter the IDP list in HR Administration by relevant criteria to quickly locate and manage individual plans. |
| SECURITY | ||
|---|---|---|
| S.No | Feature Name | Key Benefit |
| 1 | Scoped access key generation for API integration | Generate scoped access keys to let external systems read or write Profit.co data securely, with configurable permissions, department scope, and expiry. |
STRATEGY (Strategy Roadmaps, Balanced Scorecard, OKR Management, Hoshin Kanri)
1. Progress Trend Chart for OKR Fulfillment
Overview
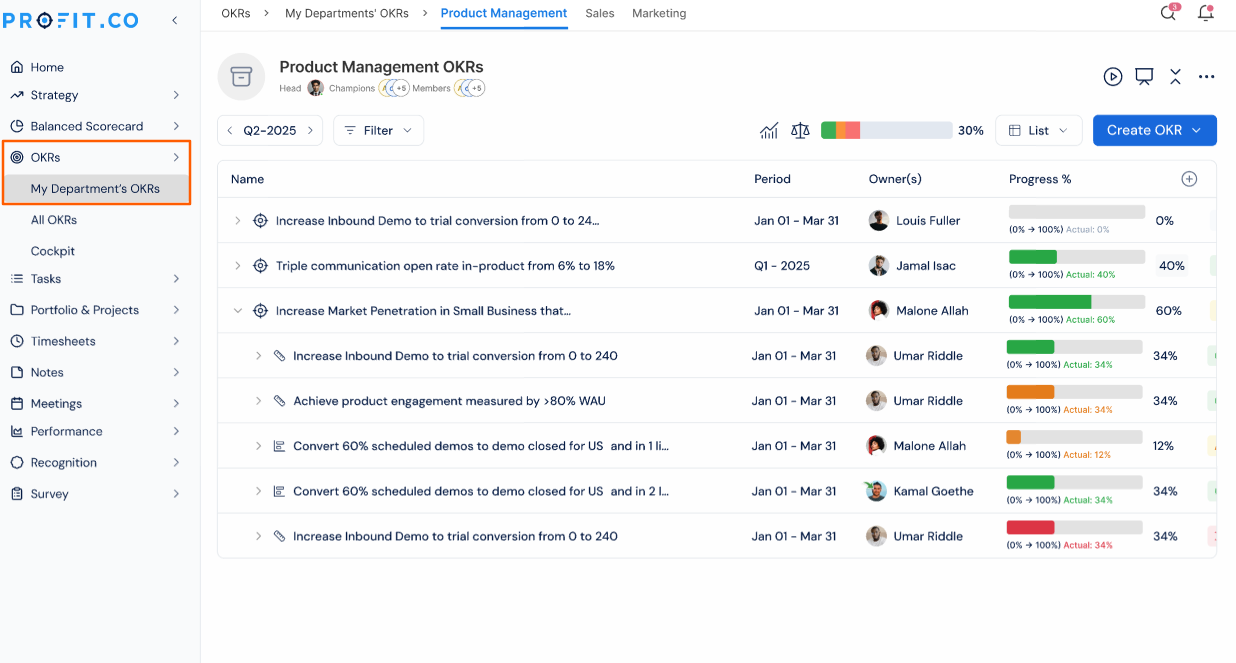
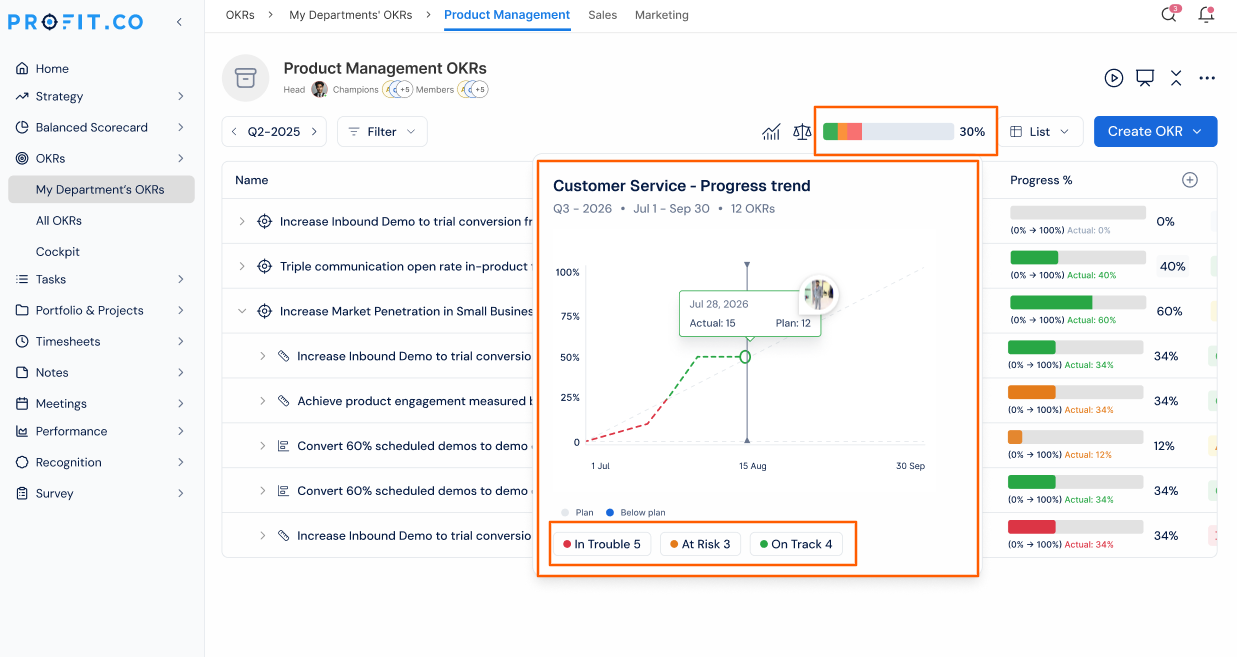
The fulfillment bar on the OKR list page is now clickable, opening a progress trend panel that shows how the department has been tracking over the selected period. The panel offers two views – Progress, which plots planned versus actual fulfillment over time, and Status mix, which shows how OKRs were distributed across statuses on each date. Status counts displayed in the panel footer are also clickable, instantly filtering the OKR list to only the items in that status.
How It Works
- Navigate to the OKRs from the left navigation panel.
- Click the fulfillment bar to open the trend panel.
- The panel shows two views
- Progress – shows how actual fulfillment has tracked against the plan across the period. The actual line is plotted up to the last check-in date; the plan line continues to period end.
- Status mix – shows how many OKRs were in each status on each date across the period.
- The x- axis reflects the check-in frequency configured – for example, a monthly check-in cadence displays the chart with month labels (Jan, Feb, Mar, and so on).
Why It Matters
- See the direction, not just the number: The trend panel shows whether progress is improving or slipping over time, helping leaders spot problems before the quarter- end review.
- No setup needed: The trend panel is available to everyone who can already view the OKR list – no new permissions or configuration required.
2. Organization-Wide Default View for the OKR List
Overview
Super users can now configure a default column layout for the OKR list and apply it across the entire organization from Settings. The arrangement is applied to all users on the shared setup and inherited automatically by anyone who joins afterwards. Users who have built their own custom view are not affected , they can continue with their existing layout or switch to the Organization default at any time from the column picker.
How It Works
To set the Organization default (super user):
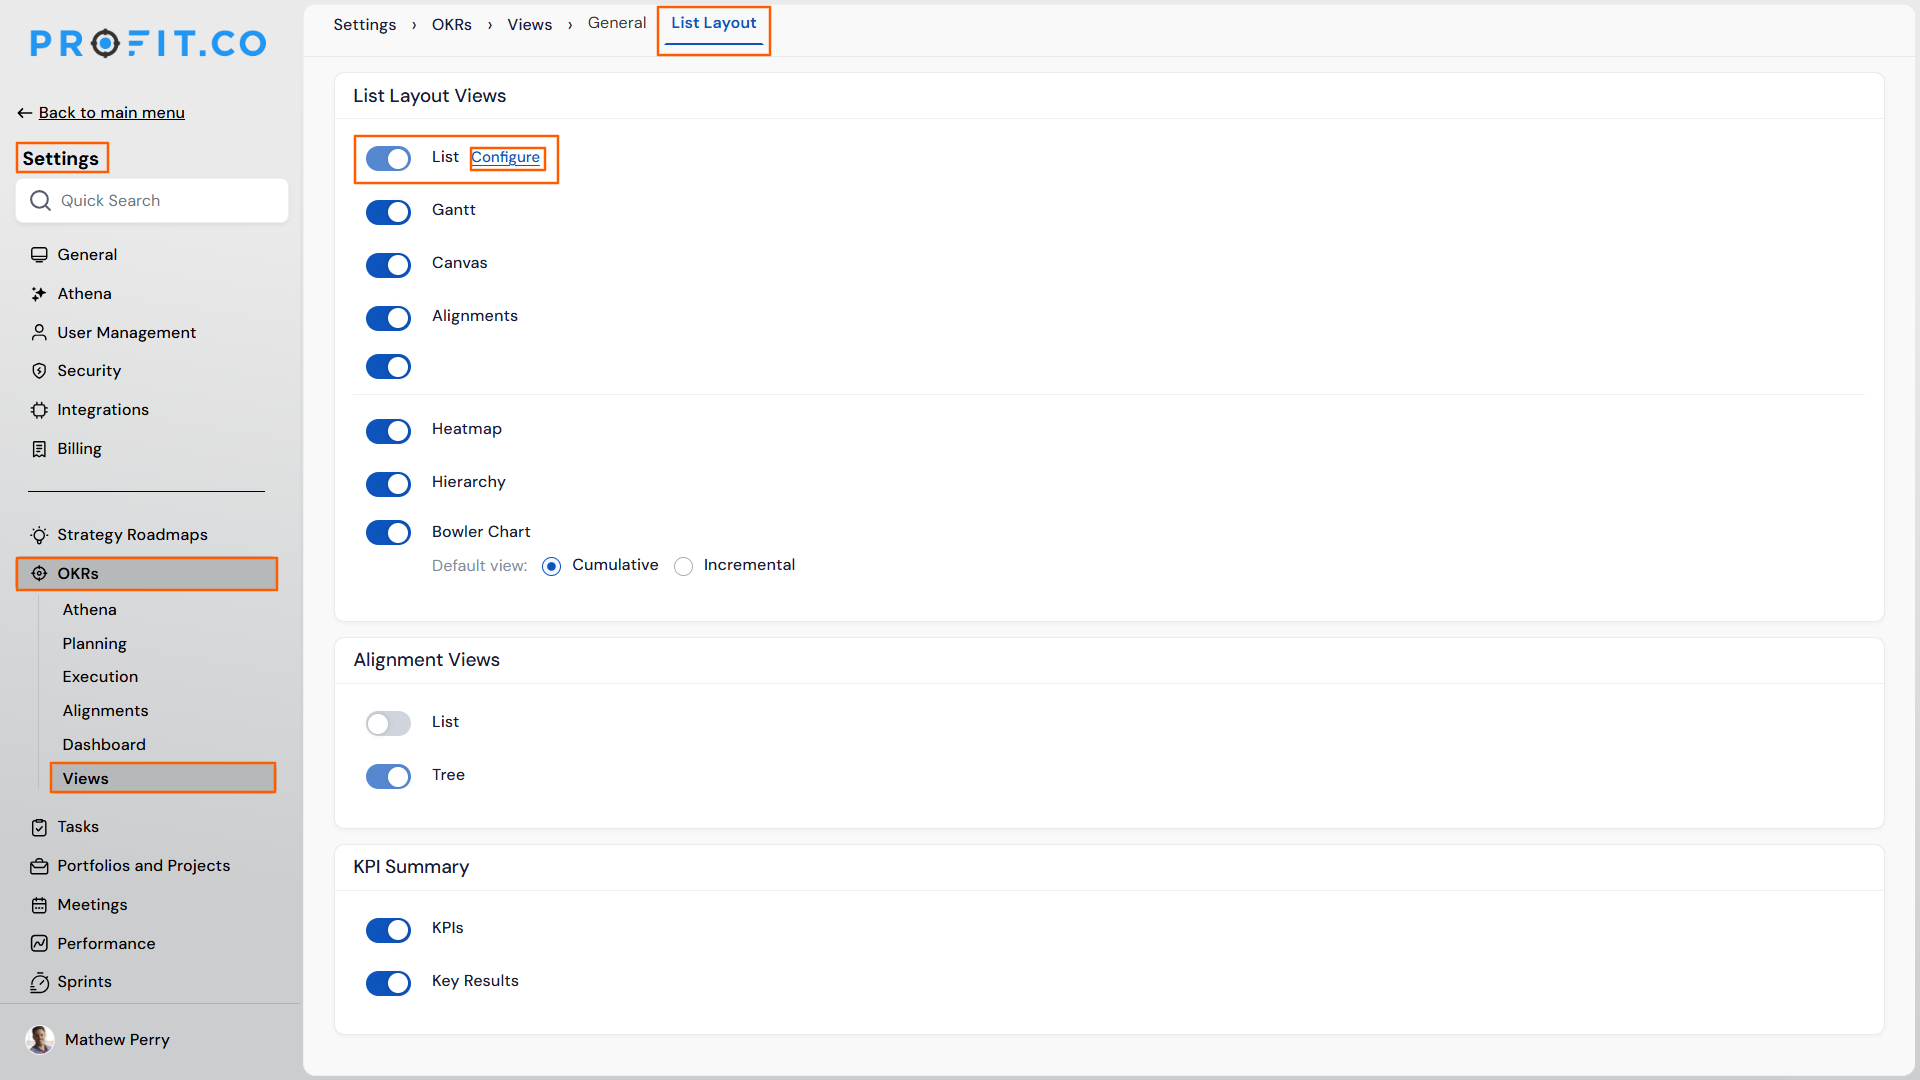
- Navigate to Settings → OKRs → Views → List Layout.
- Under List Layout Views, click Configure next to List.
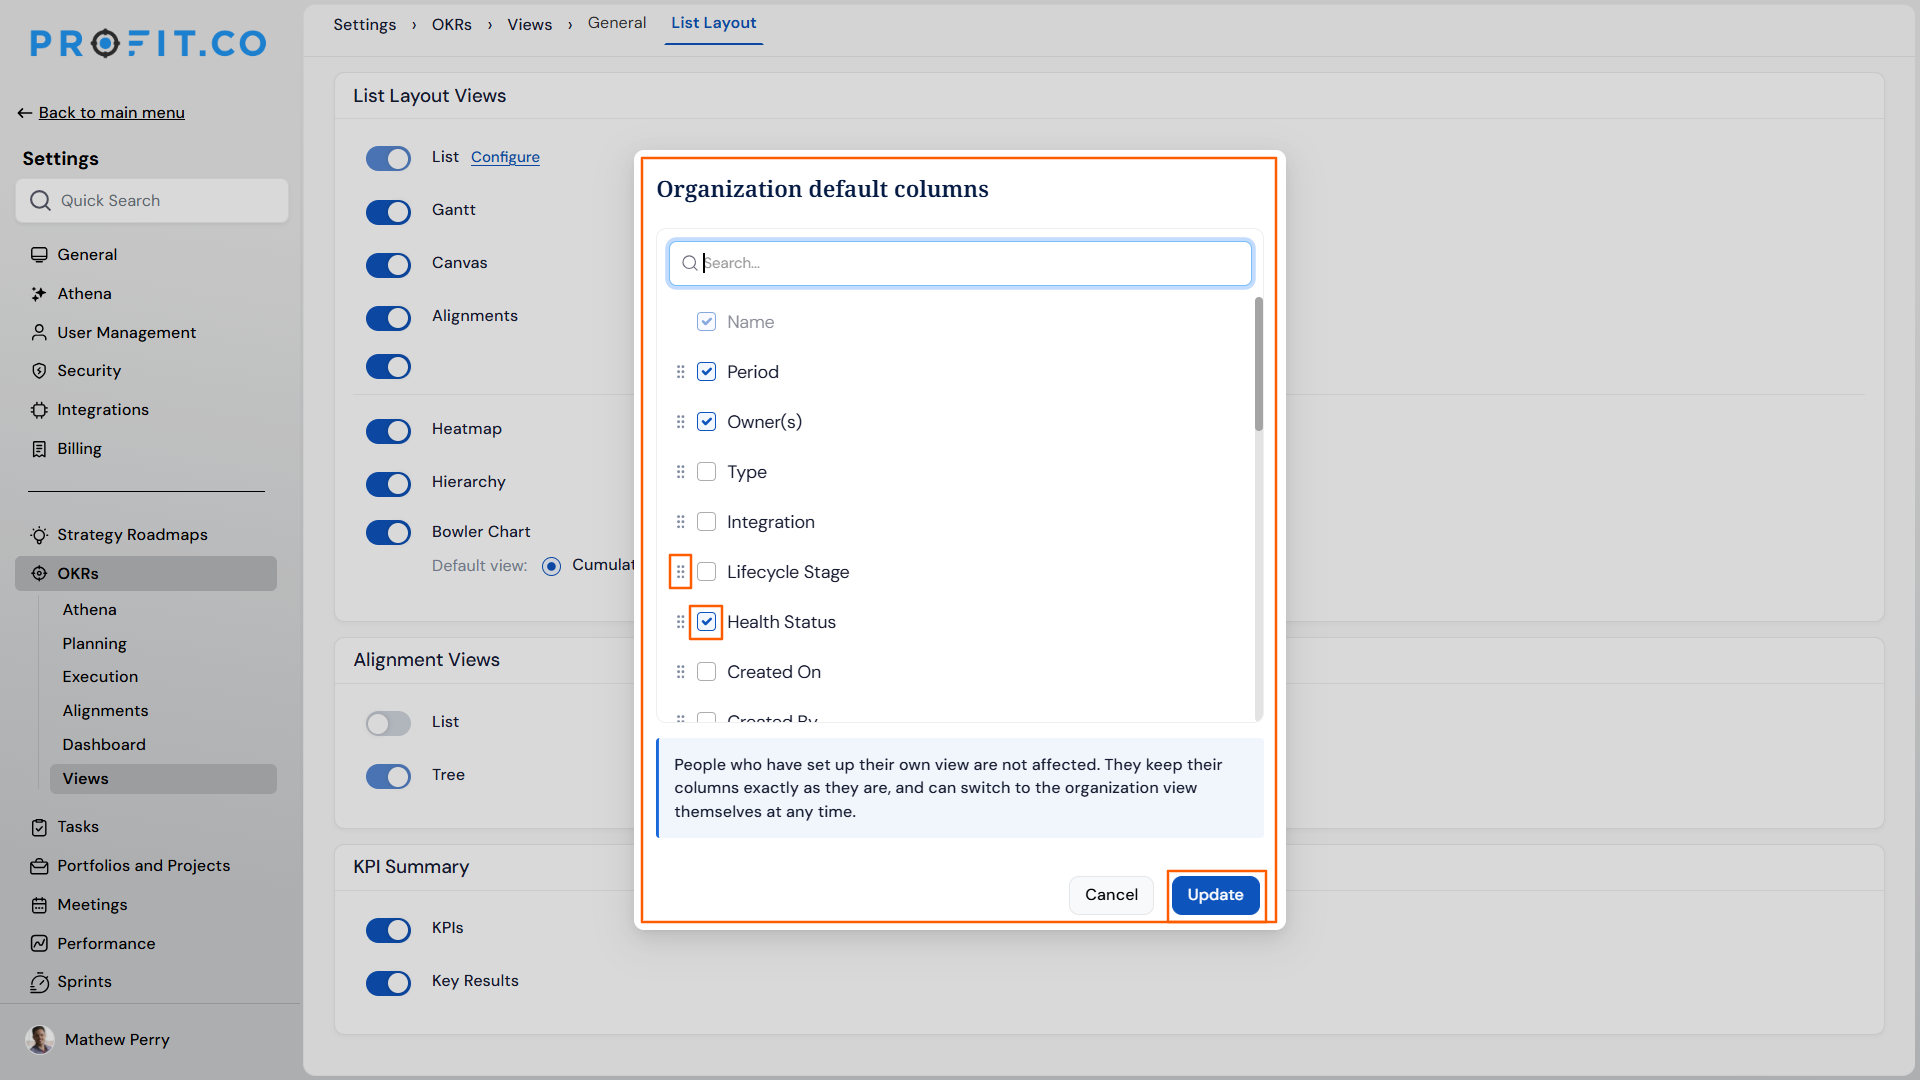
- The Organization default columns panel opens , check or uncheck columns to enable or disable them, and drag them into the preferred order using the drag handles.
- Click Update to save and apply the layout as the Organization default.
- Users who have set up their own view are not affected , they keep their columns exactly as they are and can switch to the Organization view themselves at any time.
- Any new user added to the Organization after the default is set will automatically start with the Organization default view , no setup required on their end.
For users with a custom view:
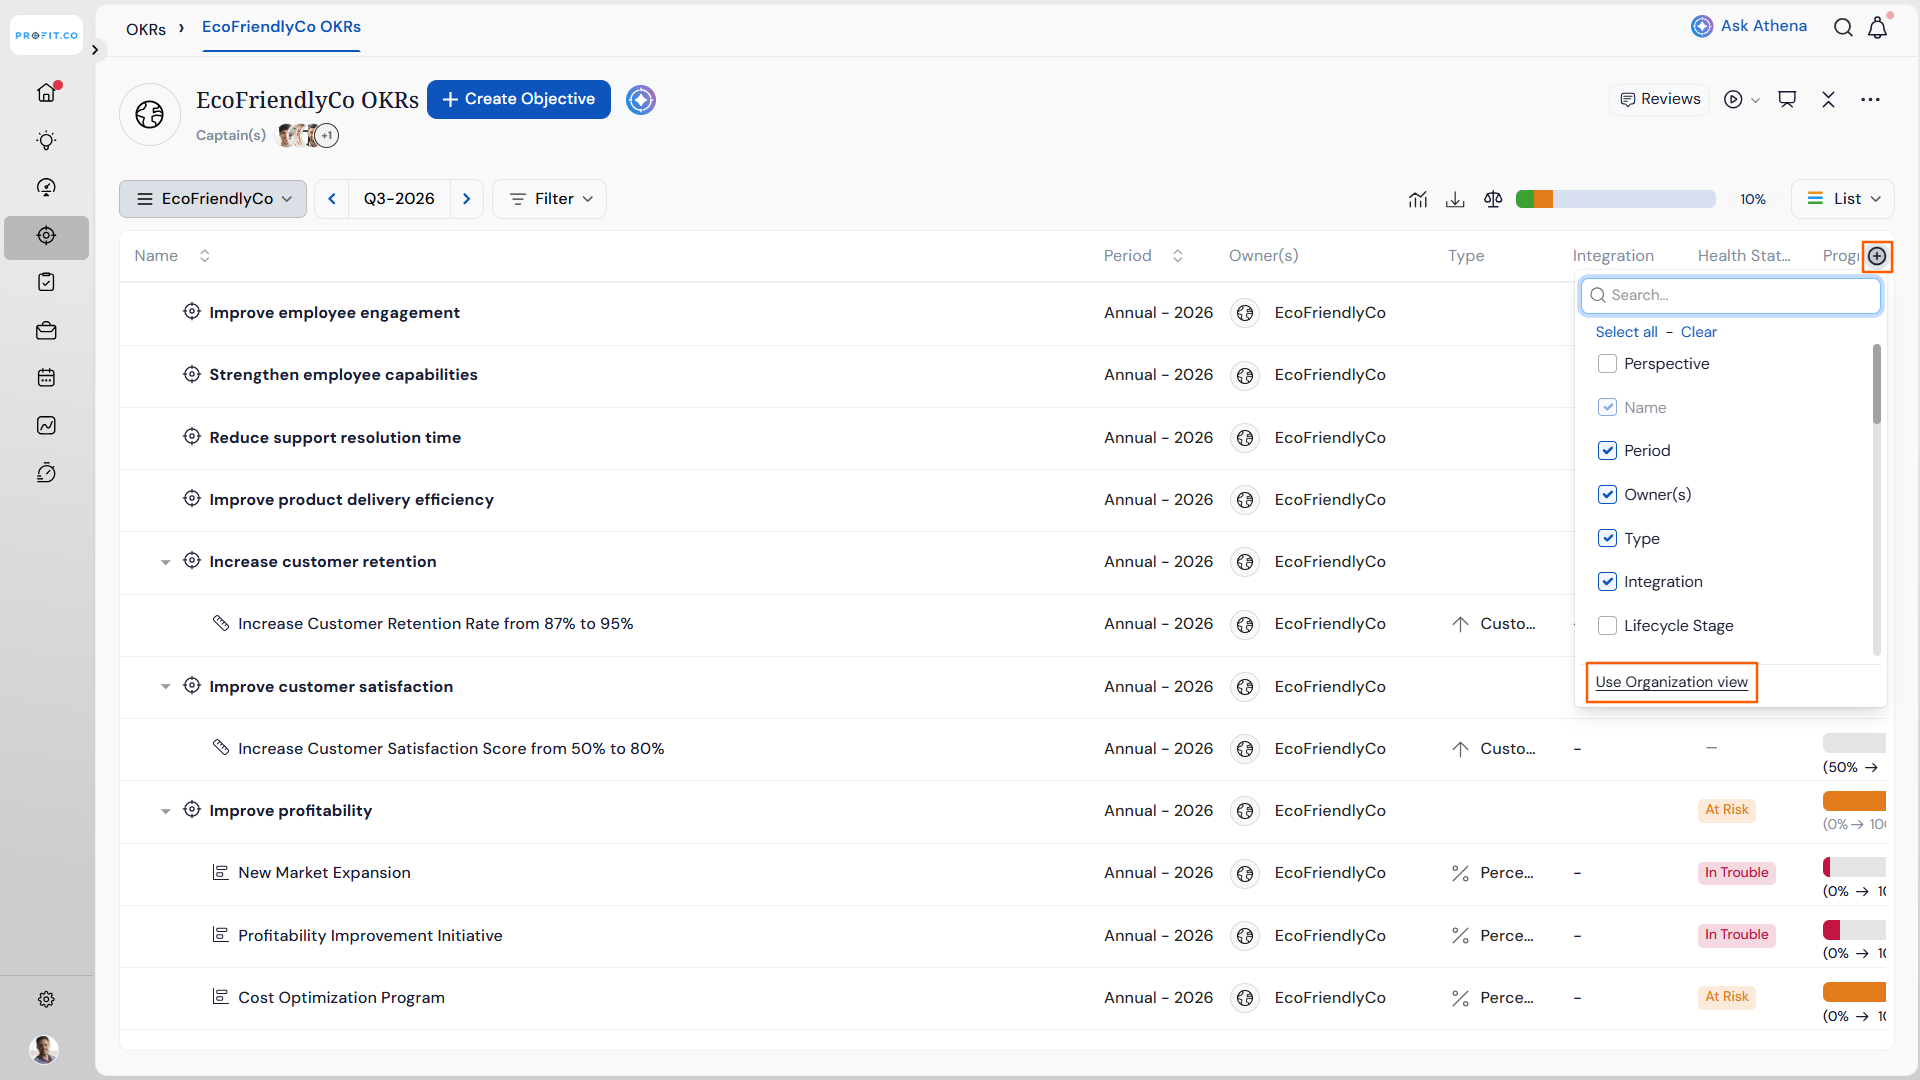
- Open the OKR list and click the column picker control.
- A Use Organization view option appears at the bottom of the panel.
- Select it to see a side- by- side comparison of the current view versus the Organization default, with additions and removals clearly marked.
- Confirm to switch , the table updates to the Organization default immediately.
Why It Matters
- One standard across the Organization: Super users can ensure every team reviews OKRs on the same columns, without relying on written instructions or manual follow- up.
- Respects individual customisation: Users with their own view are never overwritten , they are simply given the option to adopt the Organization standard when it suits them.
- Zero friction for new users: Anyone who joins after the default is applied starts with the Organization layout automatically, with no setup required.
3. Department Reflection Export to PDF
Overview
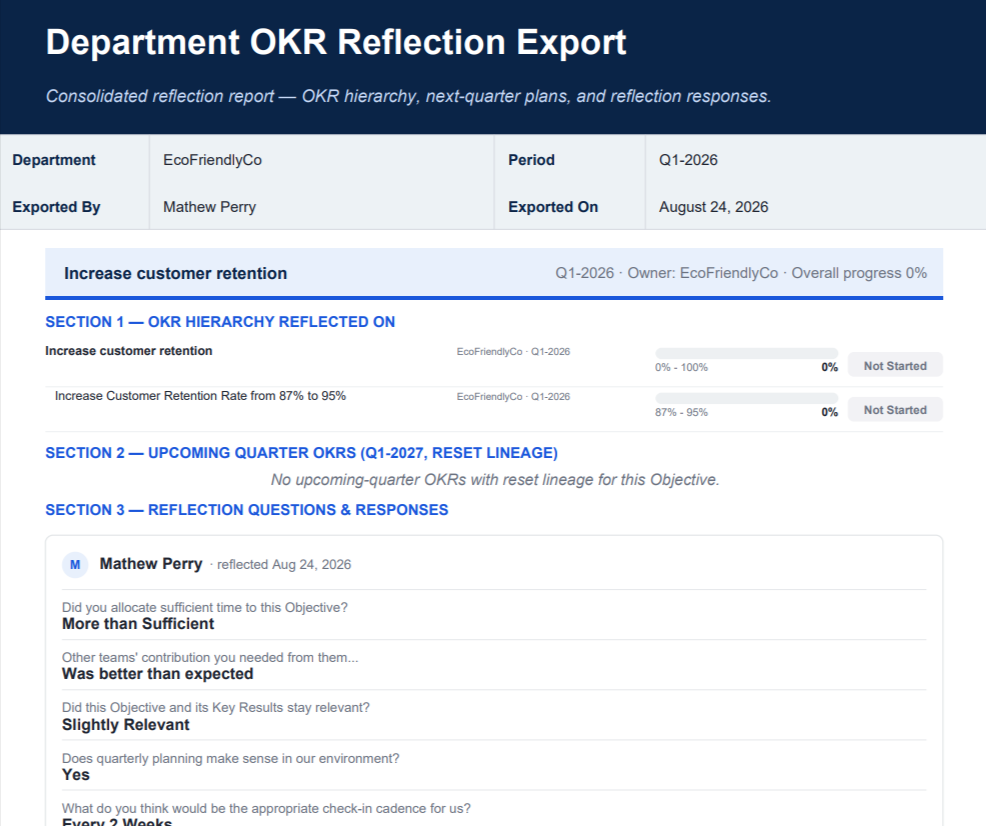
Department heads can now export a consolidated PDF of their department's reflection cycle directly from the OKR list page. The export brings together the OKR hierarchy, next- quarter OKRs, and reflection responses into a single structured document , organised by objective, eliminating the need to manually compile information from multiple screens. The export is available to all users with reset/reflect access to the department.
How It Works
- Navigate to the required department.
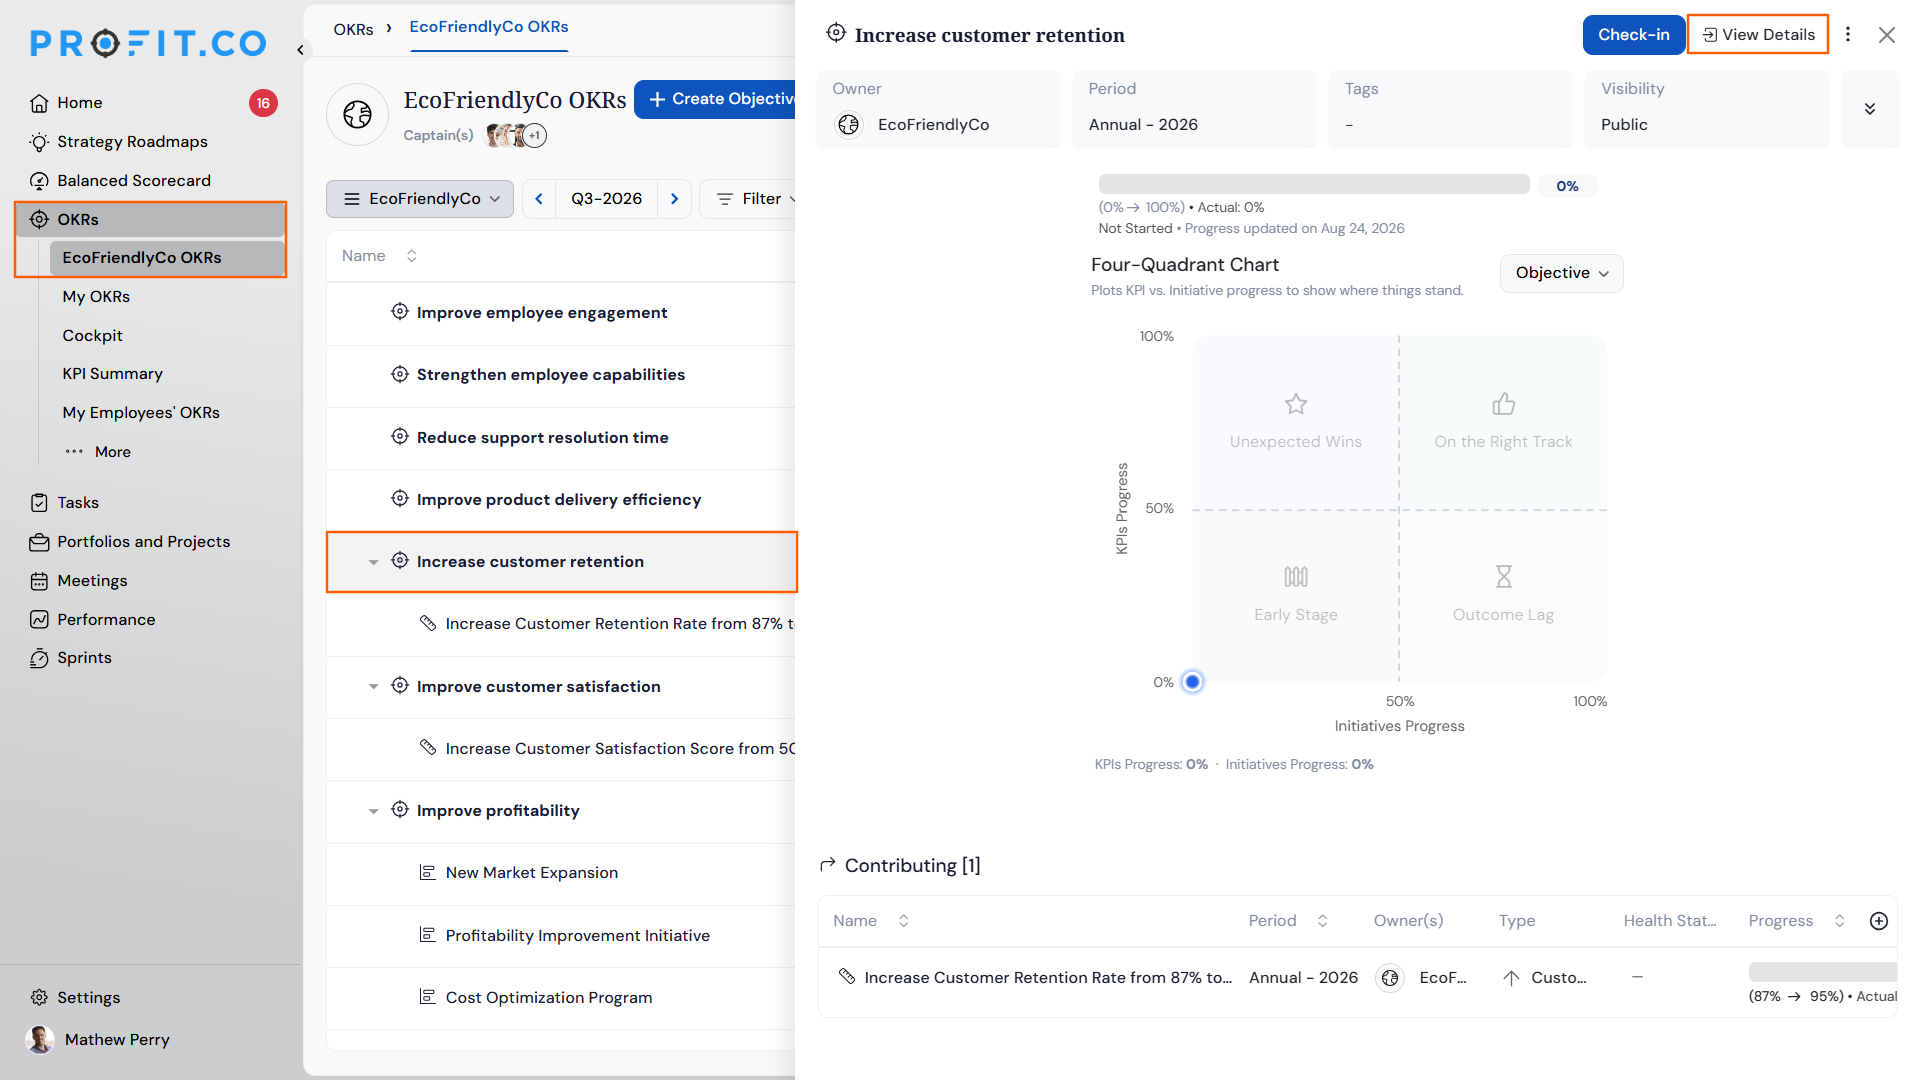
- Choose the required OKR for which you want to export the reflection dashboard.
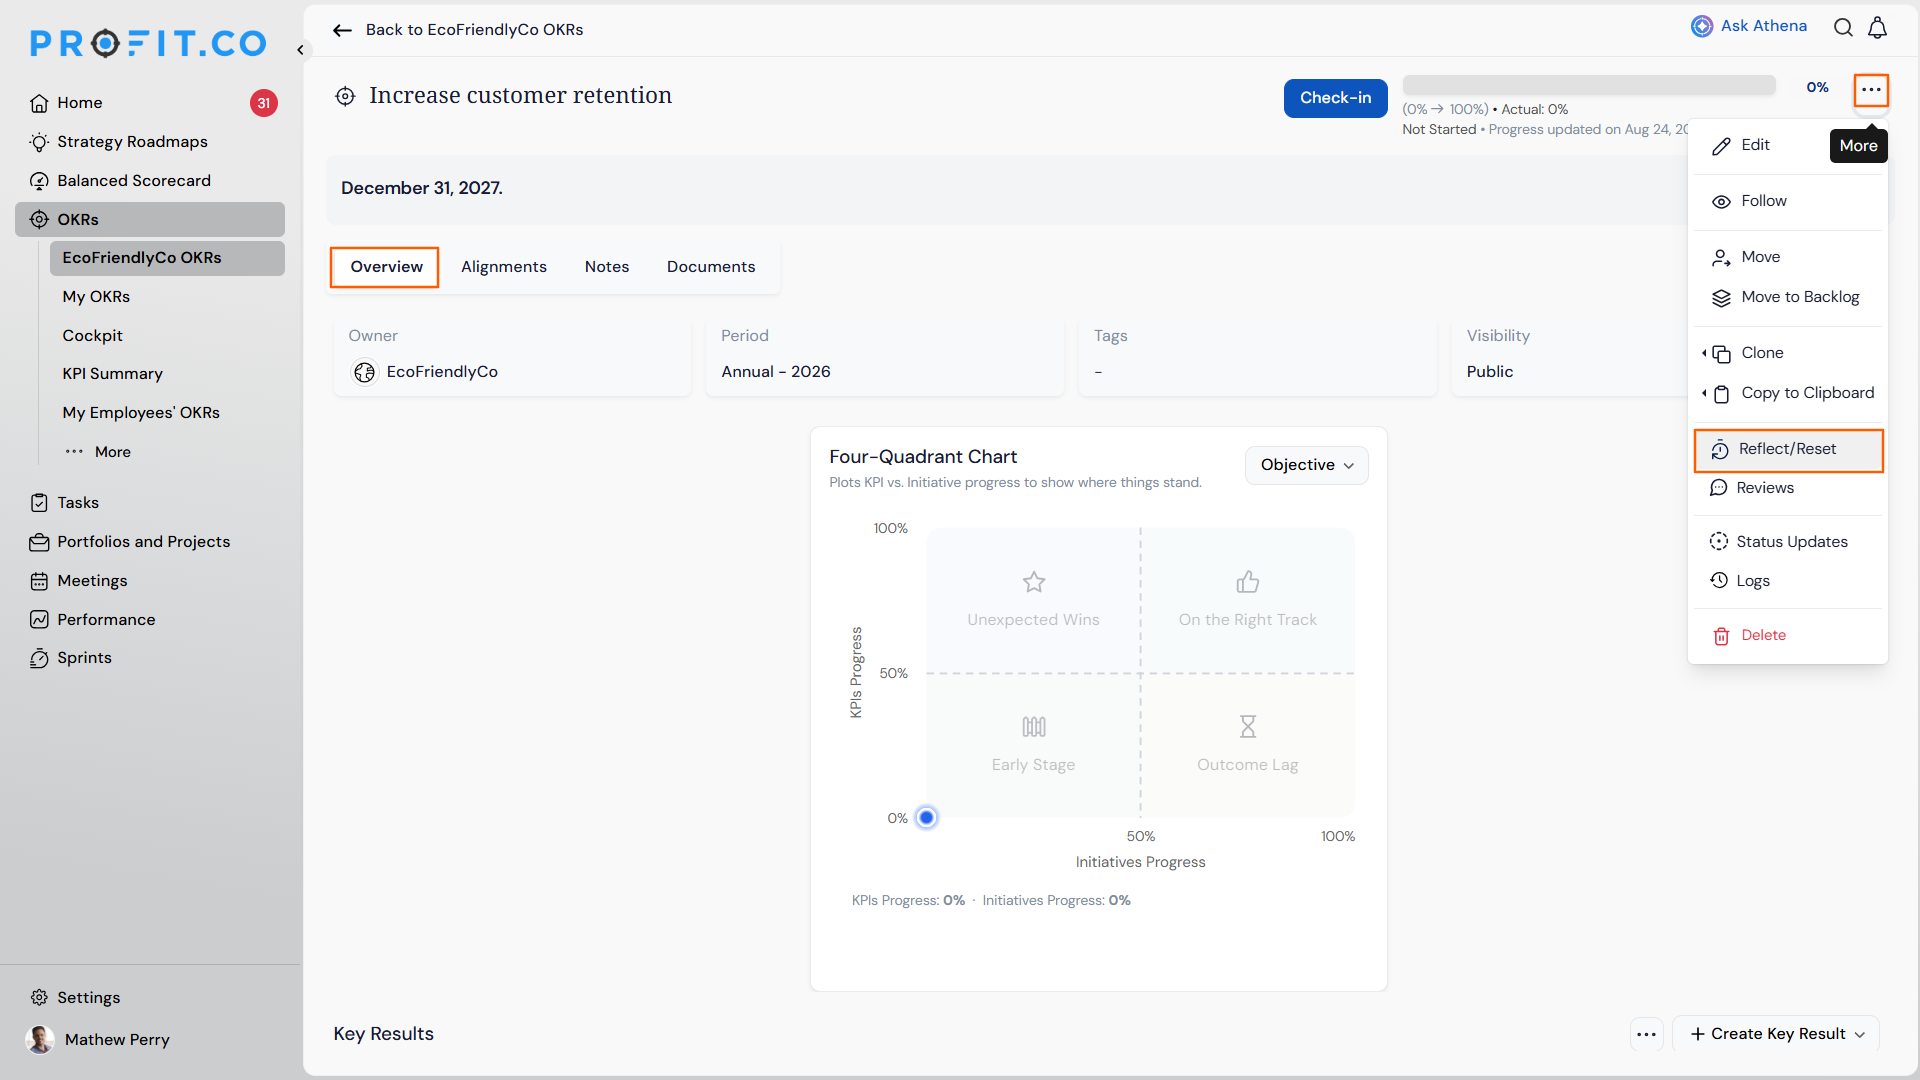
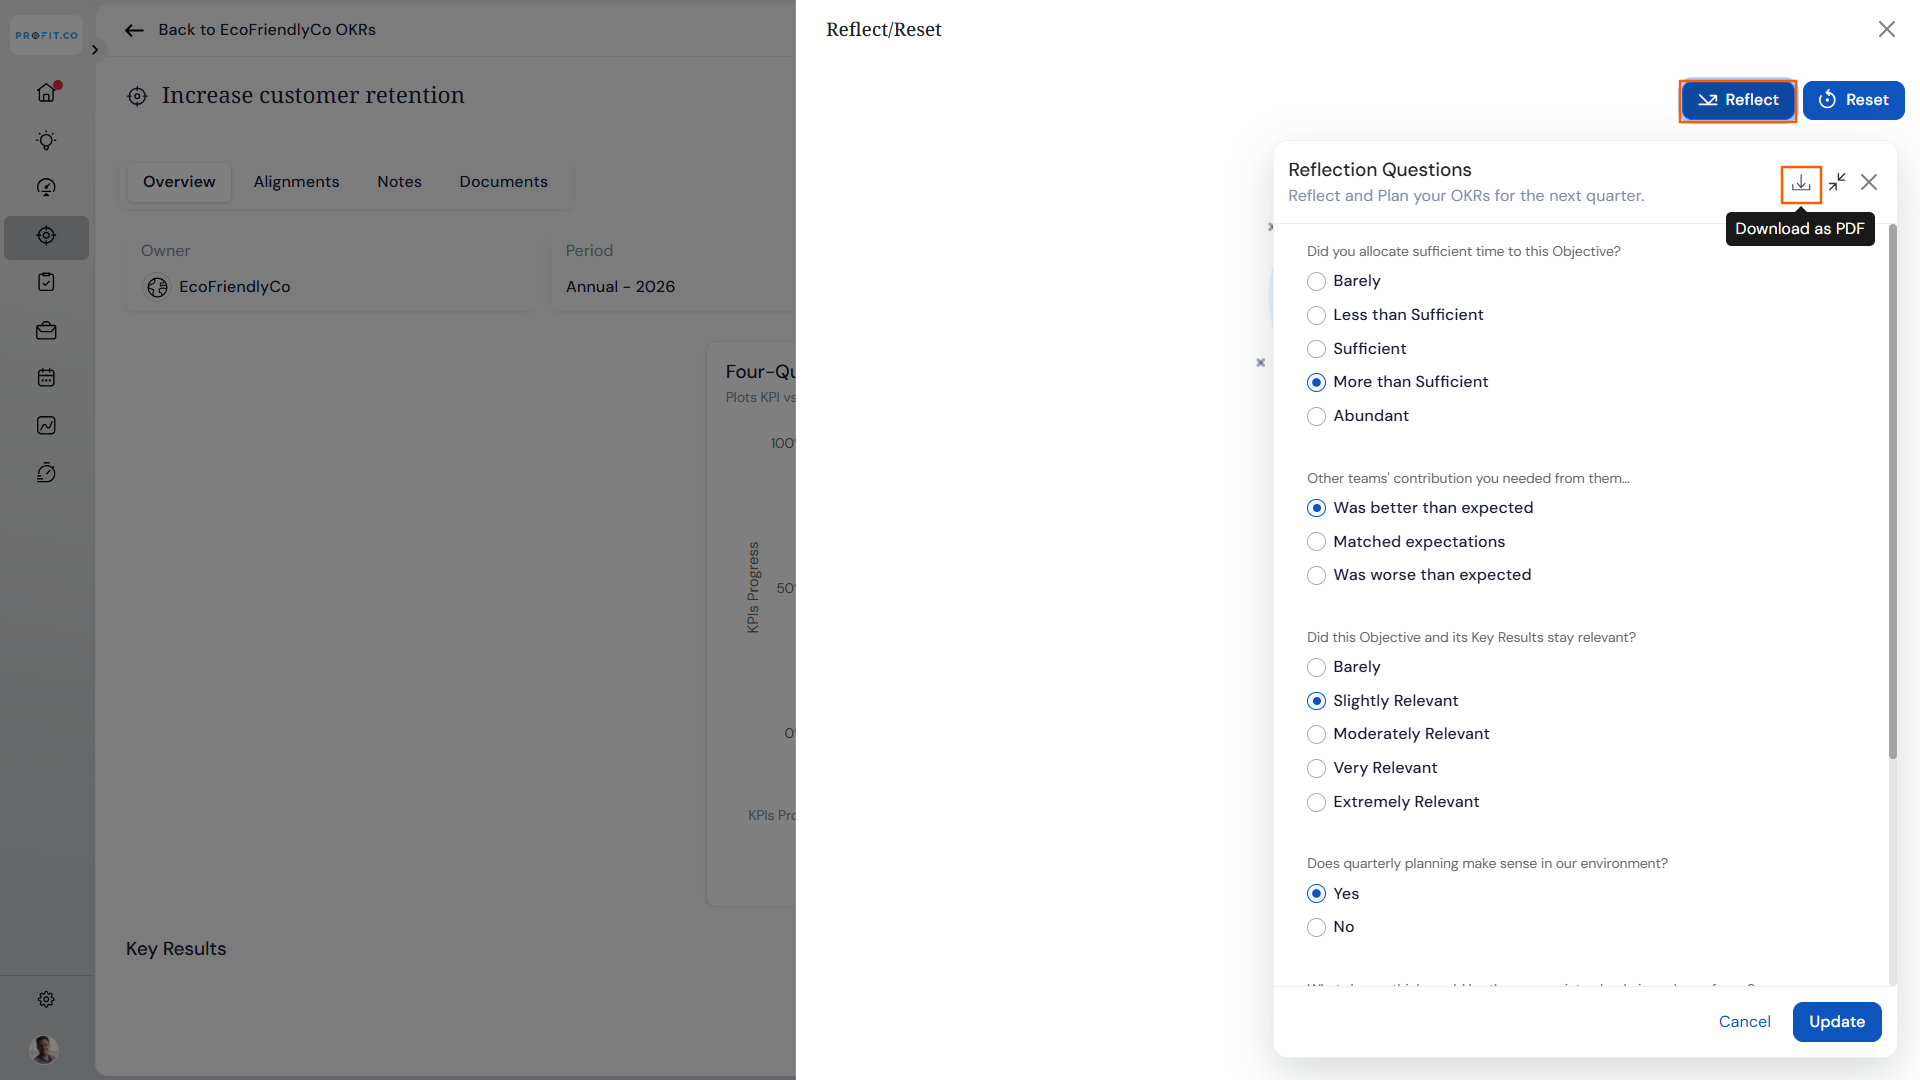
- Click View Details. On the Overview page, click More Options and choose Reflect/Reset.
- Click Download as PDF , this option is visible only to users with reset/reflect access.
- The PDF downloads automatically, headed with the department name, period, exporter name, and timestamp.
- The downloaded PDF is organised by objective and contains four sections:
- Section 1 , OKR Hierarchy Reflected On: Lists the full OKR hierarchy for the selected department and period, including name, owner, progress, and status for each item.
- Section 2 , Upcoming Quarter OKRs: Lists the next- quarter OKRs linked to each objective through the reset process. If no reset- linked OKRs exist for an objective, this section shows an empty- state note.
- Section 3 , Reflection Questions & Responses: Shows the reflection responses recorded against each objective, attributed by name.
- Section 4 , Newly Created OKRs: Lists any OKRs created independently for the upcoming quarter that are not linked to the current cycle through a reset.
Why It Matters
- One document for the full reflection cycle: All OKR hierarchy details, next- quarter plans, and reflection responses are consolidated into a single structured PDF , ready to share with leadership or archive without any manual assembly.
- Always accurate and attributed: Responses are pulled directly from the system at the time of export and attributed by name, ensuring the document is reliable and traceable.
- Access- controlled by design: The export is available only to users with reset/reflect access , view- only users do not see the option, and exported content is filtered to match the exporter's existing OKR visibility.
4. Ownership Boundaries for Aligned OKRs
Overview
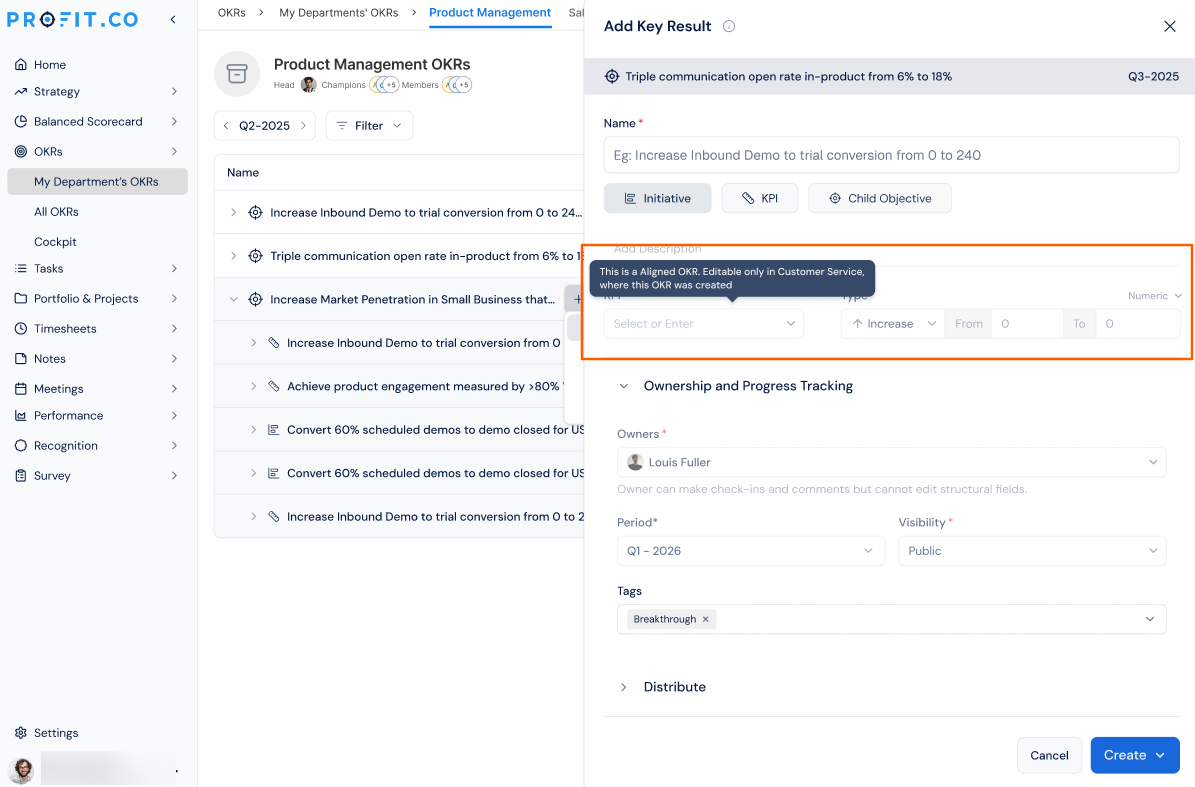
Profit.co now clearly identifies which department owns an aligned OKR and applies edit permissions accordingly. Users in a receiving department can view progress, check-in history, and comments on aligned OKRs, but fields that define the OKR , such as owner, target values, period, and name , are editable only by users with access in the owning department. When a field is restricted, the product explains why, names the owning department and owner, and links directly to the source record.
How It Works
- Open any OKR that has been aligned into your department from another department.
- The system checks your edit rights in the owning department and responds accordingly:
- If you have edit rights in the owning department: All fields are fully editable. No restrictions apply.
- If you do not have edit rights in the owning department: The eight definitional fields , owner, assigned users, KPI, key result type, from value, to value, period, and name , are read- only.
- Hovering over any locked field shows a one- line explanation of why it is restricted.
- Check-ins, comments, progress updates, and roll- up continue to work as normal regardless of edit rights.
- Any changes made to protected fields are recorded in the audit log with the actor, their department, and the owning department.
Why It Matters
- No more silent failures: Users who cannot edit a protected field now immediately see why, who owns the record, and where to go to make the change , without raising a support ticket.
- Source records are protected: Definitional fields on aligned OKRs can only be changed from the owning department, preventing unintended changes from being written across department boundaries.
- Rights are person- specific: Two users opening the same aligned OKR may correctly see different edit access, based on each person's rights in the owning department , not a blanket lock on the record.
5. Convert OKR Items to a Different Type
Overview
Users can now convert OKR items directly from the action menu without deleting and recreating them. Objectives, child objectives, and initiatives can be restructured within the hierarchy based on defined conversion rules, and all check-in history and comments are preserved through the conversion. The system automatically checks and handles any child items that need to be adjusted to remain compatible under the new parent.
How It Works
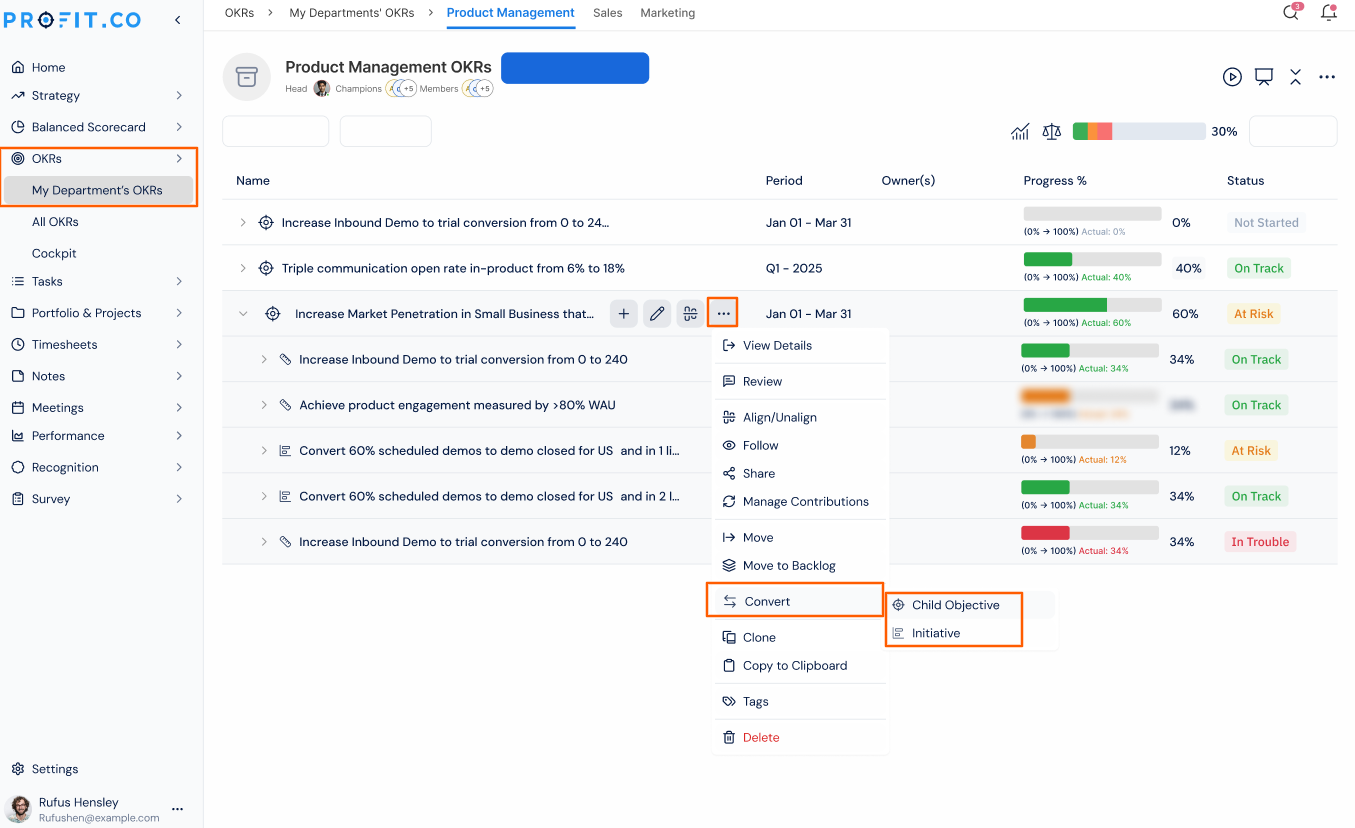
- Open the item to be converted and click Convert from the action menu.
- Select the destination type based on the supported conversion paths below.
- Use the hierarchy picker to select the new parent , this can be anywhere in the hierarchy, including a different department or cycle.
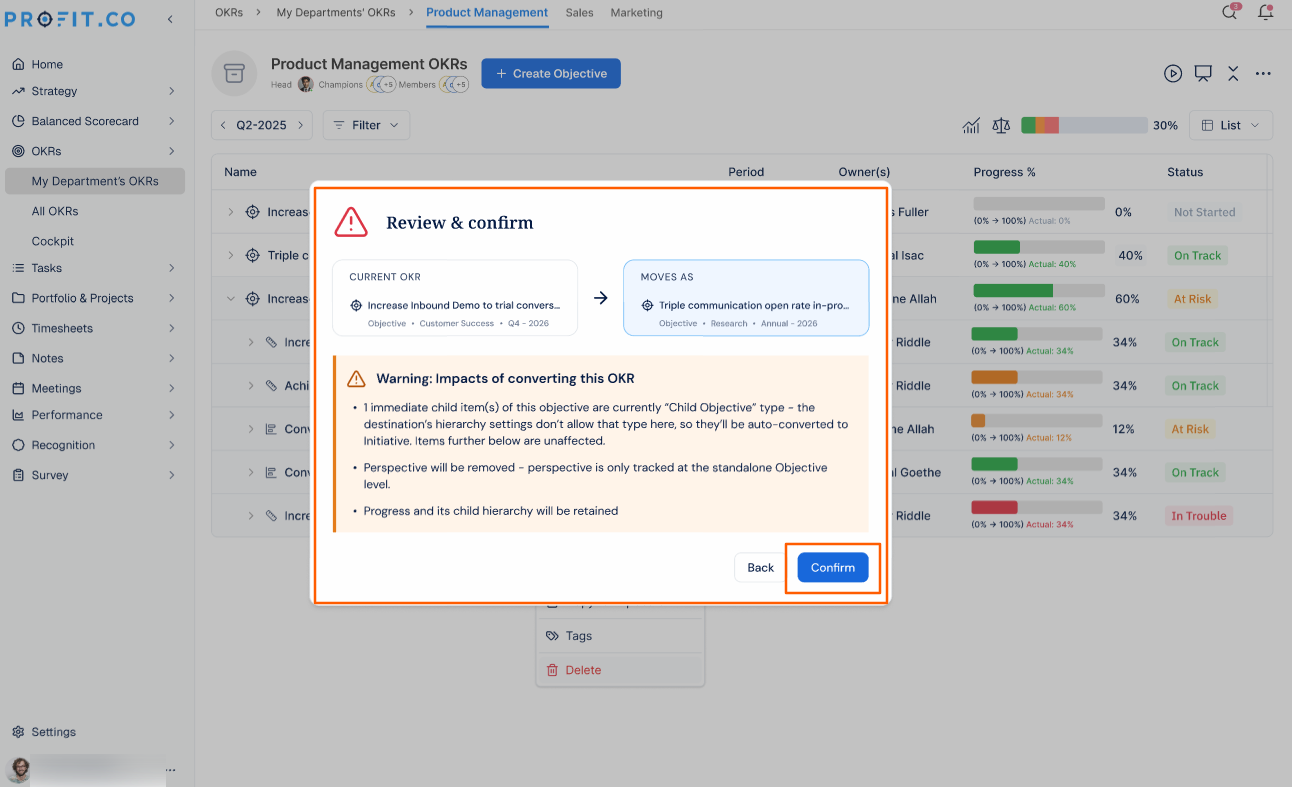
- The system runs a cascade check on any child items beneath the item being converted and auto- converts any that are incompatible with the new parent's settings.
- Review the summary of changes and confirm , the item and everything beneath it moves immediately, with all history intact.
Supported Conversion Paths
| From | To |
| Objective | Child Objective |
| Objective | Initiative (project- tracked key results only) |
| Child Objective | Initiative |
| Initiative | Child Objective |
Why It Matters
- No more loss of history: Check-ins, comments, and progress records are fully preserved on conversion , nothing needs to be manually noted down or re- entered.
- Correct hierarchy mistakes in place: Items misplaced during setup can be restructured instantly, without deleting and rebuilding one by one.
- Automatic child handling: The system resolves compatibility issues with child items automatically, so users don't have to manually adjust every item beneath the converted objective.
6. Restrict Edits on Reset Key Results
Overview
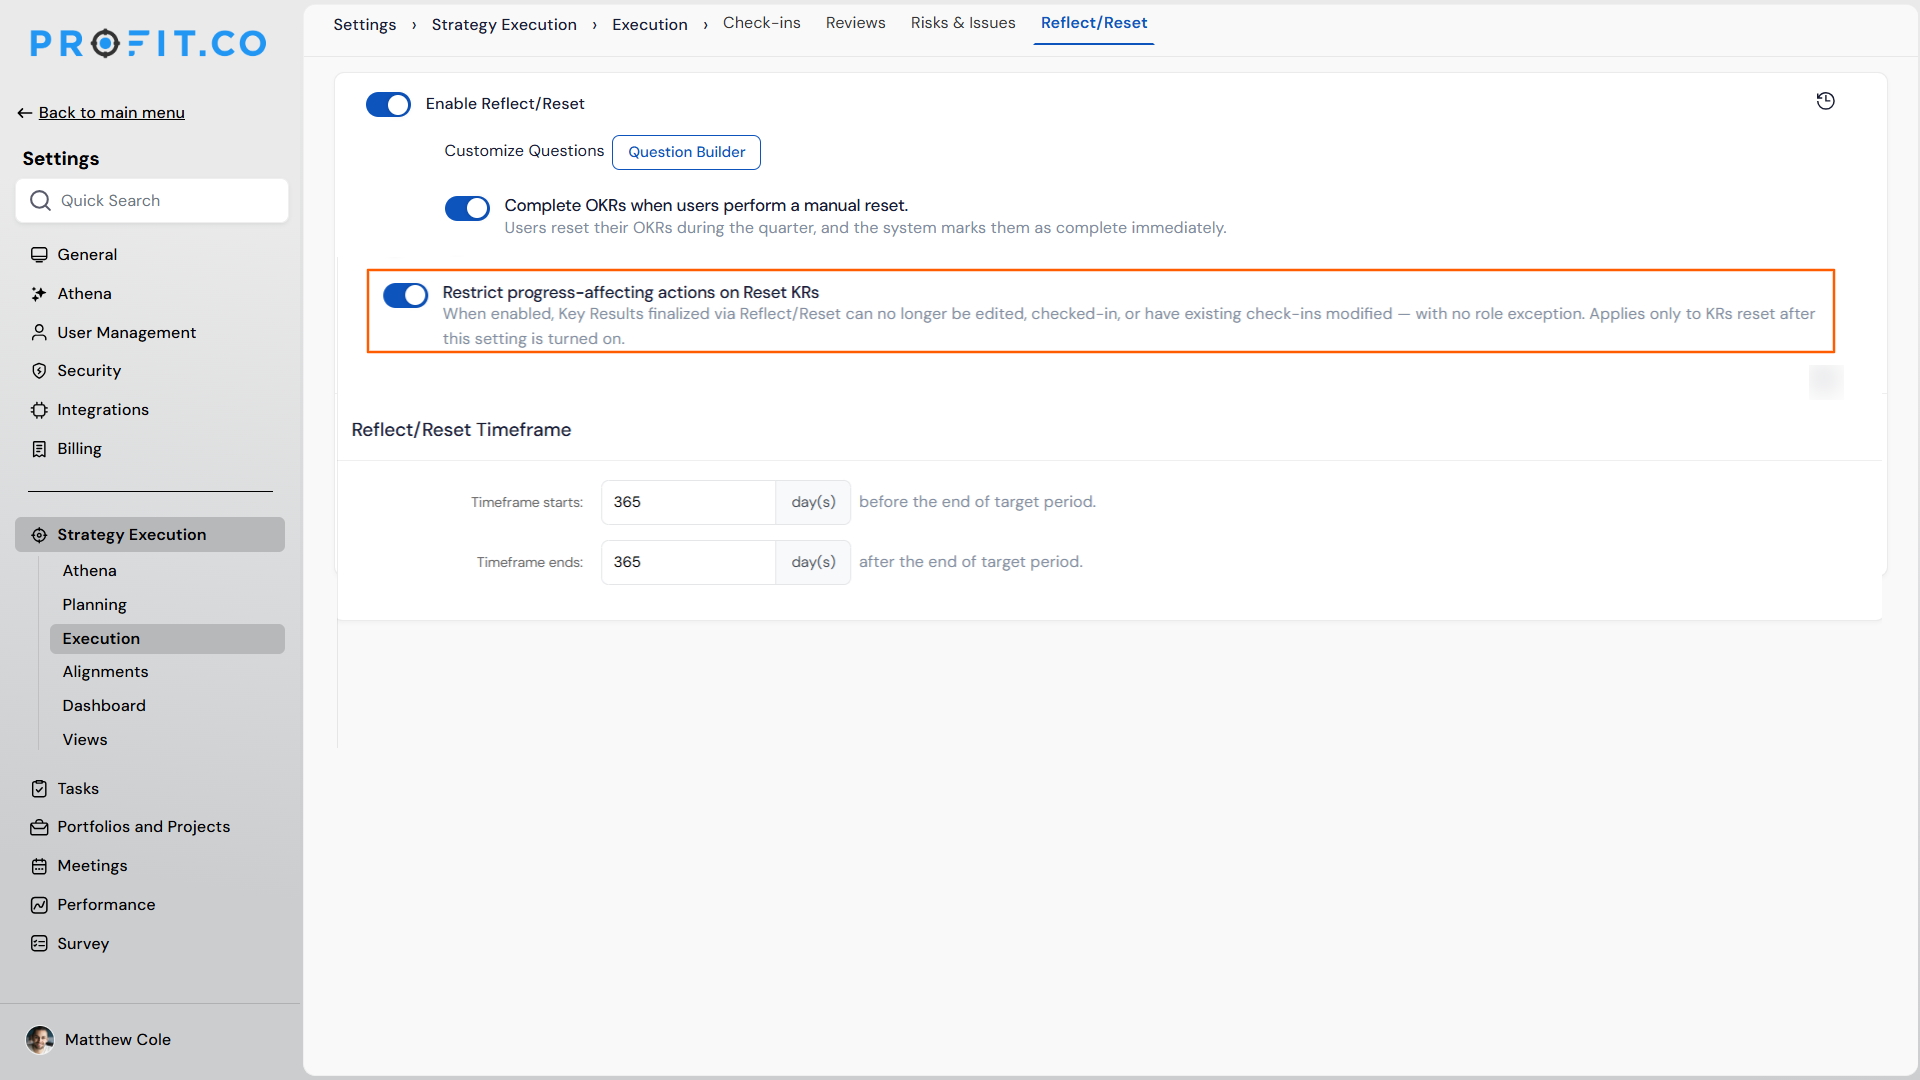
Administrators can now enable a setting that locks key results once they have been finalised through the Reflect/Reset process. When this setting is on, no user , regardless of role , can edit, check in, or modify existing check-ins on a reset key result. This ensures that finalised period data remains accurate and is not altered after the reflection cycle closes.
How It Works
- Navigate to Settings and enable the Restrict progress- affecting actions on Reset KRs toggle.
- Once enabled, any key result finalised through the Reflect/Reset process after this point is automatically locked.
- The following actions are restricted on locked key results:
- Editing the key result
- Adding new check-ins
- Modifying existing check-ins
- Moving the locked key result to a different position in the hierarchy
- Moving other key results into the locked key result
- The restriction applies to all users with no role exceptions.
- Key results that were reset before the setting was turned on are not affected.
Why It Matters
- Finalised data stays intact: Once a reflection cycle closes, reset key result data cannot be altered , preserving an accurate record of the period's performance.
- Consistent enforcement across all roles: The restriction applies universally, ensuring no user can inadvertently or intentionally change historical data.
- Administrator control: The setting is optional , organisations can choose to enforce it based on their governance requirements.
7. Live Preview When Building Saved Views
Overview
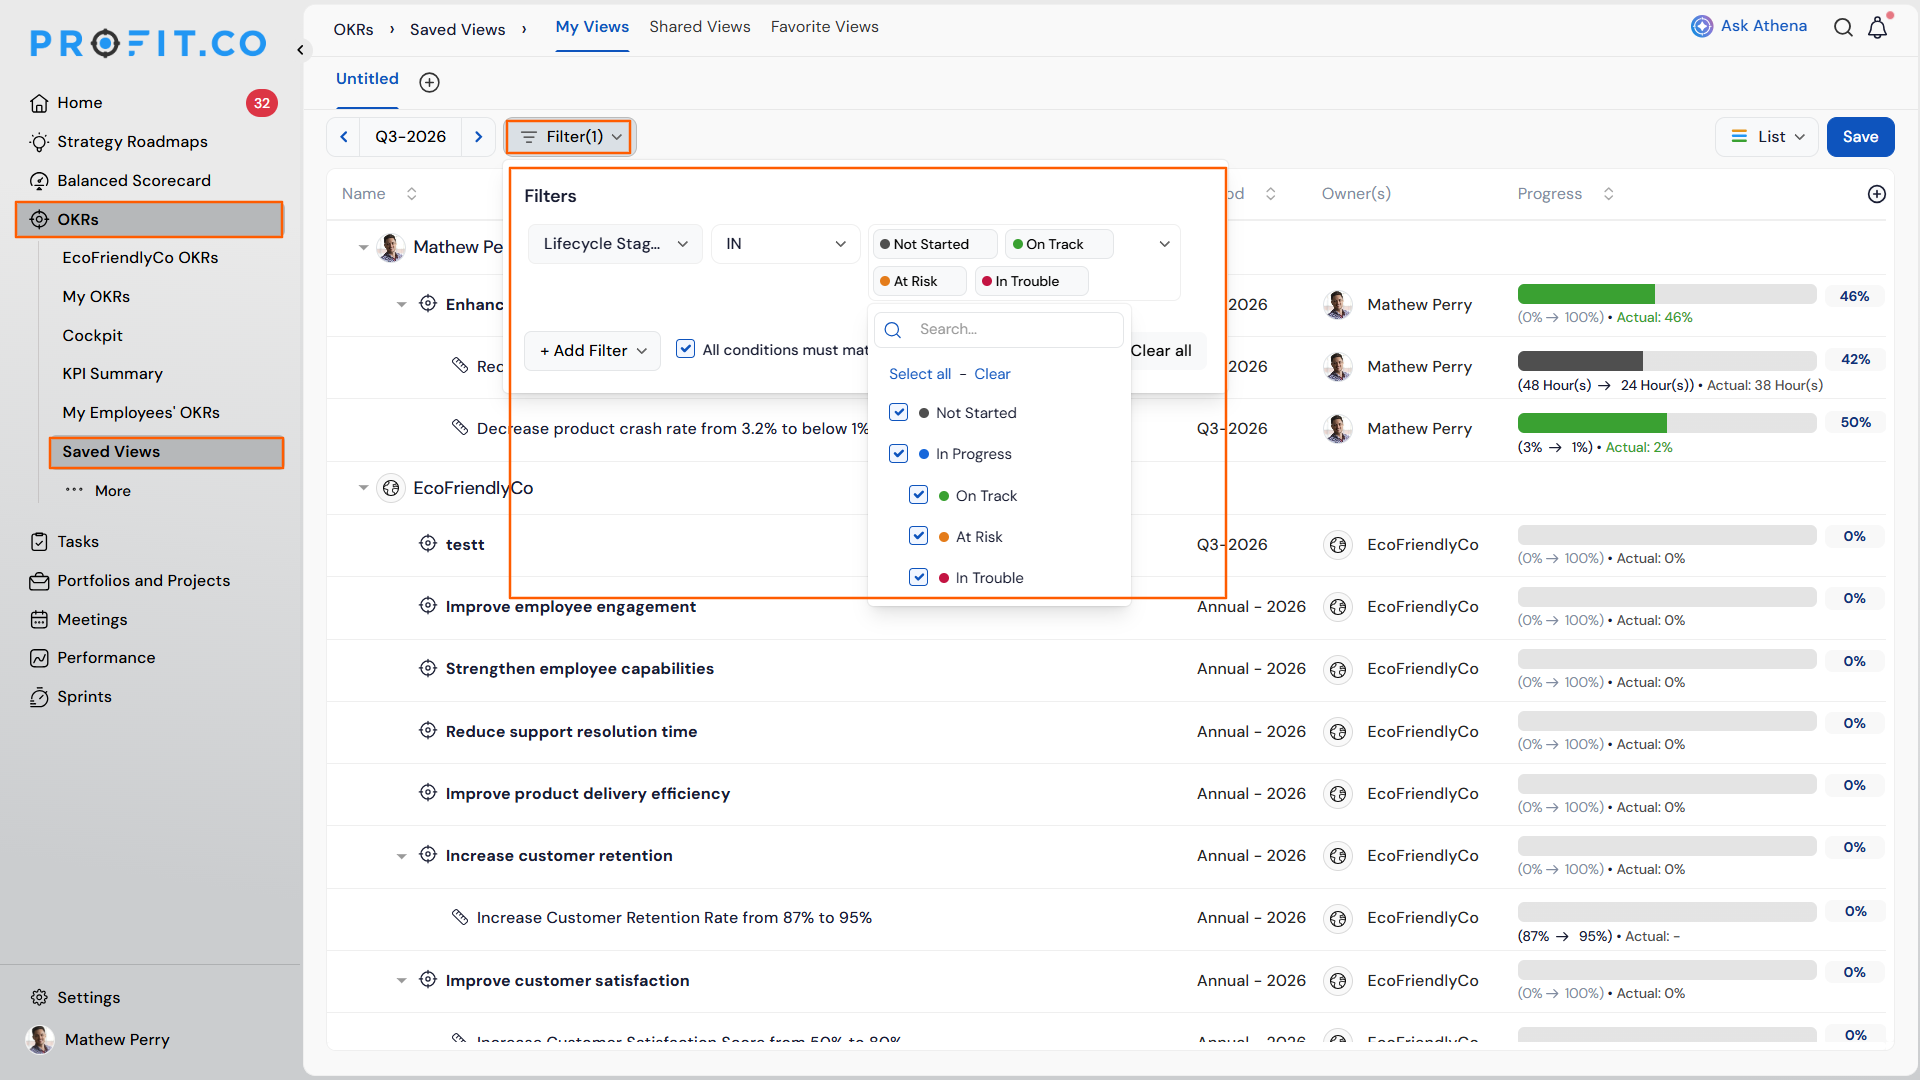
When creating or editing a Saved View in OKRs, users can now see the OKR list update in real time as filter conditions are applied , before saving the view. The filter panel opens directly over the OKR list, and the list behind it reflects the active conditions instantly, making it easy to verify and refine a filter before committing to it.
How It Works
- Navigate to OKRs → Saved Views and open Create View or Edit View.
- Click Filter to open the filter panel.
- Add or adjust filter conditions , the OKR list behind the panel updates in real time with each change, showing only the items that match the current conditions.
- Once the list reflects the expected results, click Save to save the view.
Why It Matters
- No more blind saves: Users can see exactly what a filter returns as they build it , without saving and re- inspecting.
- Faster filter refinement: Conditions can be adjusted and verified in place, eliminating the back- and- forth of saving, checking, and editing again.
- Reliable saved views: Views built with a verified filter are more accurate and trustworthy when shared with colleagues for reporting.
8. Plan vs Actual Presentation Style in KR Progress-Hierarchical View
Overview
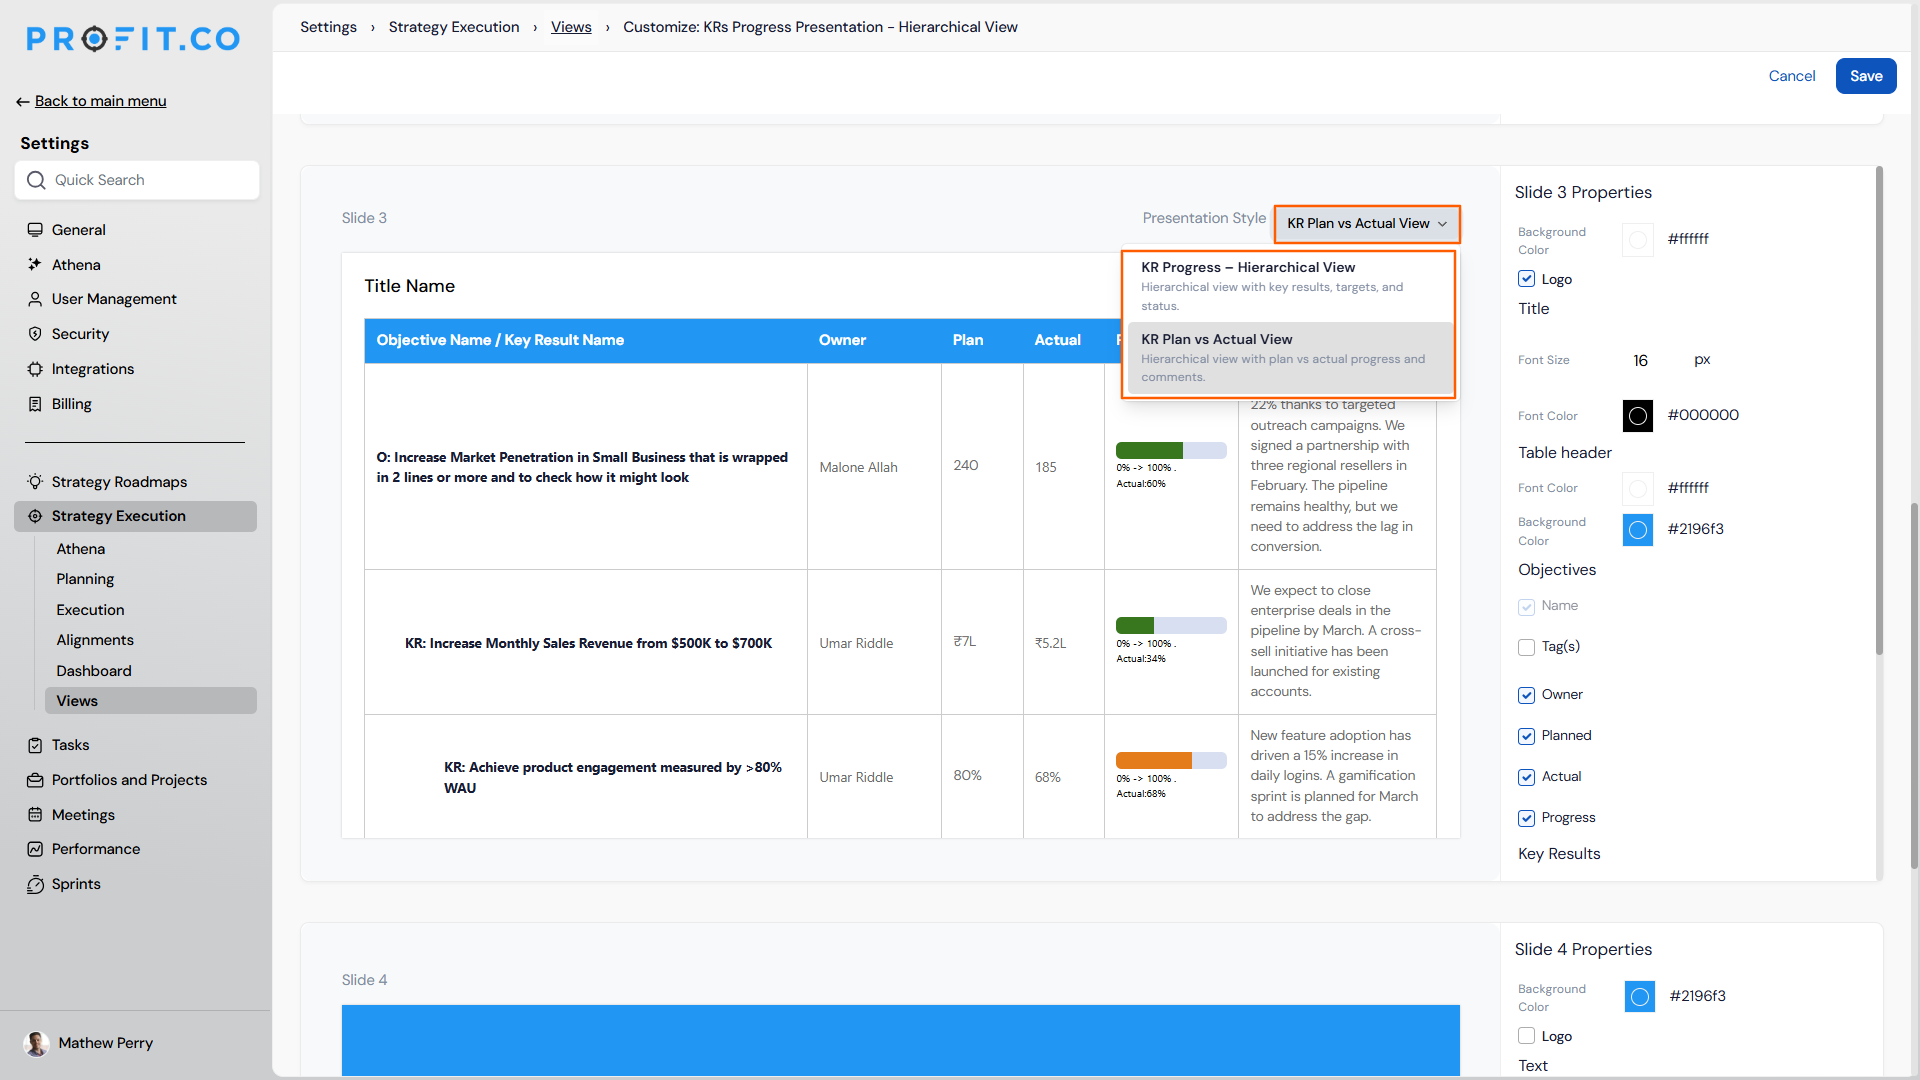
A new presentation style , KR Plan vs Actual View , is now available within the KR Progress Presentation , Hierarchical View. This style displays the full OKR hierarchy alongside plan, actual progress, and comments columns, giving leadership a clear side- by- side view of target versus actual performance in a ready- to- share PowerPoint format.
How It Works
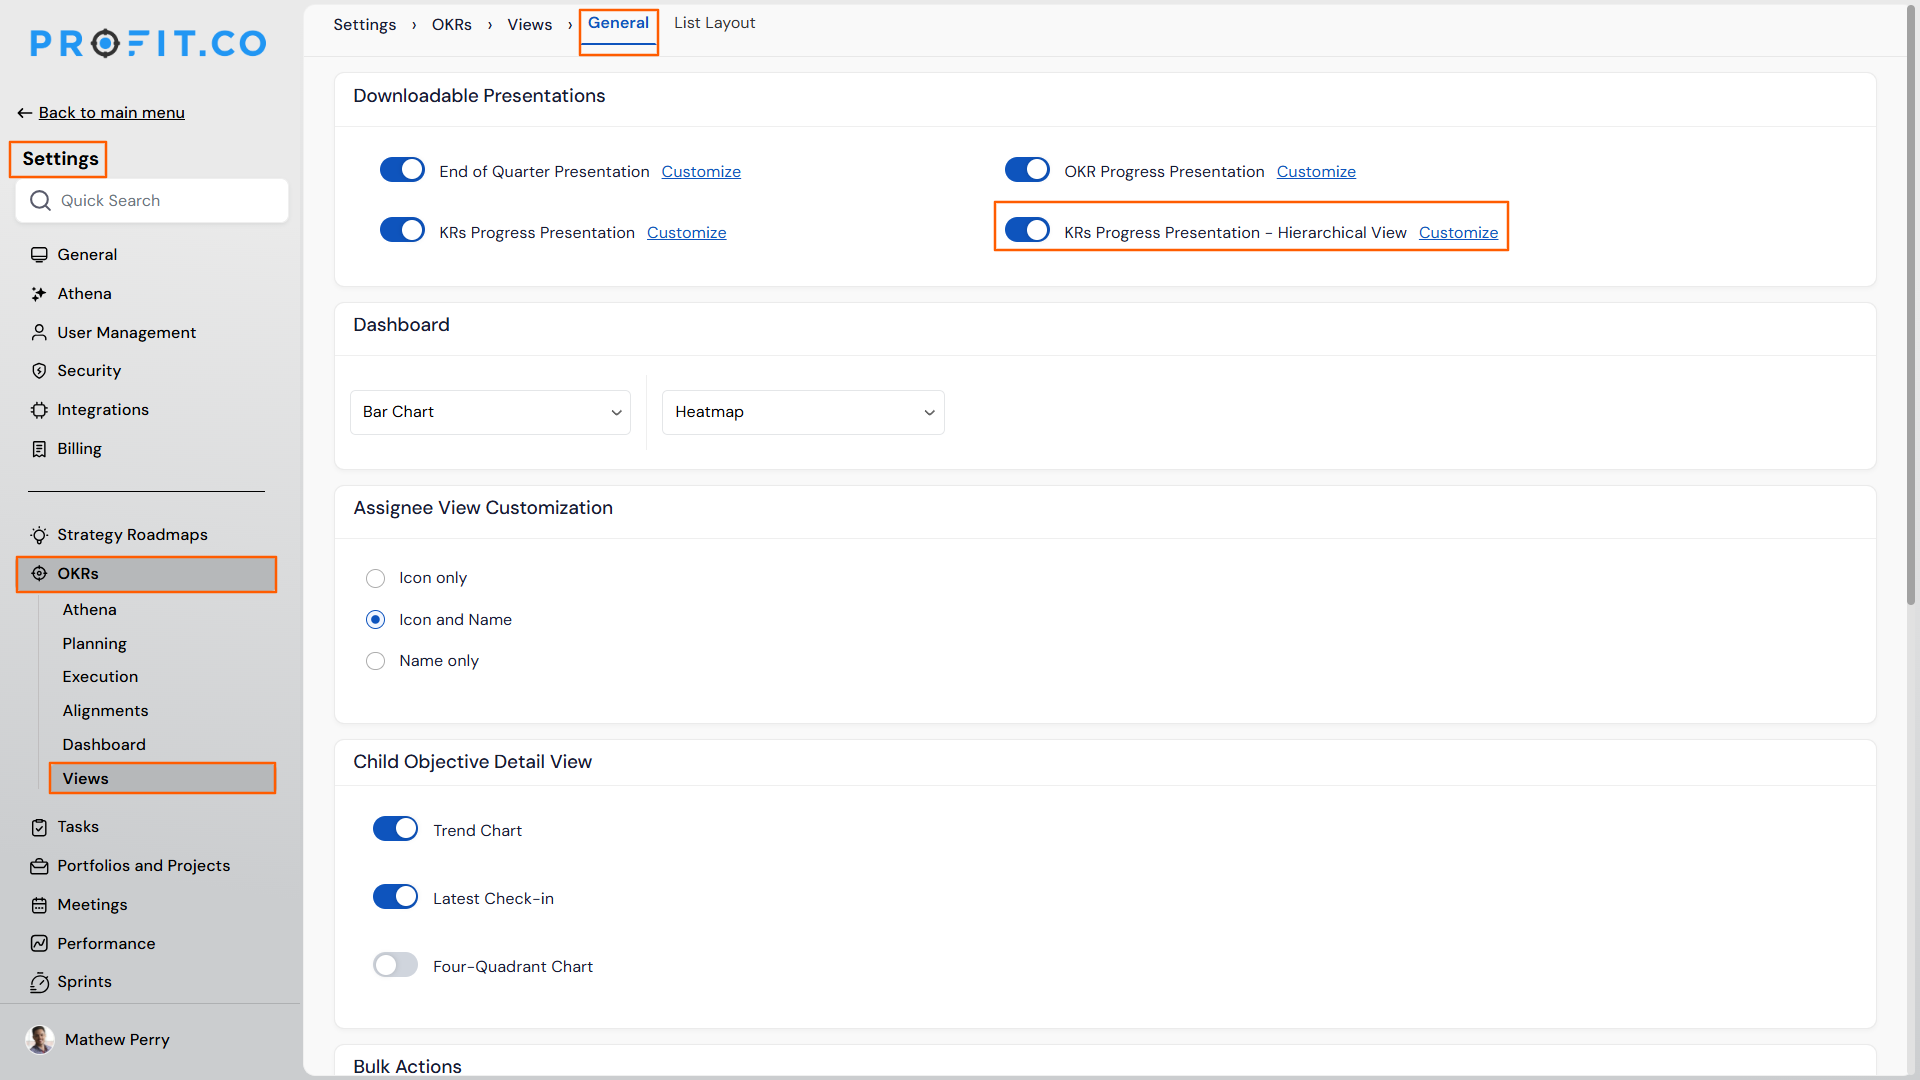
- Navigate to Settings → OKRs → Views→ General and open the KR Progress Presentation , Hierarchical View customisation.
- On the Presentation Style dropdown, select KR Plan vs Actual View.
- The slide preview updates to show the hierarchical view with objectives and key results, alongside Plan, Actual, and Comments columns.
- Click Download to export the presentation as a PowerPoint file.
Why It Matters
- Plan and actual in one view: Leaders can see target versus actual progress for every key result in a single slide, without switching between screens or manually compiling the data.
- Filter- aware export: The export reflects the active OKR filters, so teams can generate a scoped presentation for a specific department, owner, or franchise in seconds.
- Reusable for recurring reviews: The configured presentation style can be saved and reused each quarter, making review preparation faster and consistent.
9. Flexible Check-In Type for Key Results
Overview
Check-ins in Profit.co are now categorised into three types , Standard, Custom, and Flexible. The new Flexible check-in type allows users to log progress on a key result at any time, without being tied to a specific check-in date or frequency. Unlike Standard and Custom check-ins, Flexible check-ins do not appear in the check-in chart, do not show Plan vs Actual comparison, and are not included in the check-in discipline score.
How It Works
- Navigate to Settings → OKRs → Execution from the left navigation panel.
- Select the Check-ins tab and locate the Check-in Types section.
- Enable the Enable Flexible Check-ins toggle.
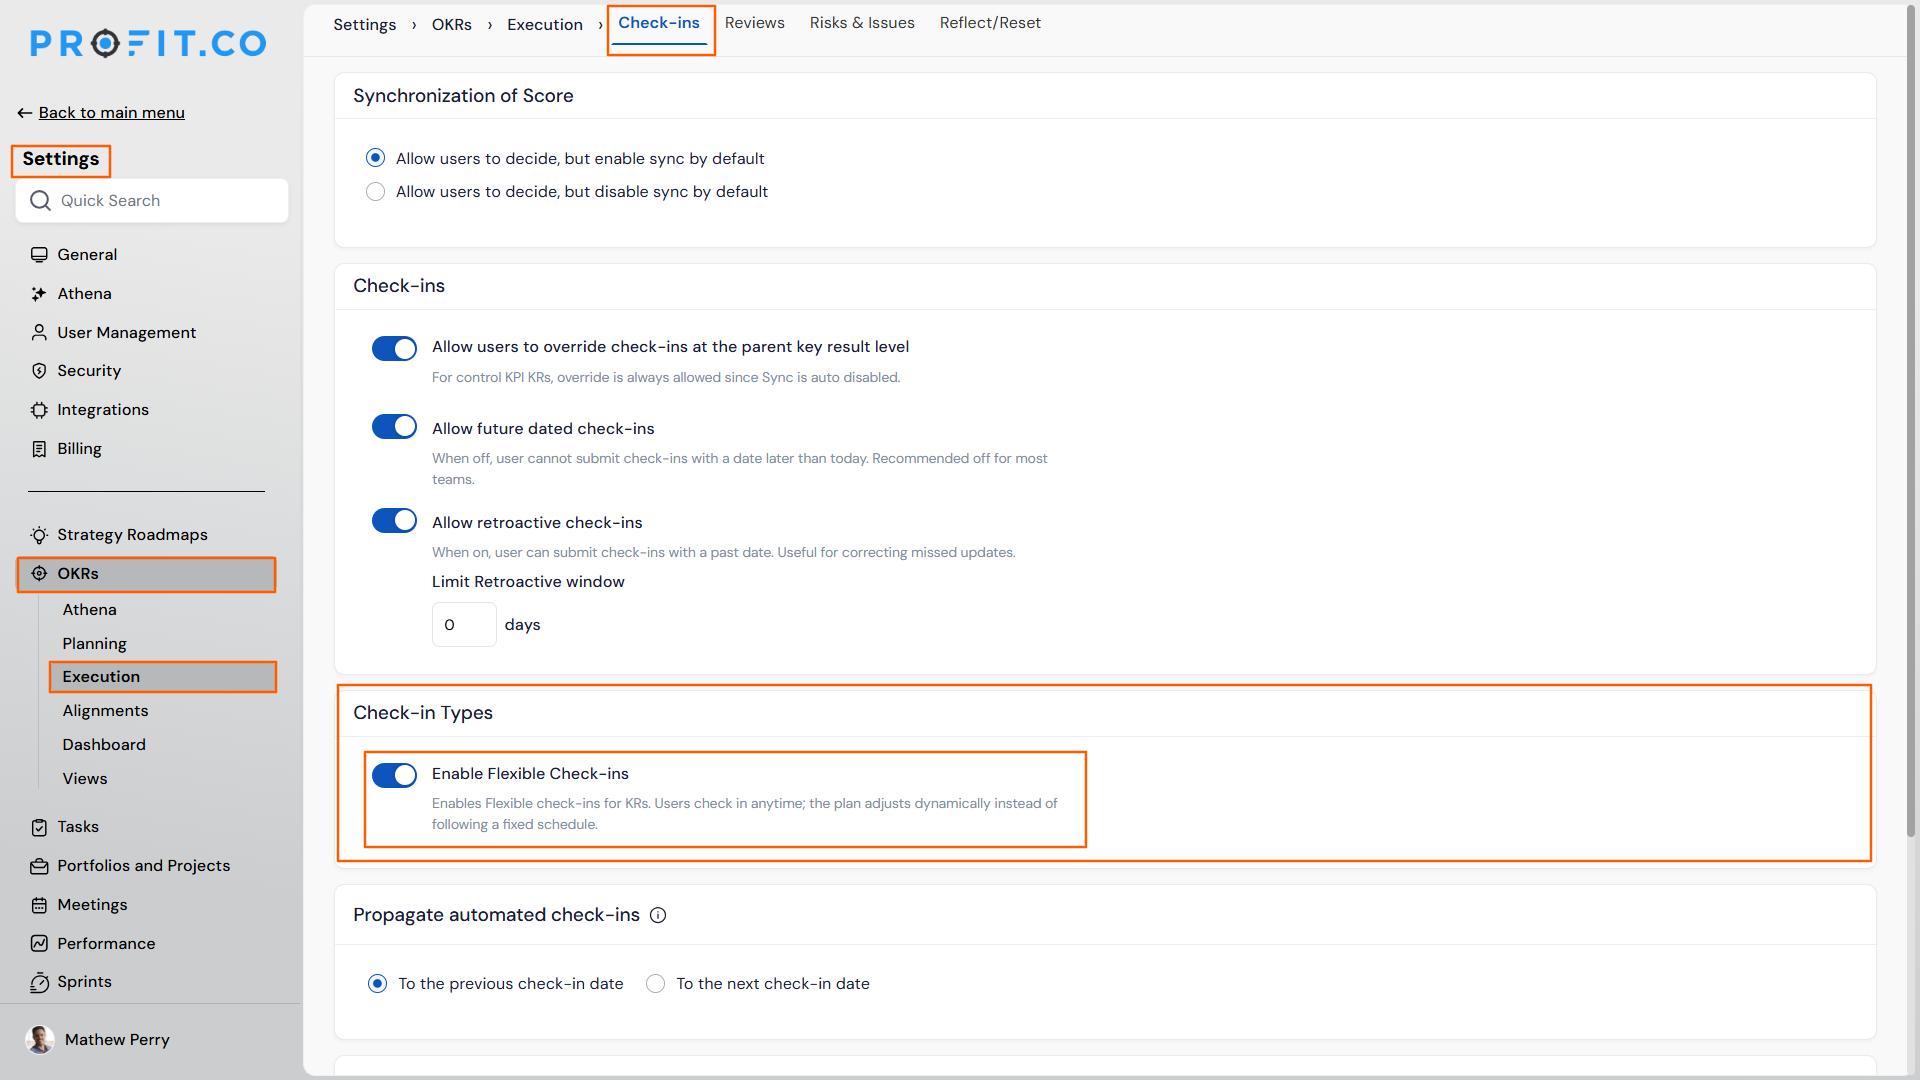
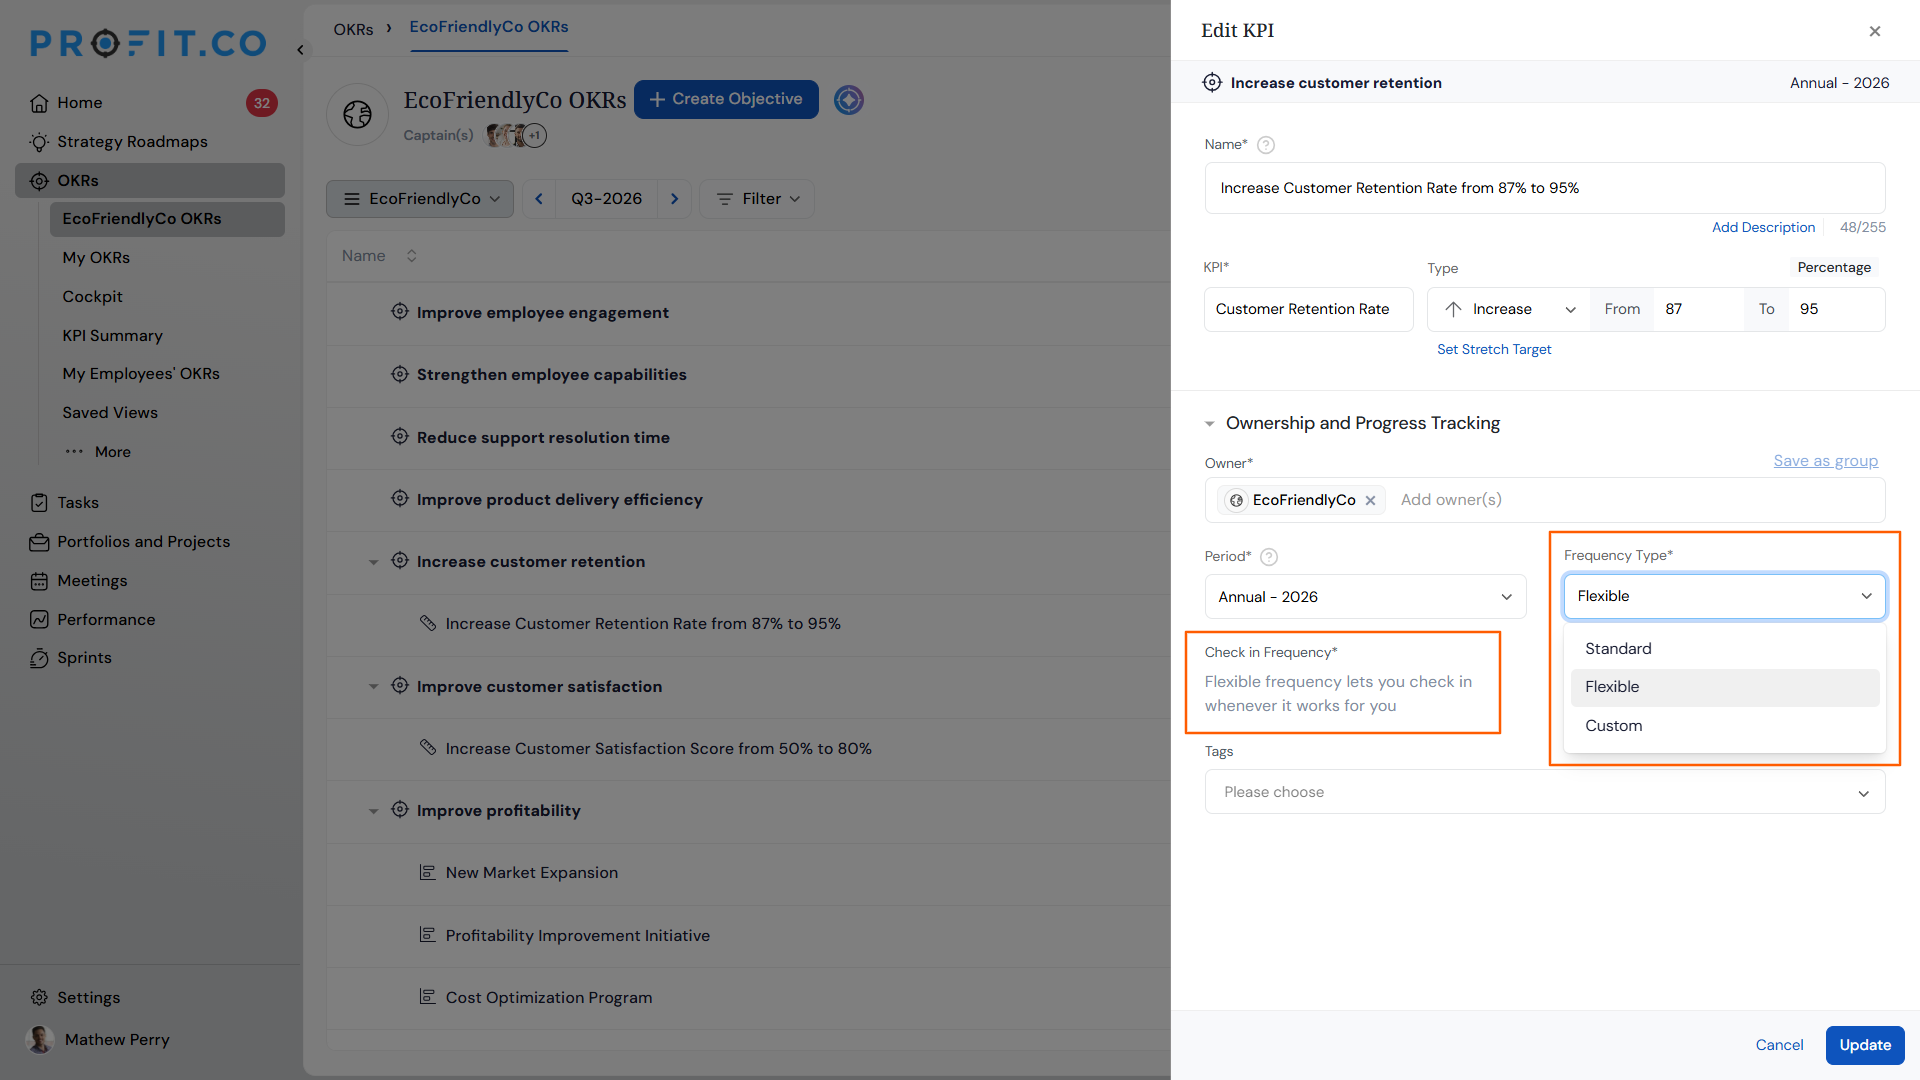
- Once enabled, Flexible is available as a check-in type when configuring a key result.
- Users assigned to a Flexible check-in key result can log progress at any time , there is no fixed check-in date or frequency requirement.
- Users can enter a value and add comments when checking in, just as with other check-in types.
Why It Matters
- No rigid schedule: Users can log progress whenever it makes sense for their work, rather than being constrained to a fixed check-in date.
- Reduced compliance pressure: Flexible check-ins are excluded from the check-in discipline score, making them suitable for key results where periodic tracking is not meaningful.
- Right type for the right result: Teams can now choose the check-in approach that best fits each key result , Standard for scheduled tracking, Custom for tailored frequencies, and Flexible for open- ended updates.
10. OKR Progress Reference During Reflection and PPP Review
Overview
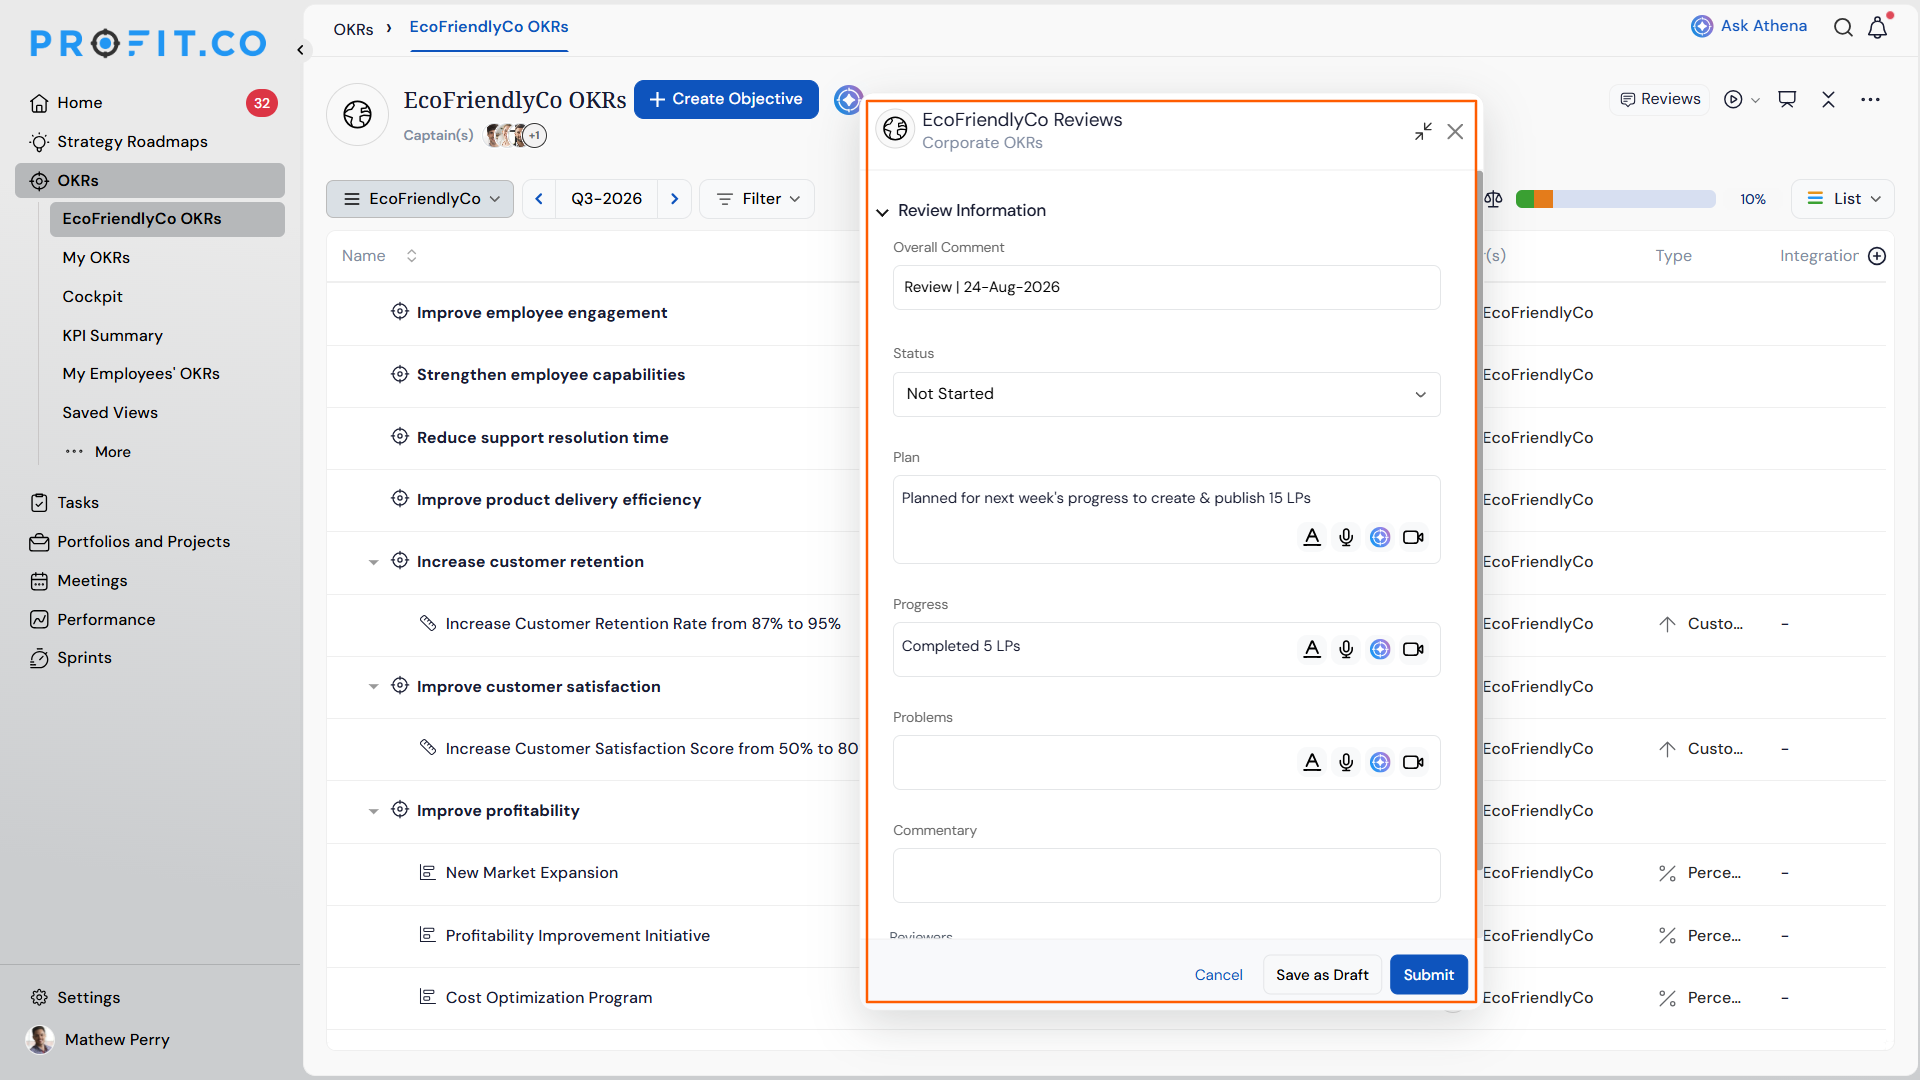
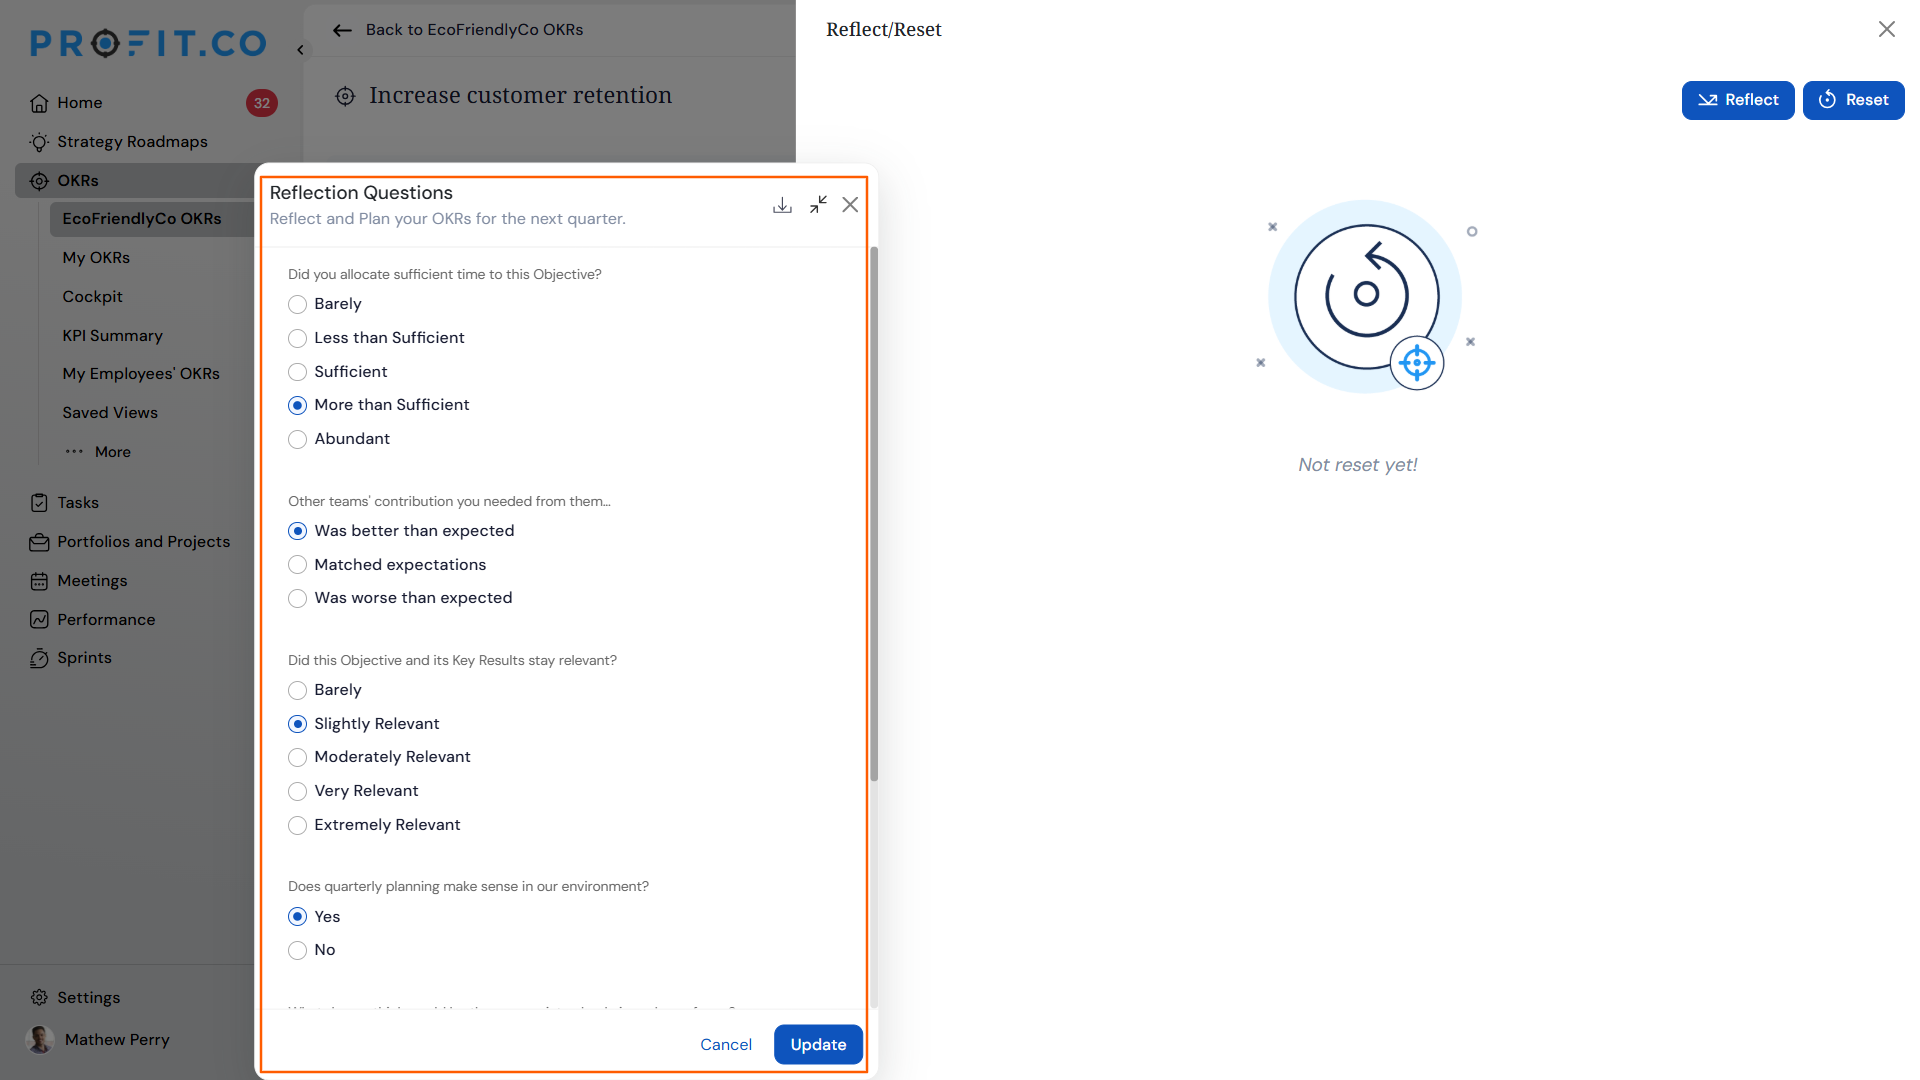
The Reflection Questions panel and the PPP Review panel now open in a split- view layout, showing a read- only OKR progress reference alongside the questions. Users can see the objective, all its key results, and linked initiatives , including name, period, owner, and progress , without leaving the screen. This ensures responses are informed by actual data rather than recalled from memory, both during end- of- cycle reflection and PPP reviews.
How It Works
- Navigate to an objective and click Reflect or open the PPP Review , the panel opens in a split view.
- The right side displays the reflection or PPP questions as before.
- The left side shows a read- only OKR progress reference with the objective and all its key results expanded by default, each showing name, period, owner, and progress.
- Optionally expand any key result to see its linked initiatives and their progress for deeper context.
- The panel can be dragged and repositioned anywhere on the screen to suit the user's preferred layout.
- Answer the questions informed by the visible data and submit , the submission process is unchanged.
Why It Matters
- Full context without leaving the screen: Users no longer need to exit the panel to check progress elsewhere , everything needed to answer accurately is accessible from the same view.
- Data- informed responses: Reflection and PPP answers are based on live progress data rather than memory, making responses more accurate and meaningful.
- Visibility- respecting reference: The OKR progress reference respects each user's existing role- based visibility , no additional data is exposed beyond what they can already see.
11. Company Branding in OKR Progress Presentation Export
Overview
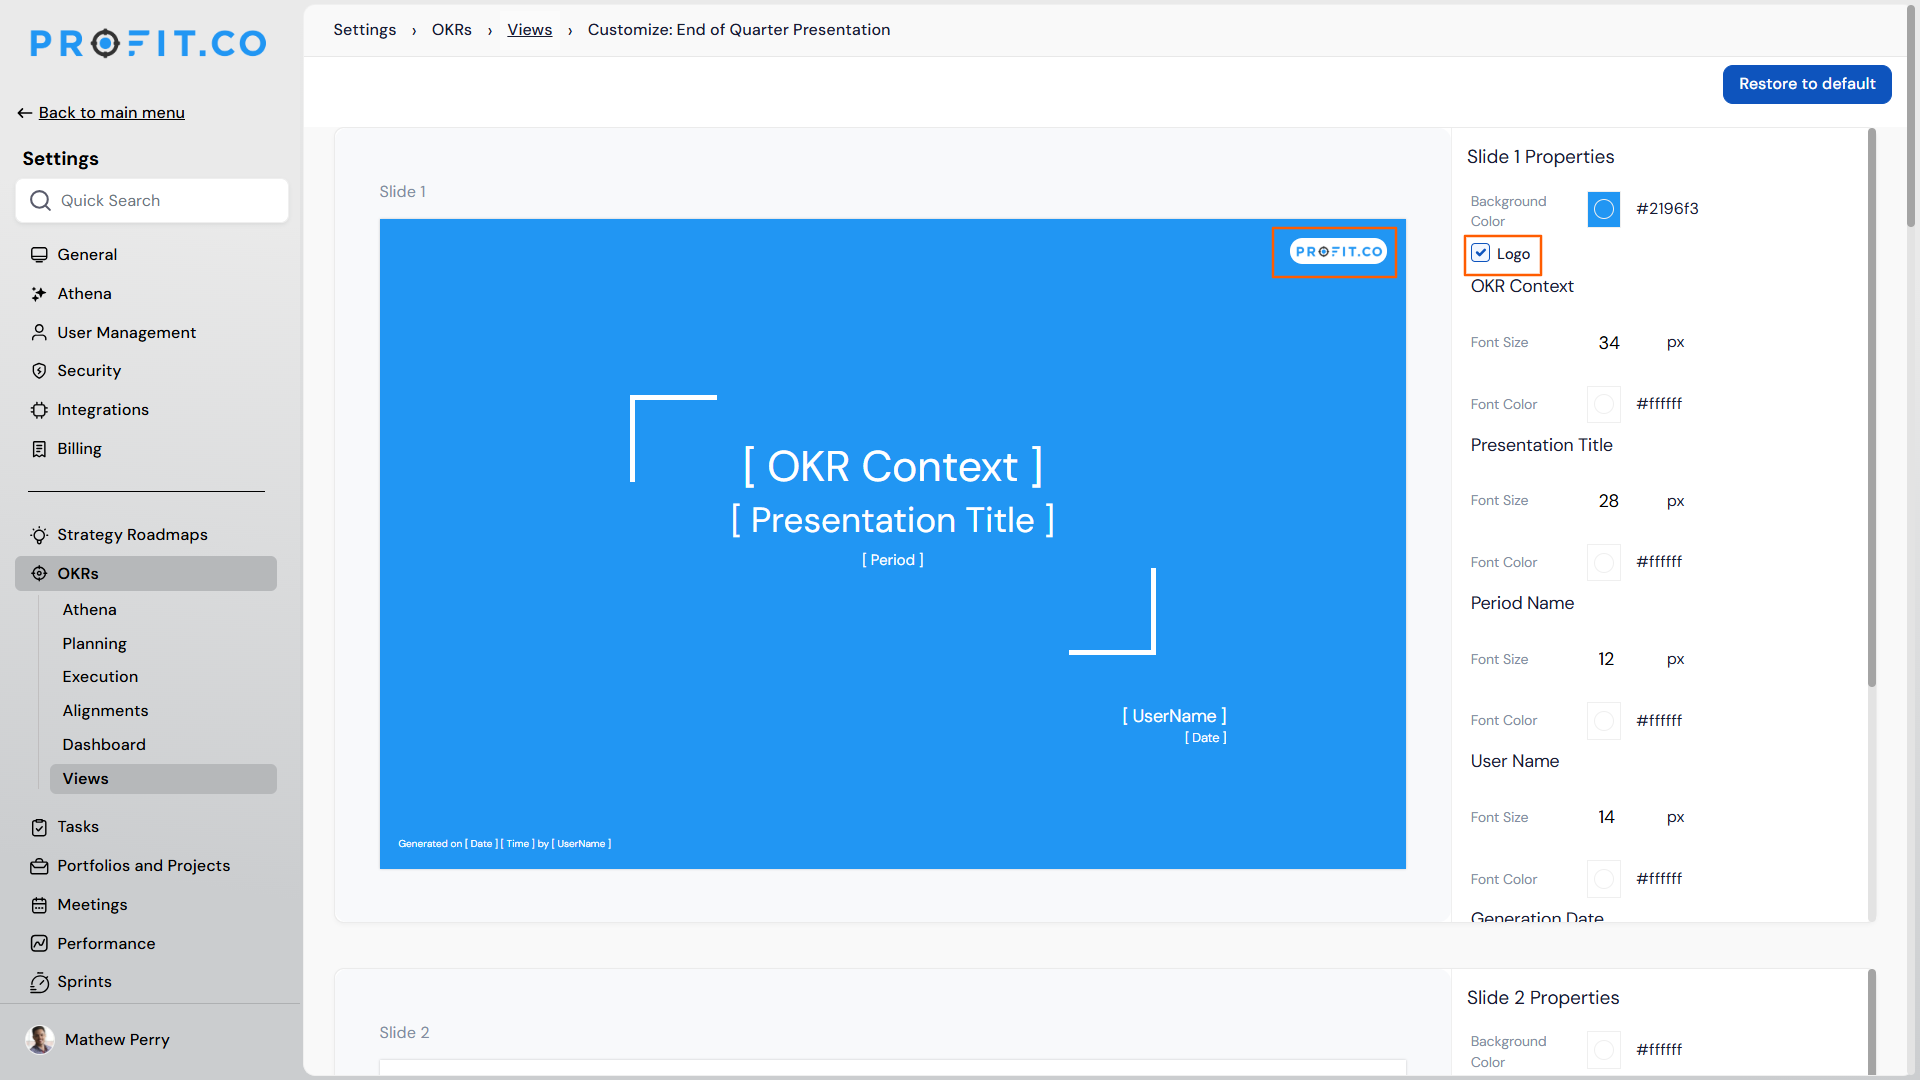
The OKR Progress Presentation PowerPoint export now supports company branding , administrators can enable the company logo and set brand colours directly in the presentation settings. Once configured, every slide in the exported deck reflects the company's branding automatically, with no manual editing required after export.
How It Works
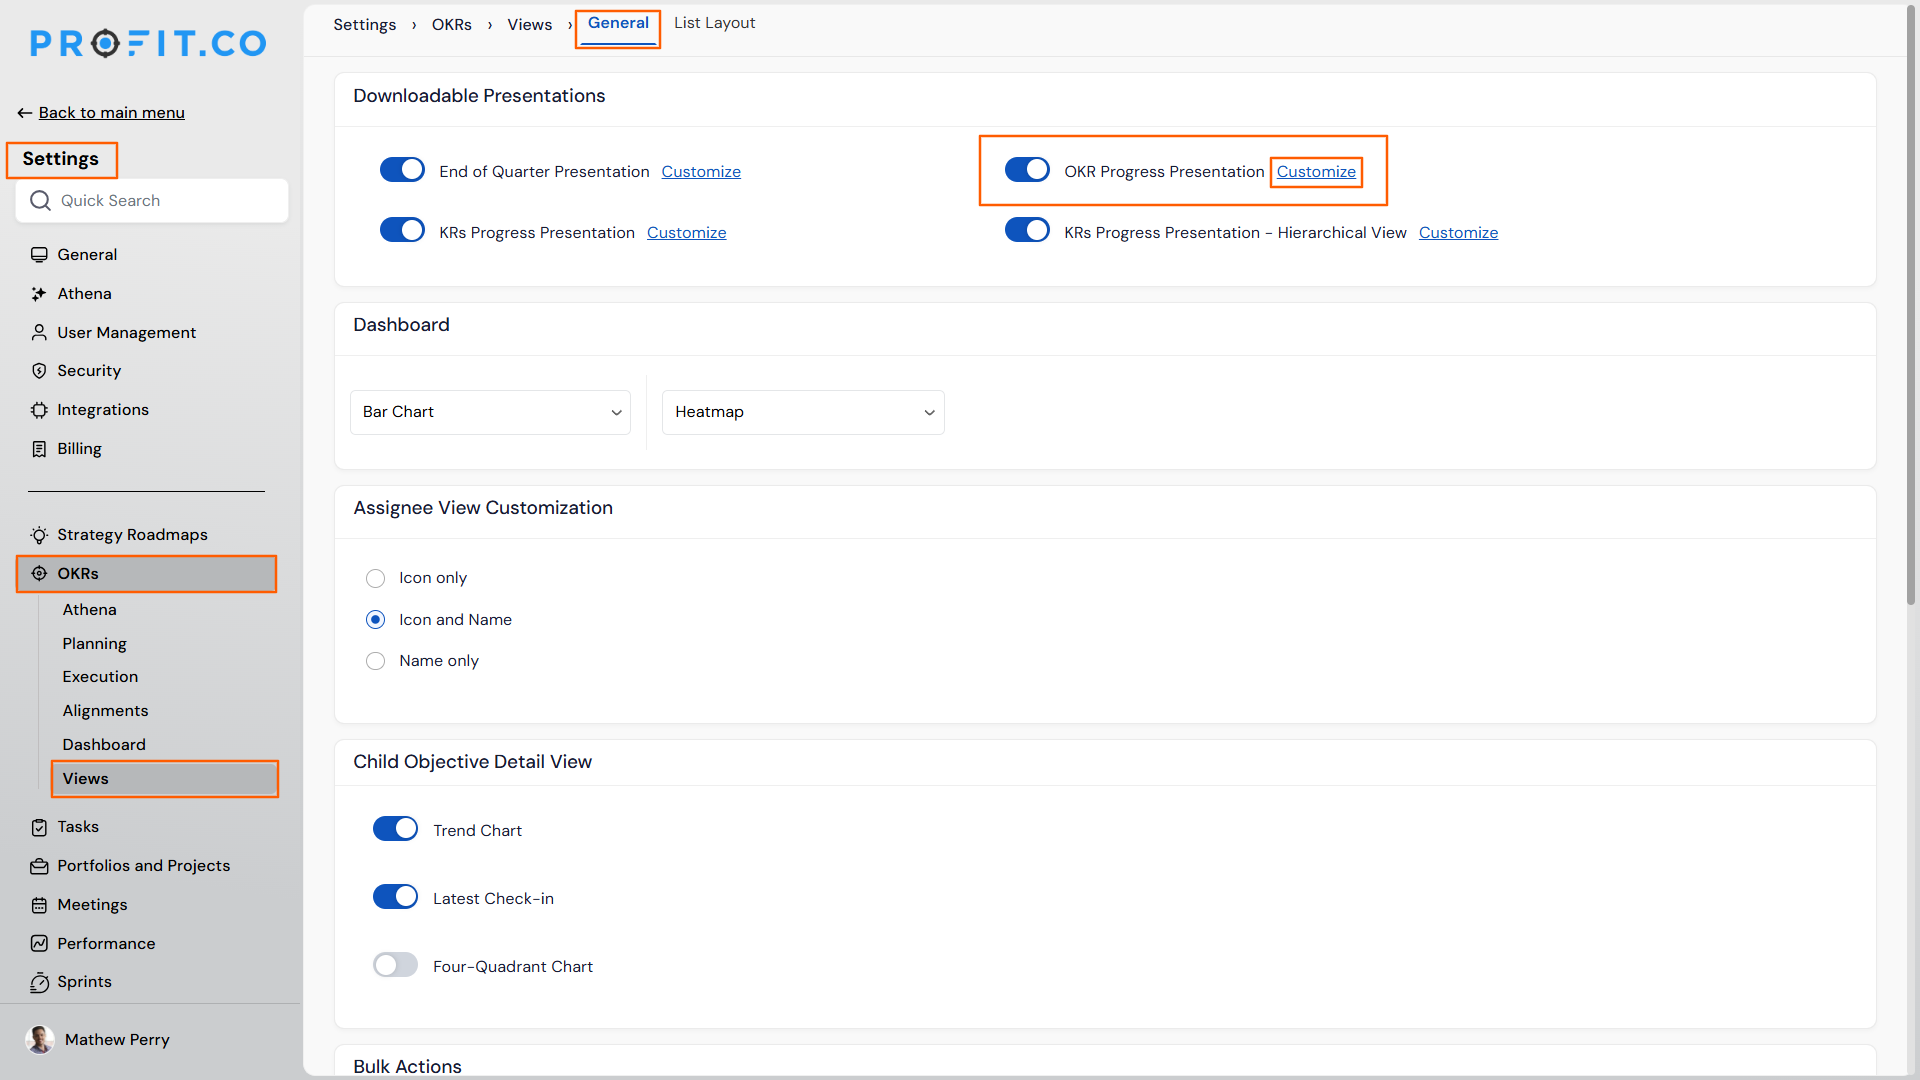
- Navigate to Settings → OKRs → Views → Customize: OKR Progress Presentation.
- In the Slide Properties panel, enable the Logo option , the preview updates to show the company logo on the slide.
- Set the brand background and font colours as required and click Save , the branding configuration is saved and applies to all future exports.
- Export the presentation as usual from OKRs → OKR Progress Presentation → Download as PowerPoint.
- The exported deck includes the company logo on every slide with brand colours applied , ready to present without any additional formatting.
Why It Matters
- On- brand exports out of the box: Every exported PowerPoint deck carries the company logo and brand colours automatically, eliminating the need to manually brand slides after export.
- Configure once, use every cycle: Branding is saved to the view , administrators set it up once and all subsequent exports inherit it without any repeat configuration.
- Consistent across the team: Any user who exports the presentation gets the same branded output, ensuring consistency across reporting cycles and presenters.
12. User Groups for Ownership Across OKRs, Tasks, and PPM
Overview
Administrators can now create named groups in User Management and assign them as owners across OKRs, Tasks, and PPM. A group can be set as Private, Public, or restricted to an access list, and can be created at both the settings level and the preferences level. When a group is assigned as an owner, the group name appears in the owner field – hovering over it reveals the individual members within it.
How It Works
To create a group (Administrators)
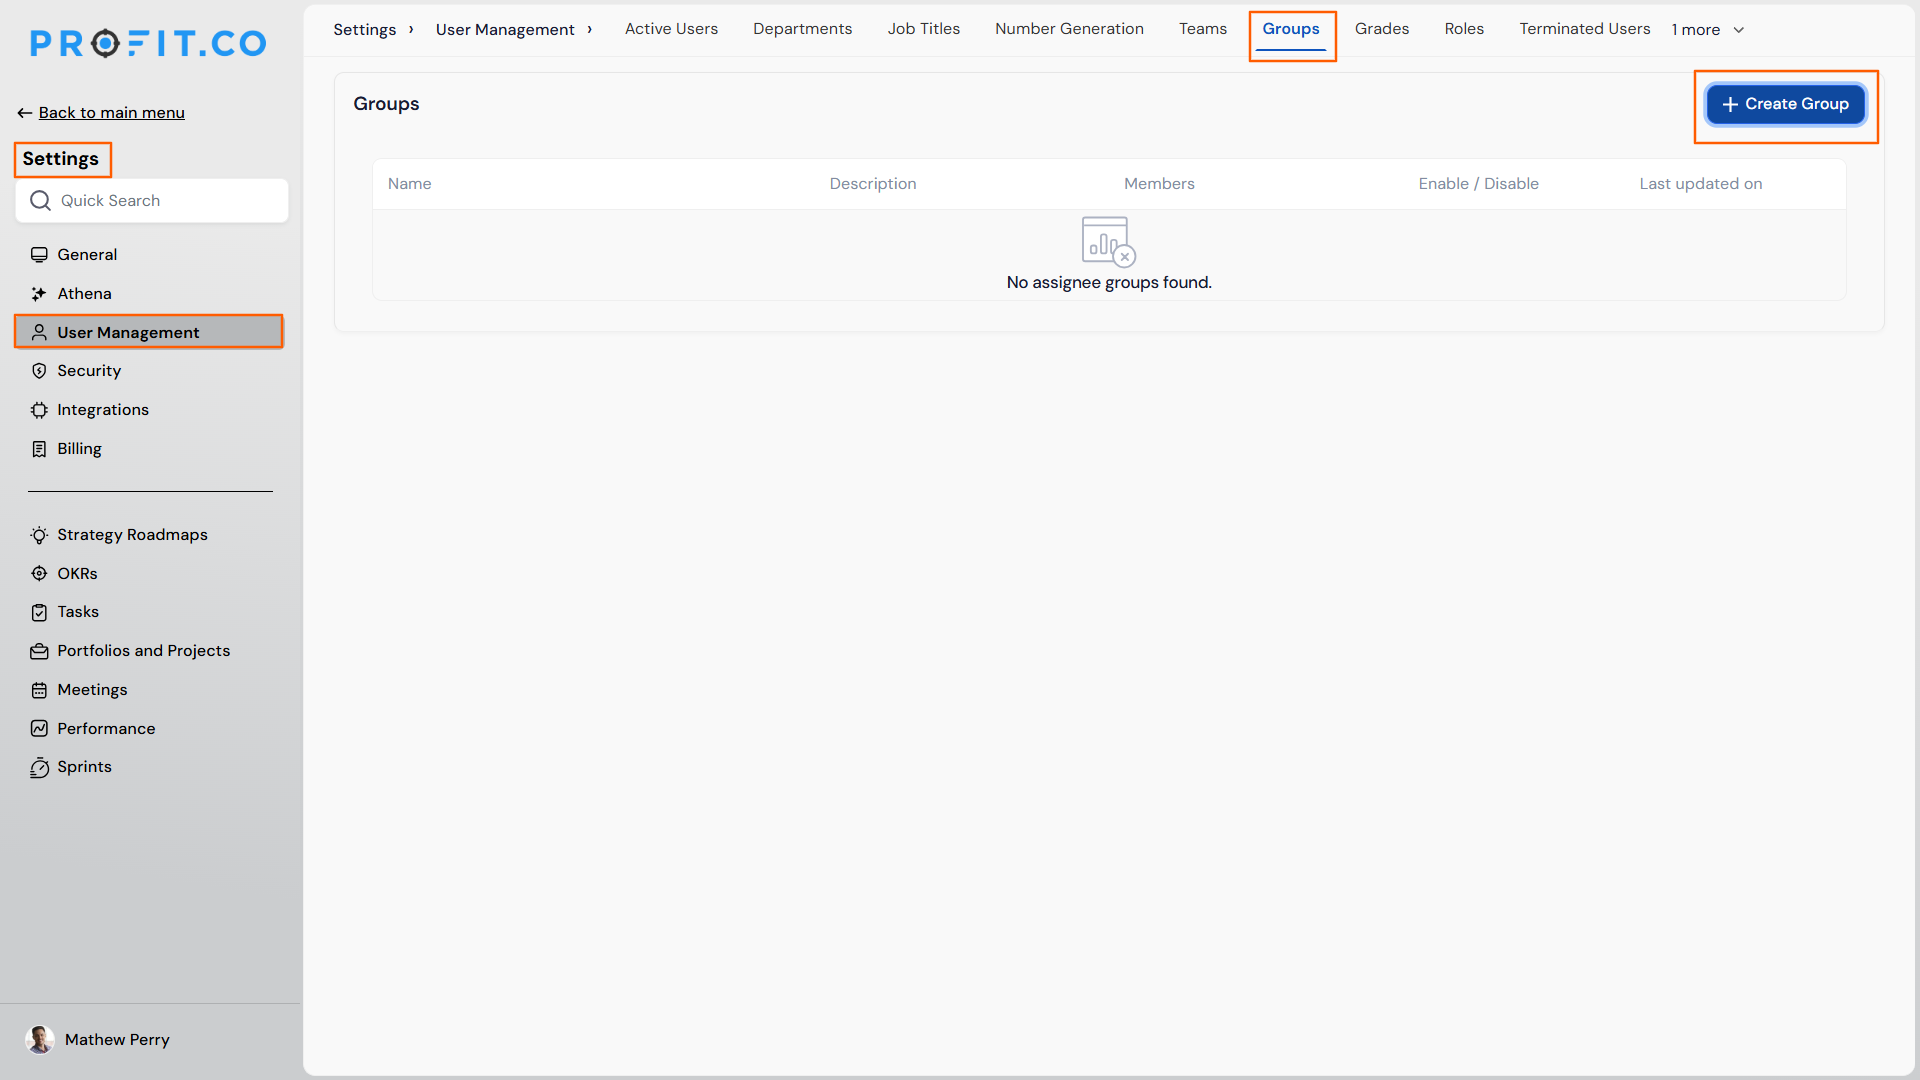
- Navigate to Settings → User Management → Groups.
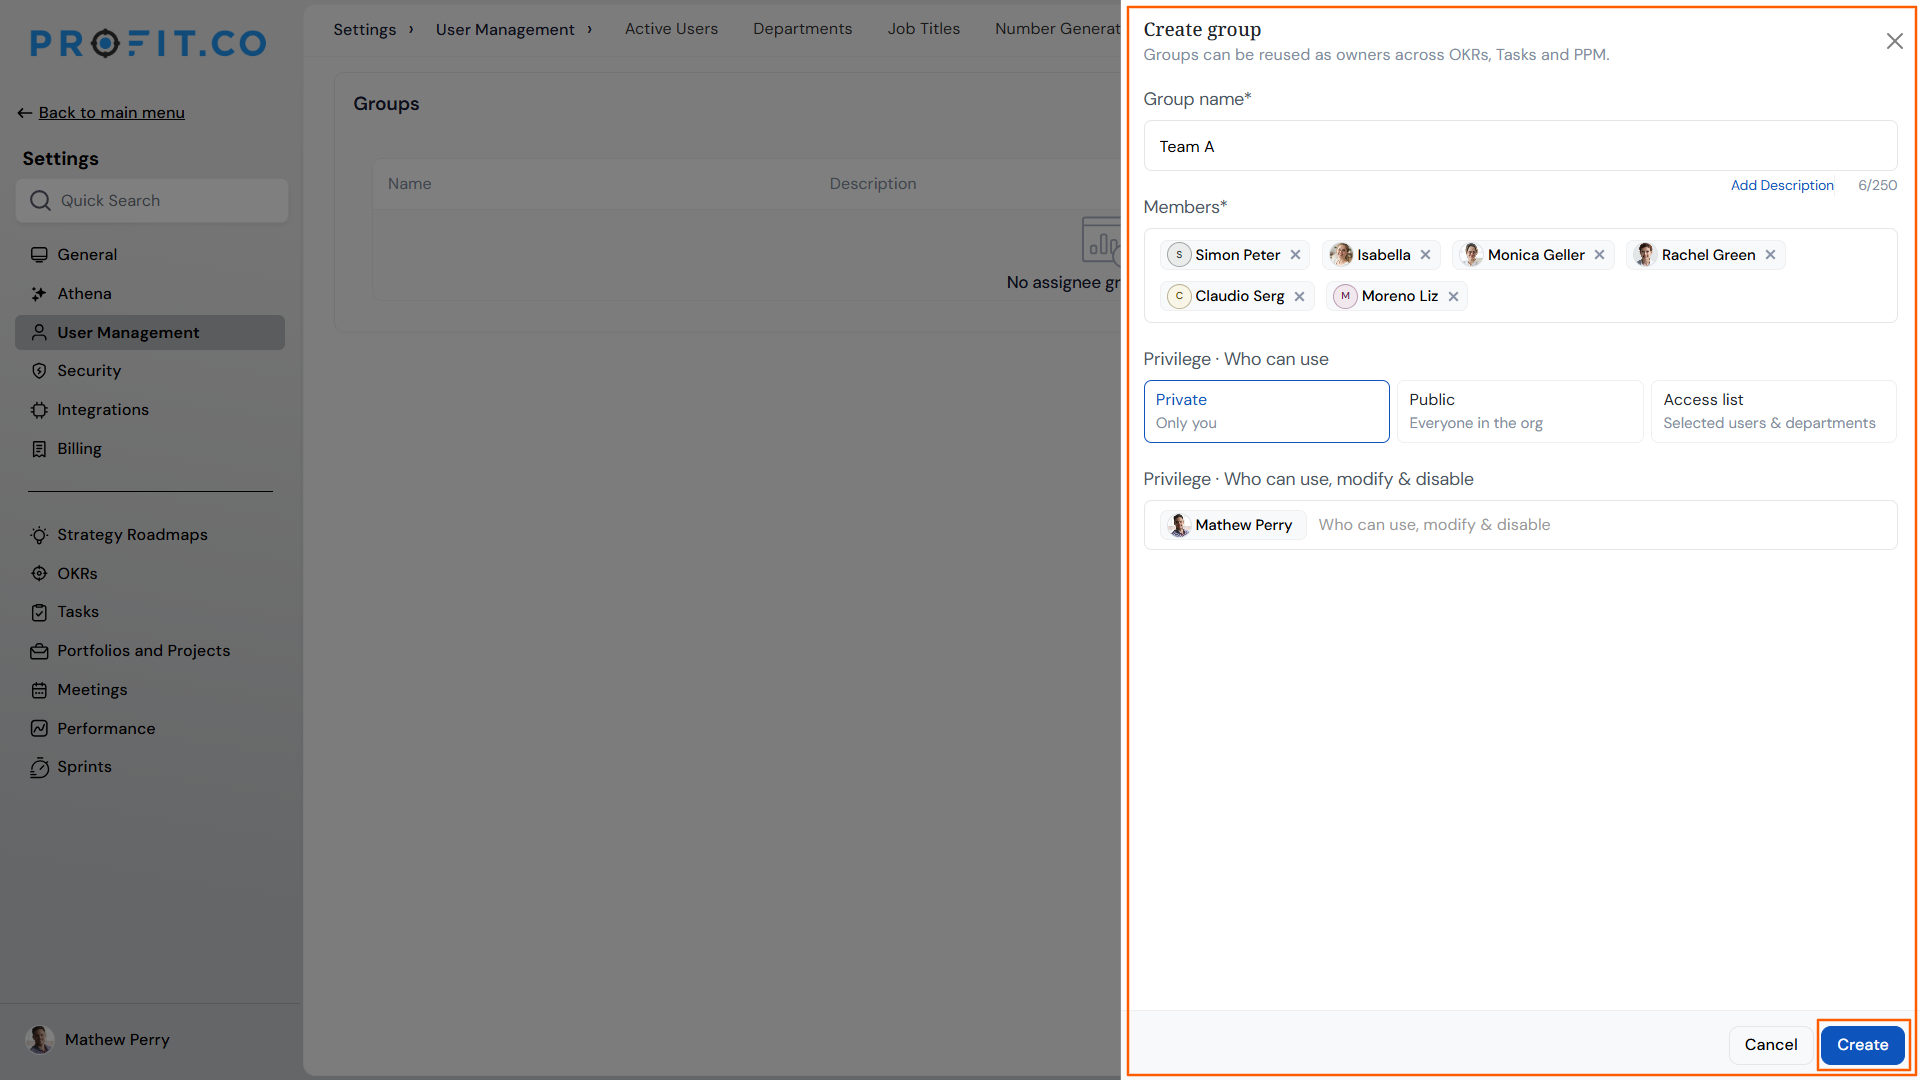
- Click Create Group and enter a group name – duplicate names are not allowed.
- Add members to the group.
- Set the privilege level:
- Private – only you can use the group.
- Public – everyone in the organisation can use the group.
- Access list – selected users and departments only.
- Define who can use, modify, and disable the group, then click Create.
To create a group (End users)
- Navigate to Preferences → Groups.
- Click Create Group and follow the same steps as above to set the group name, members, and privilege level.
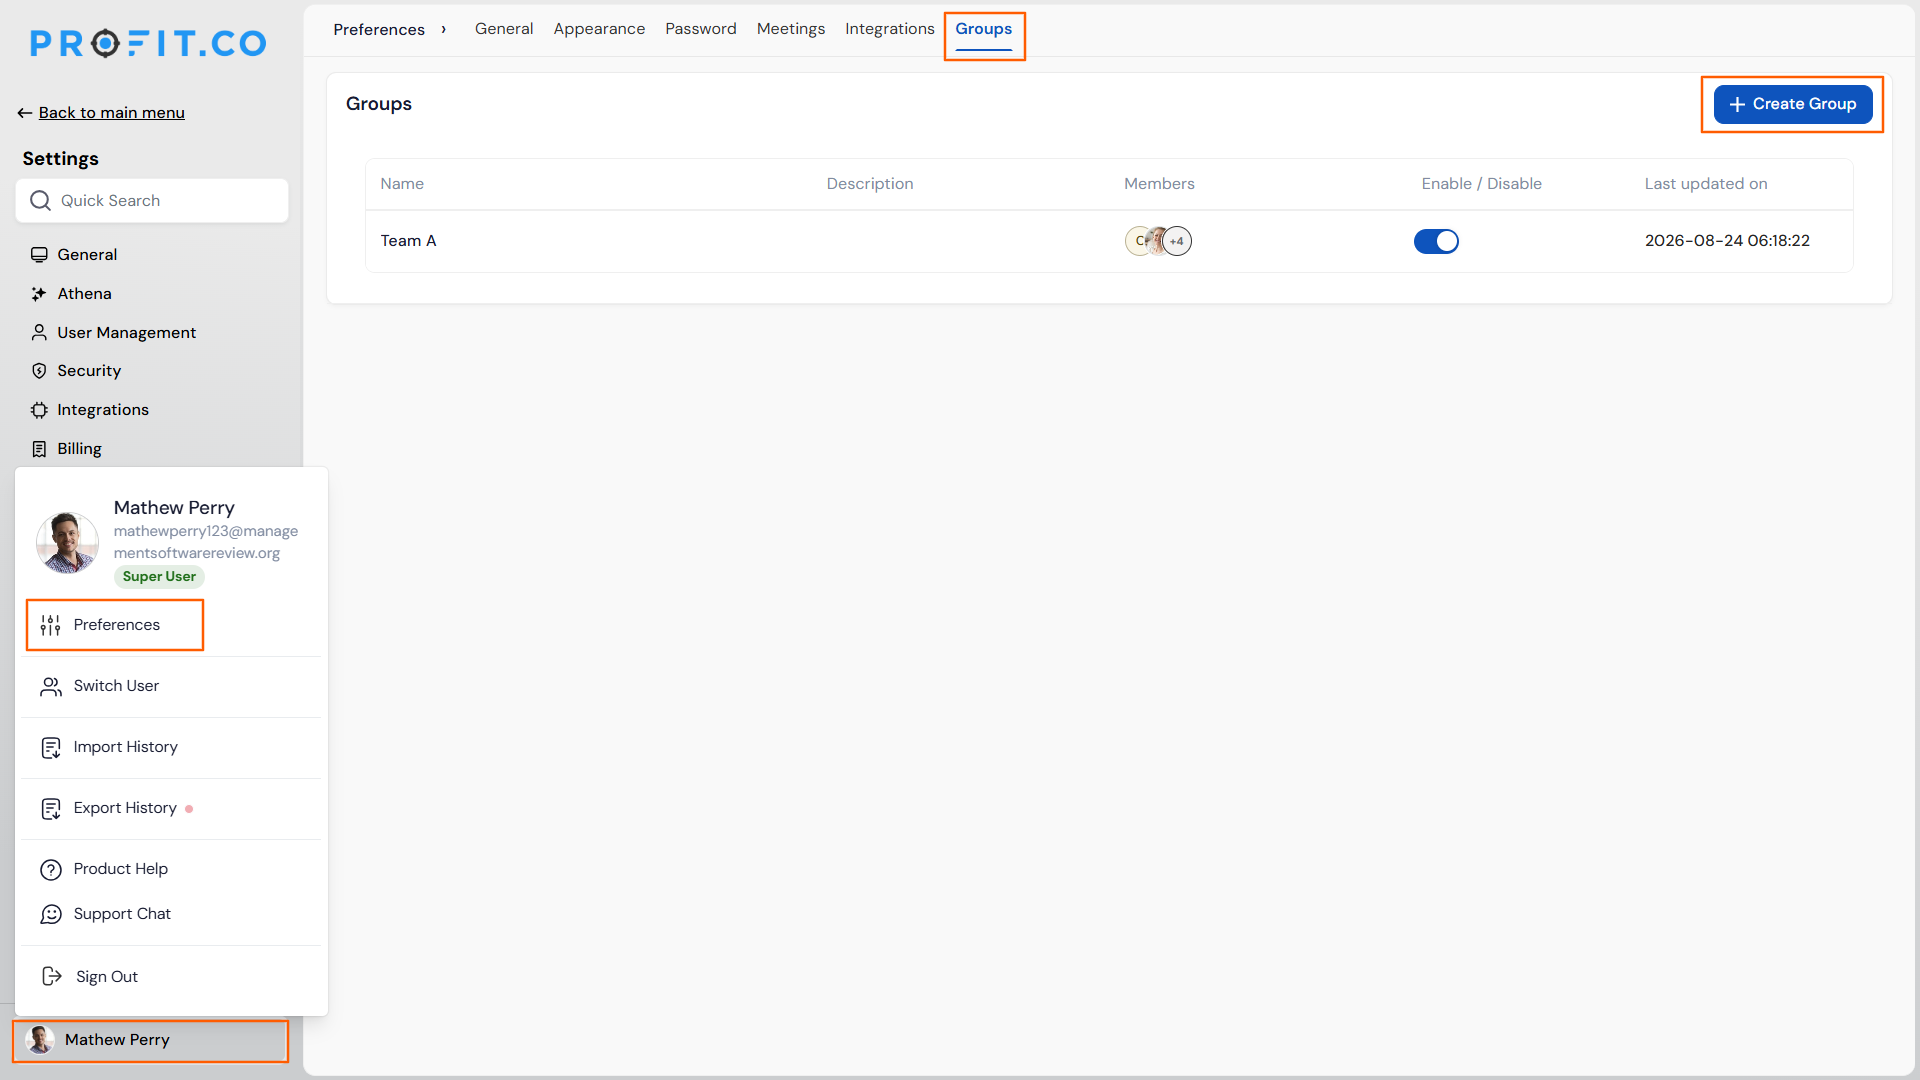
Using groups as owners:
- When assigning an owner on any OKR, Task, or PPM item, the owner dropdown shows both individual users and available groups.
- Selecting a group displays the group name in the owner field – hovering over it shows the list of members within the group.
- If an individual member is removed from the owner field while a group is assigned, the group is unselected and all remaining members are assigned as direct assignees with a confirmation prompt.
- If all individual members of a group are manually selected and saved, a prompt suggests assigning the group instead.
- When a group is modified, an impact summary is shown listing all records that will be affected by the change.
- If a newly added group member does not have access to the module where the group is used, the system alerts the administrator and prevents the change.
- Groups can be disabled – when disabled, the group is removed and members are assigned individually to all affected records.
Why It Matters
- Simplified ownership assignment: A single group can represent an entire team across OKRs, Tasks, and PPM – no need to assign multiple individuals separately on each item.
- Controlled access: Privilege settings ensure groups are visible and usable only by the right people, whether private, organisation- wide, or restricted to a specific access list.
- Impact- aware modifications: Any change to a group – members added, removed, or the group disabled – shows a clear summary of affected records before the change is applied.
Enhancements:
13. Velocity Row in KPI Quick View
Overview
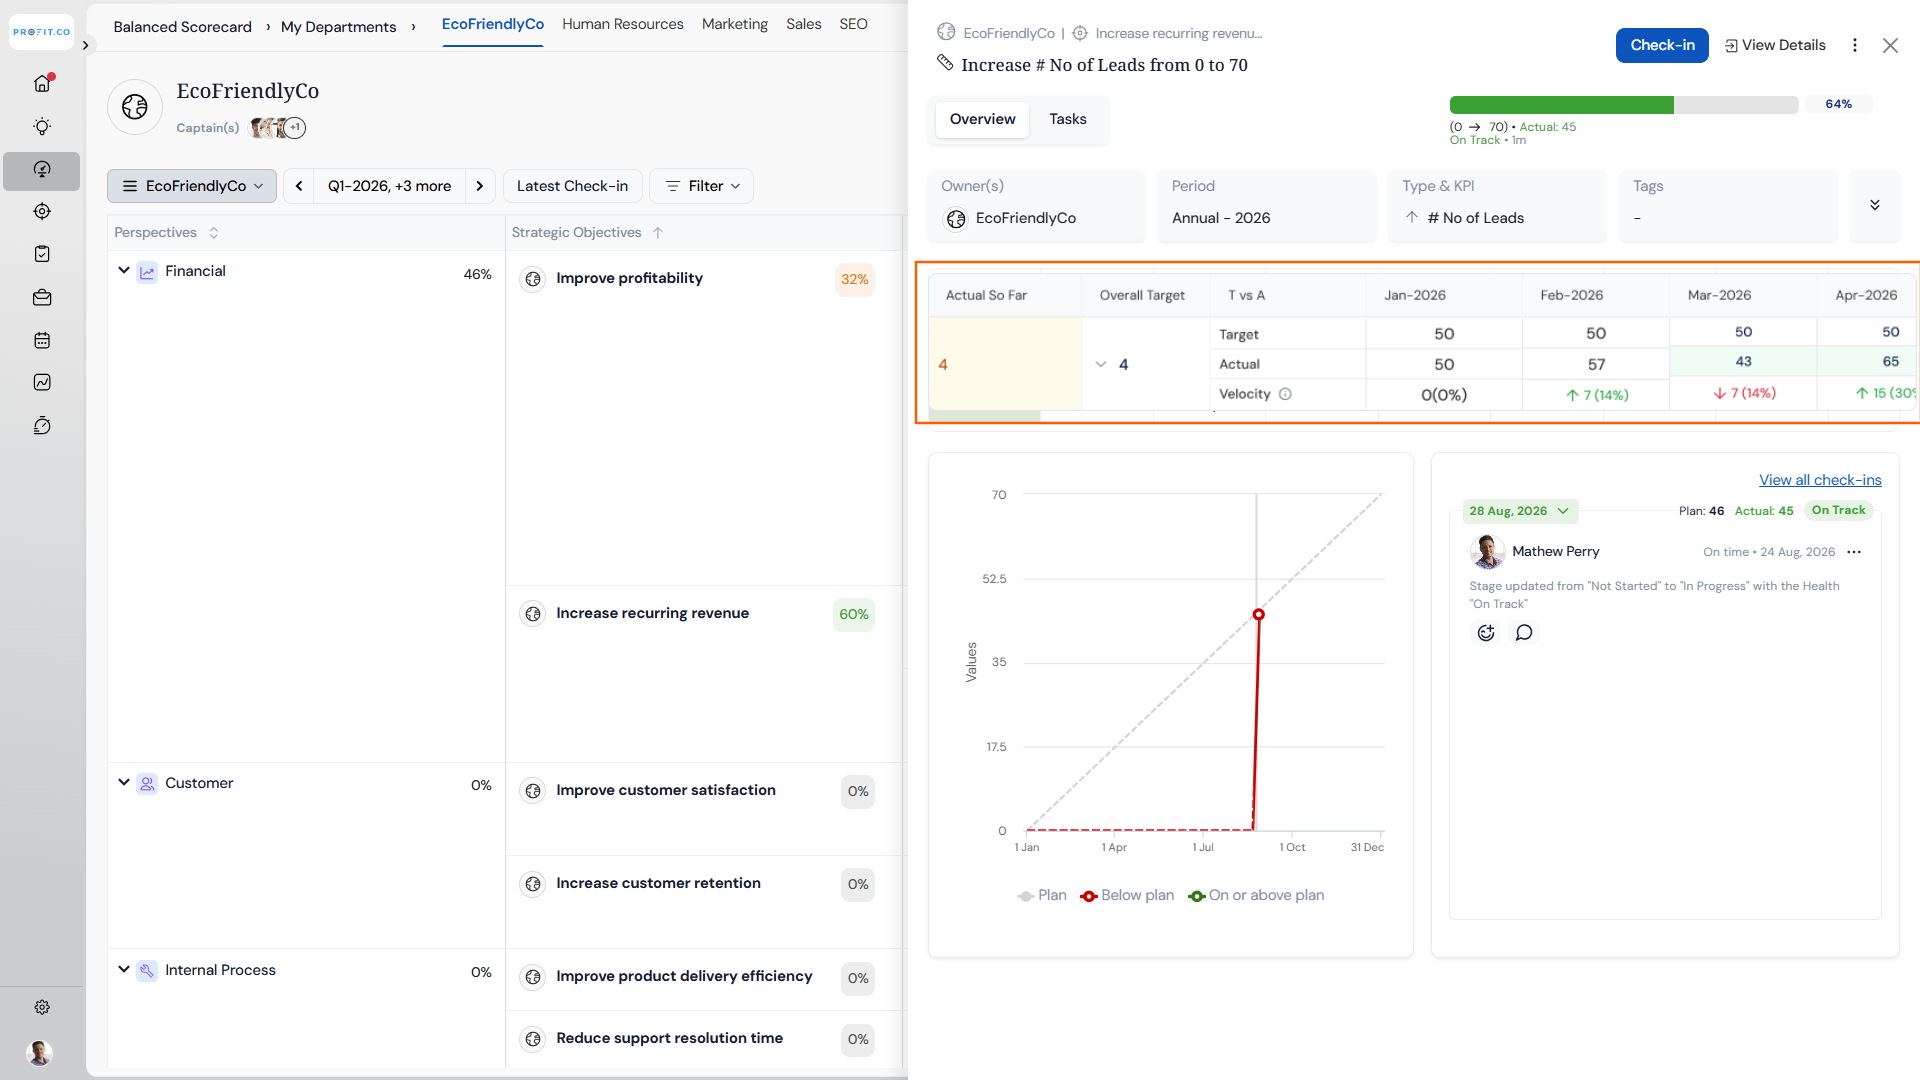
The KPI Quick View in the Balanced Scorecard now includes a Velocity row beneath the Actual row, showing the direction- aware gap between Actual and Target for each check-in period. For each period where data exists, the row displays the signed difference and its percentage – with a green upward arrow for a beat, a red downward arrow for a miss, and a neutral 0 for on- target results. The Velocity row also appears in the aggregate summary block and is included in PDF and Excel exports.
How It Works
- Open a scorecard and click any KPI to open the Quick View.
- The view displays the Target and Actual rows as before, with the new Velocity row appearing beneath Actual.
- For each period, the system calculates the gap between Actual and Target and displays it with a directional indicator:
- Beat: ↑ positive gap (green)
- Miss: ↓ negative gap (red)
- On target: 0 (0%) neutral
- No check-in or zero target: displays "–"
- The overall Velocity is shown in the aggregate block alongside the existing summary figures.
- The Velocity row is included automatically when exporting the scorecard to PDF or Excel – no additional steps required.
Why It Matters
- Instant gap visibility: Reviewers can read the variance between Actual and Target directly on screen, per period, without manual calculation or exporting to a spreadsheet.
- Direction- aware indicators: Colour- coded arrows make it immediately clear which periods are ahead of target and which are slipping, enabling faster prioritisation during reviews.
- Consistent across exports: The same Velocity figures available on screen carry through to PDF and Excel exports, ensuring review packs and board materials reflect the same data without extra effort.
14. Sorting and Reordering in the Balanced Scorecard
Overview
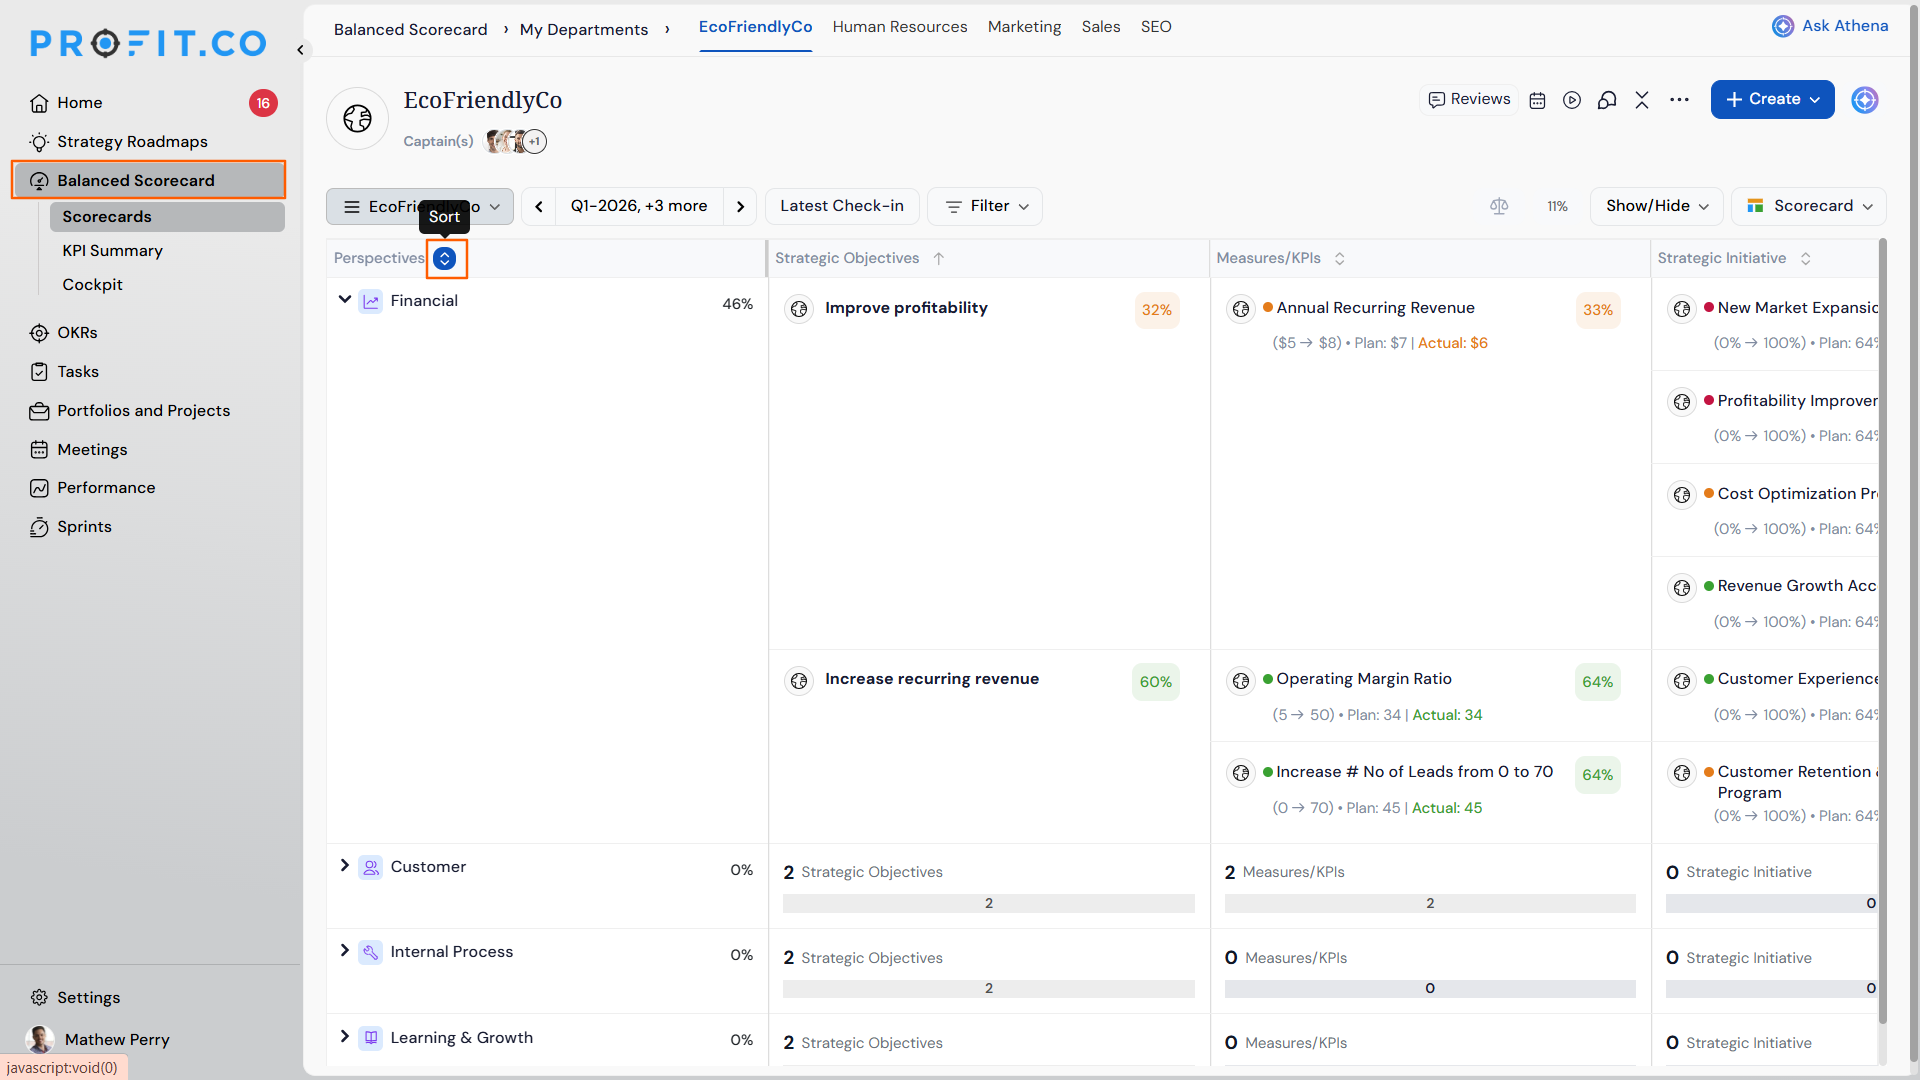
Users can now sort and reorder items on a Balanced Scorecard at every level , perspectives, objectives, measures, and initiatives. Items can be sorted alphabetically using the sort control in the column heading, or dragged manually into any preferred order. Each user's arrangement is saved privately and is reflected in Present View, exports, and generated PowerPoint files.
How It Works
- Open a Balanced Scorecard and select the required period.
- To sort alphabetically, click the sort control in the column heading , first click sorts A to Z, second click Z to A, third click clears the sort.
- To reorder manually, hover over any row to reveal the drag handle and drag the item to the preferred position within the same group.
- Each level is controlled independently , sorting one level does not affect the others.
- The arrangement is saved automatically and carries through to Present View, scorecard exports, and generated PowerPoint files.
Why It Matters
- Present in a meaningful order: Leaders can arrange scorecard items by priority and present directly from the live scorecard , no need to rebuild it in a spreadsheet or slide deck.
- Faster navigation: Alphabetical sorting makes it easy to locate any measure or initiative instantly during a review.
- Private to each user: Arrangements are saved per user and per period , no one else's view is affected.
15. PDF Export for the Check-In Discipline Widget
Overview
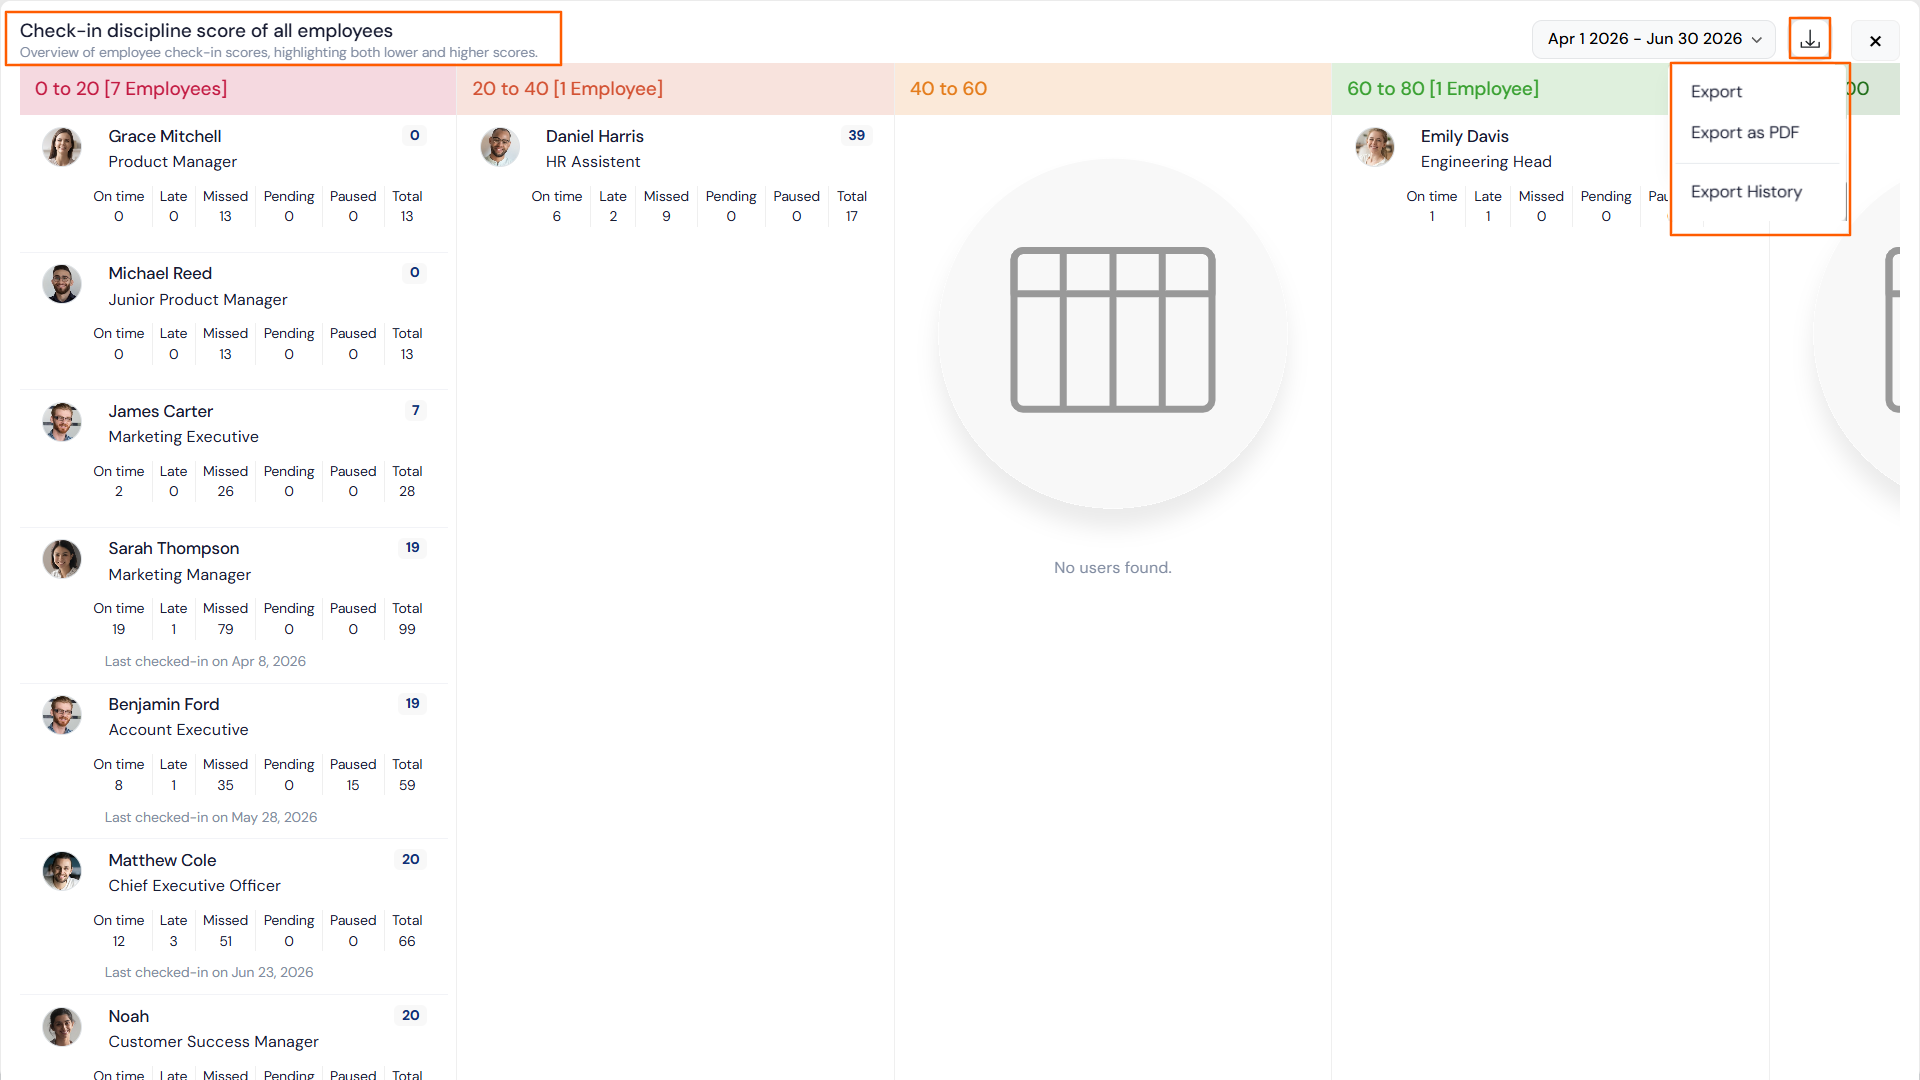
The Check-in Discipline for All Employees widget in the Cockpit now supports PDF export in addition to the existing CSV option. Users can export a presentation- ready snapshot of the widget directly, without needing to reformat data manually for leadership decks or reports.
How It Works
- Navigate to Cockpit and open the Check-in Discipline for All Employees widget.
- Apply any required filters or date range.
- Click the export icon and select PDF.
- The system queues the export and displays a processing confirmation.
- Open Export History to download the completed file once processing is done.
Why It Matters
- Presentation- ready exports: The PDF matches the on- screen layout and active filters exactly, making it ready to drop into leadership decks and reports without any reformatting.
- Flexible sharing: Teams can now choose between CSV for data analysis and PDF for a clean, shareable record.
16. Improvements for KPI Type and Progress Calculation
Overview
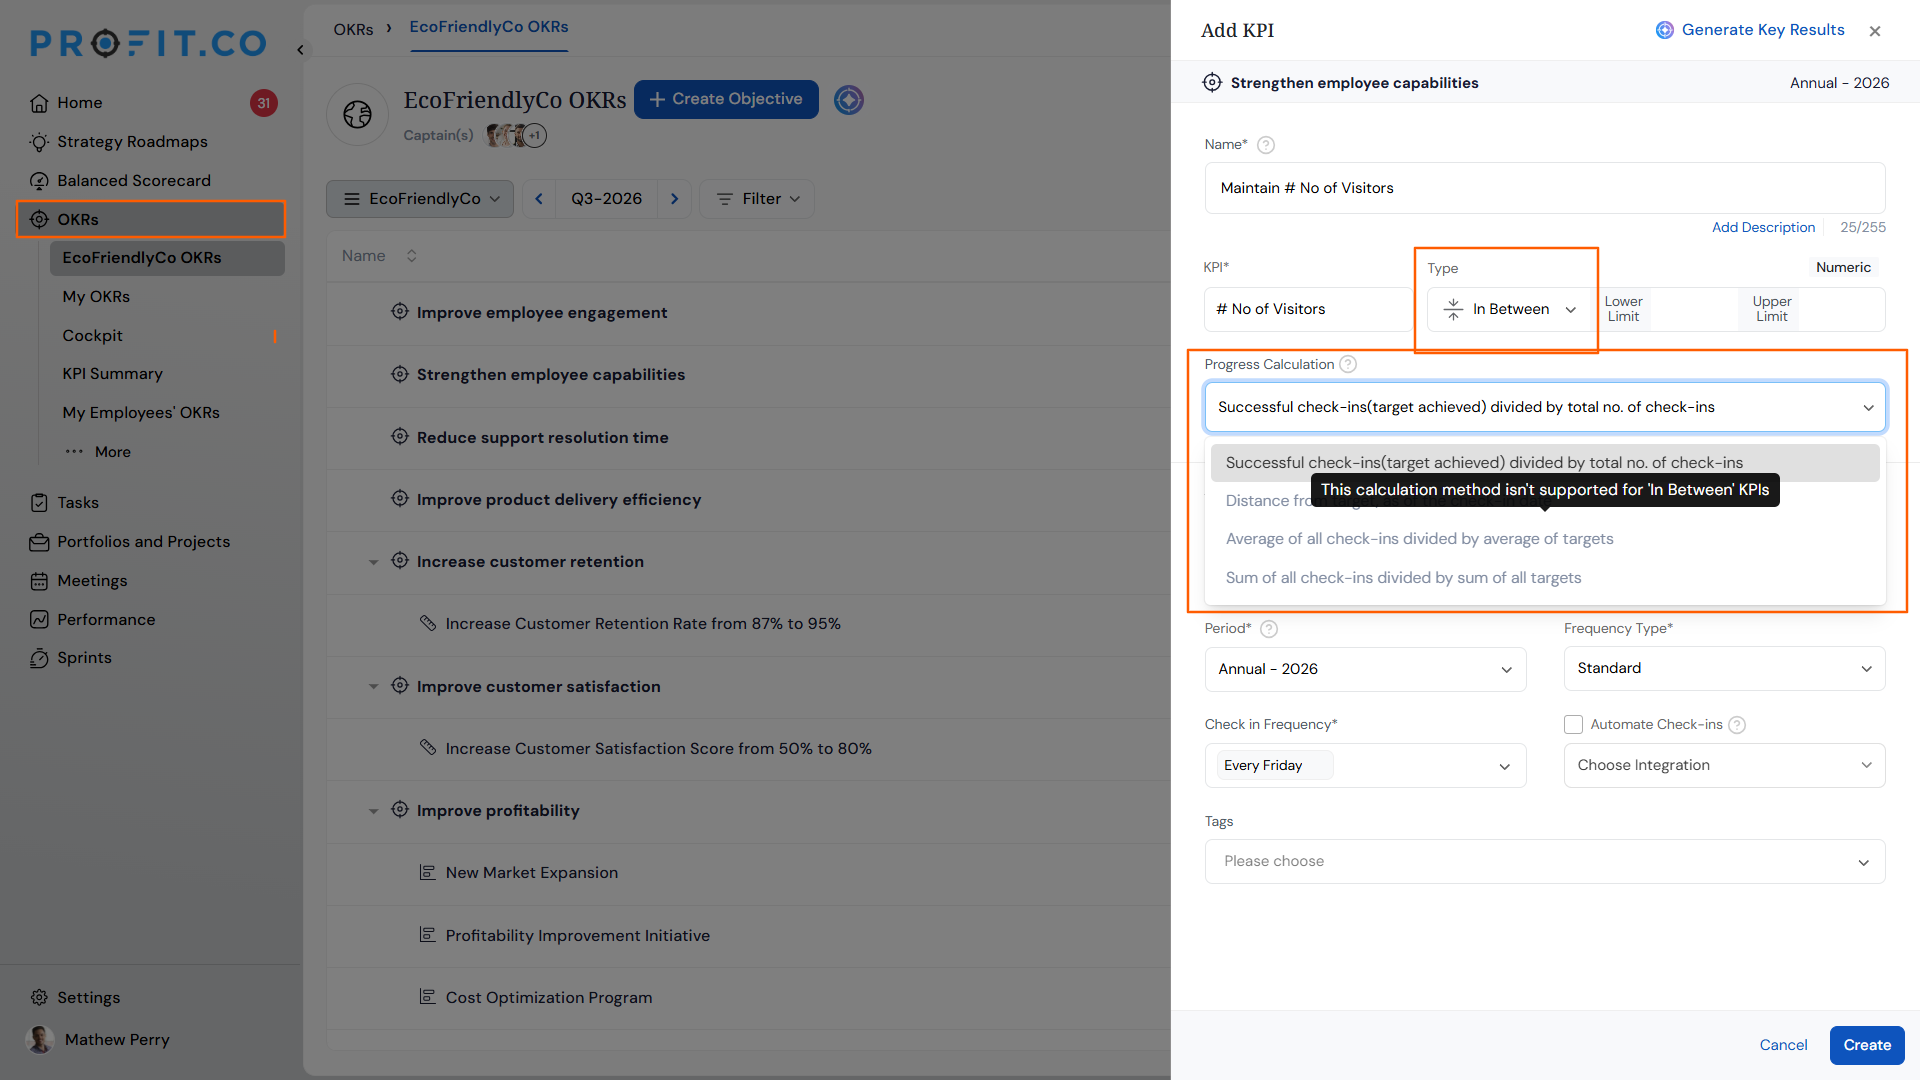
Profit.co now prevents configuration mismatches when setting up KPI- based key results. The Control KPI type has been removed from the KPI creation settings to eliminate an incompatible option at the source. Additionally, when the In Between KPI type is selected while creating a key result, only the compatible progress calculation method is available , unsupported methods are greyed out with a clear explanation. Together, these changes ensure users always work with a valid configuration without running into silent errors.
How It Works
In Settings:
- Navigate to Settings and open the KPI configuration.
- The Control KPI type is no longer available as an option when creating a KPI.
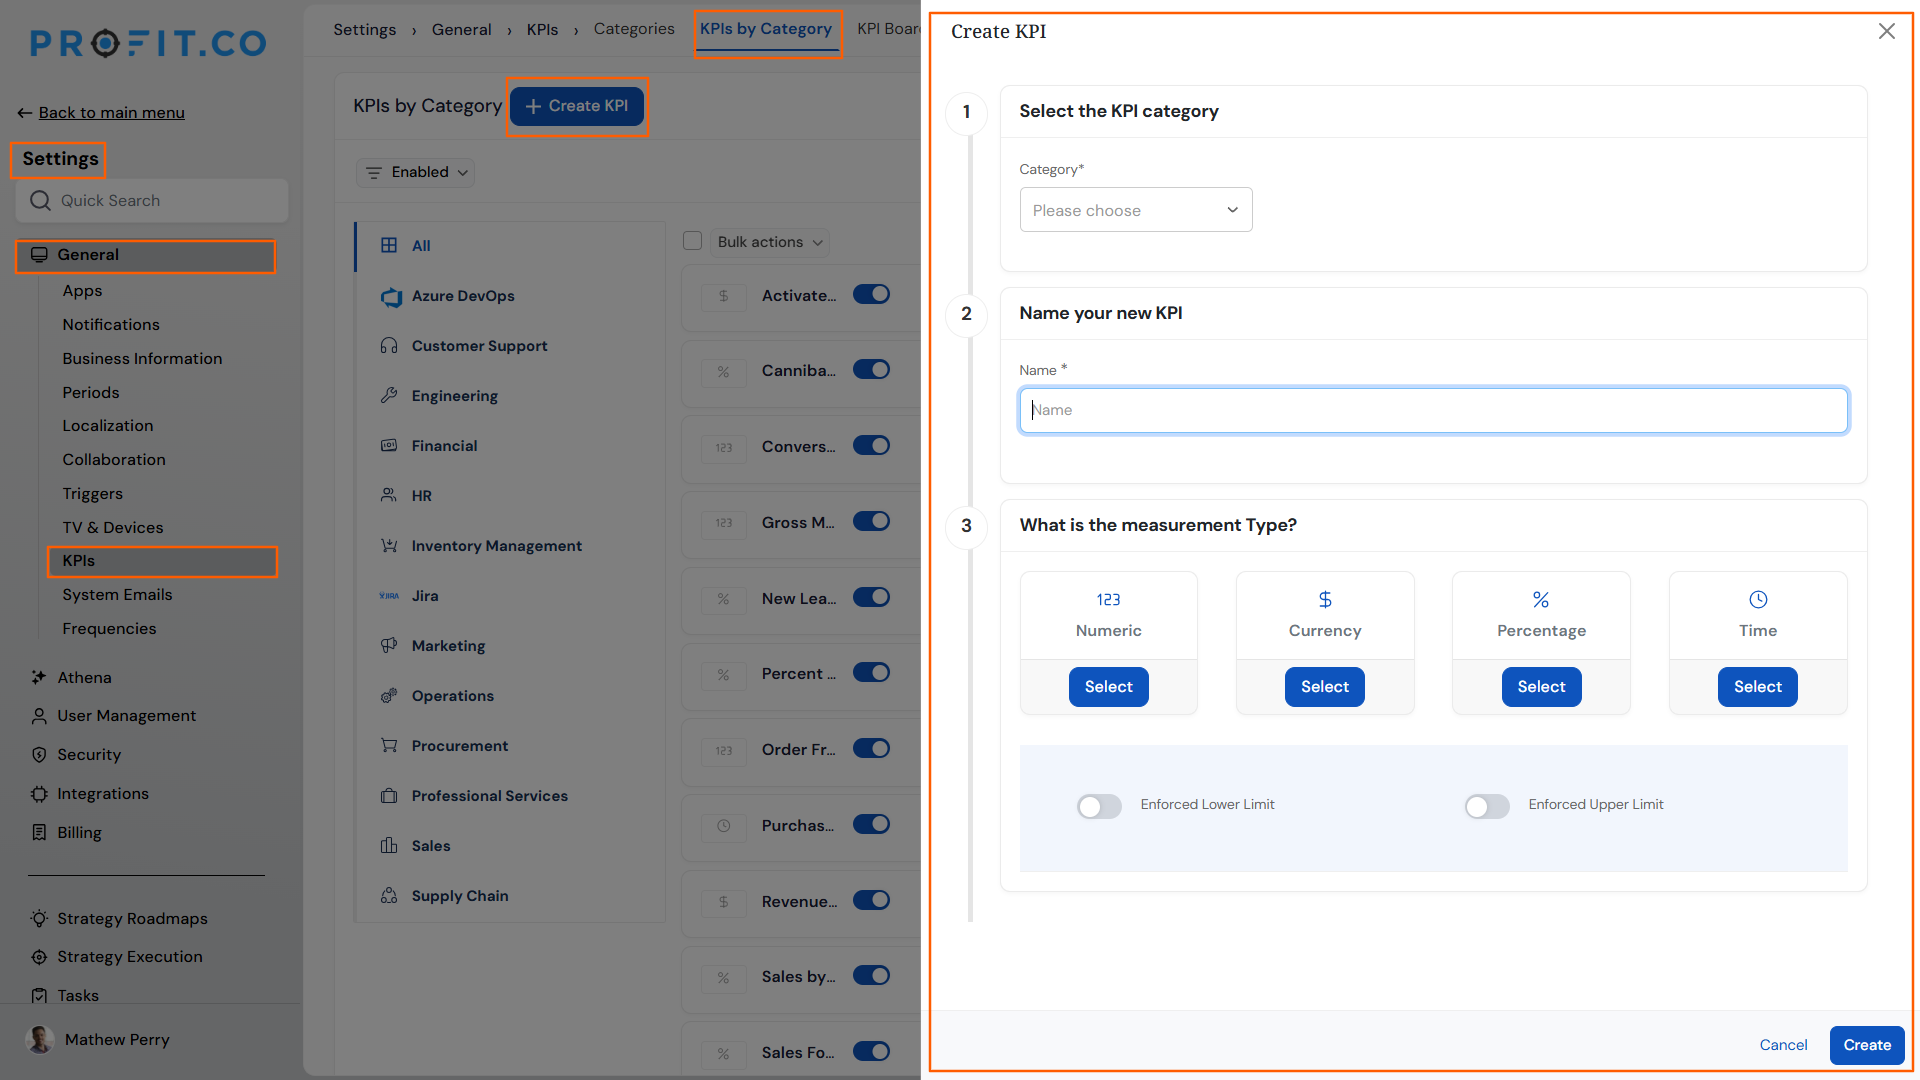
While creating a key result:
- Navigate to OKRs and open or create a key result.
- Under the KPI field, select a KPI and set the type to In Between.
- Open the Progress Calculation dropdown , only Successful check-ins (target achieved) divided by total no. of check-ins is selectable.
- The remaining calculation methods are greyed out , hovering over them displays the message: "This calculation method isn't supported for 'In Between' KPIs."
Why It Matters
- Incompatible options removed at the source: Removing the Control KPI type from Settings prevents invalid configurations from being created in the first place.
- No more blank KPI fields: Previously, selecting an incompatible calculation method caused the KPI to go blank silently , this is now prevented by disabling incompatible options upfront.
- Clear guidance at the point of configuration: The tooltip explains exactly why certain options are unavailable, so users understand the constraint without needing to raise a support request.
PROJECTS (Task Management, Portfolios And Projects, Timesheets, Notes And Meetings)
1. Mandatory Attachment Option for Tollgate Checklists
Overview
Super users can now mark individual checklist items in a tollgate as requiring a mandatory attachment, ensuring that project teams must upload supporting documents before they can complete that checklist item and submit for approval. When a checklist item is set as mandatory, project members see a clear prompt to add an attachment, and a tooltip reminds them that the item cannot be completed without one. This gives organisations greater control over documentation standards across project stages.
How It Works
- Navigate to Settings → Portfolios and Projects → Tollgates → open the relevant tollgate sequence
- Click on a tollgate stage to open its configuration panel
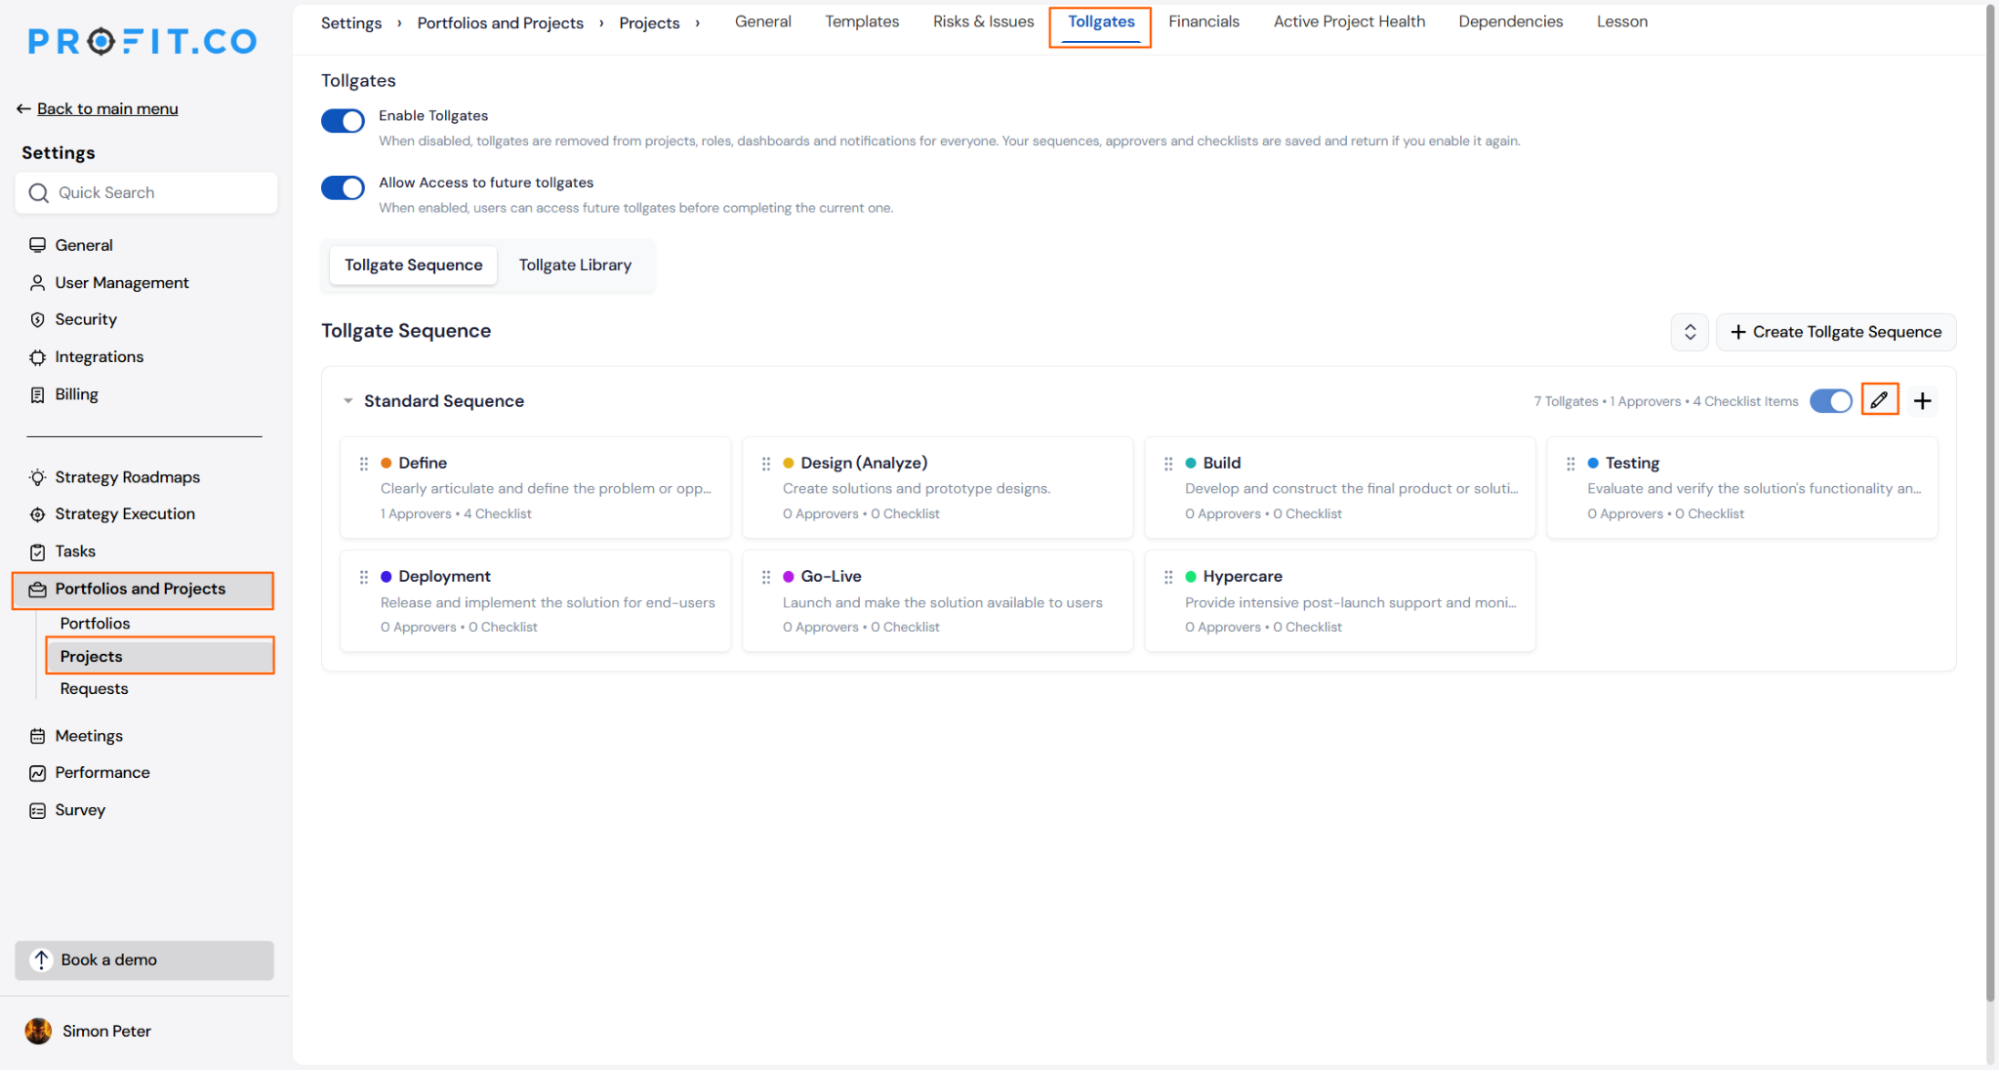
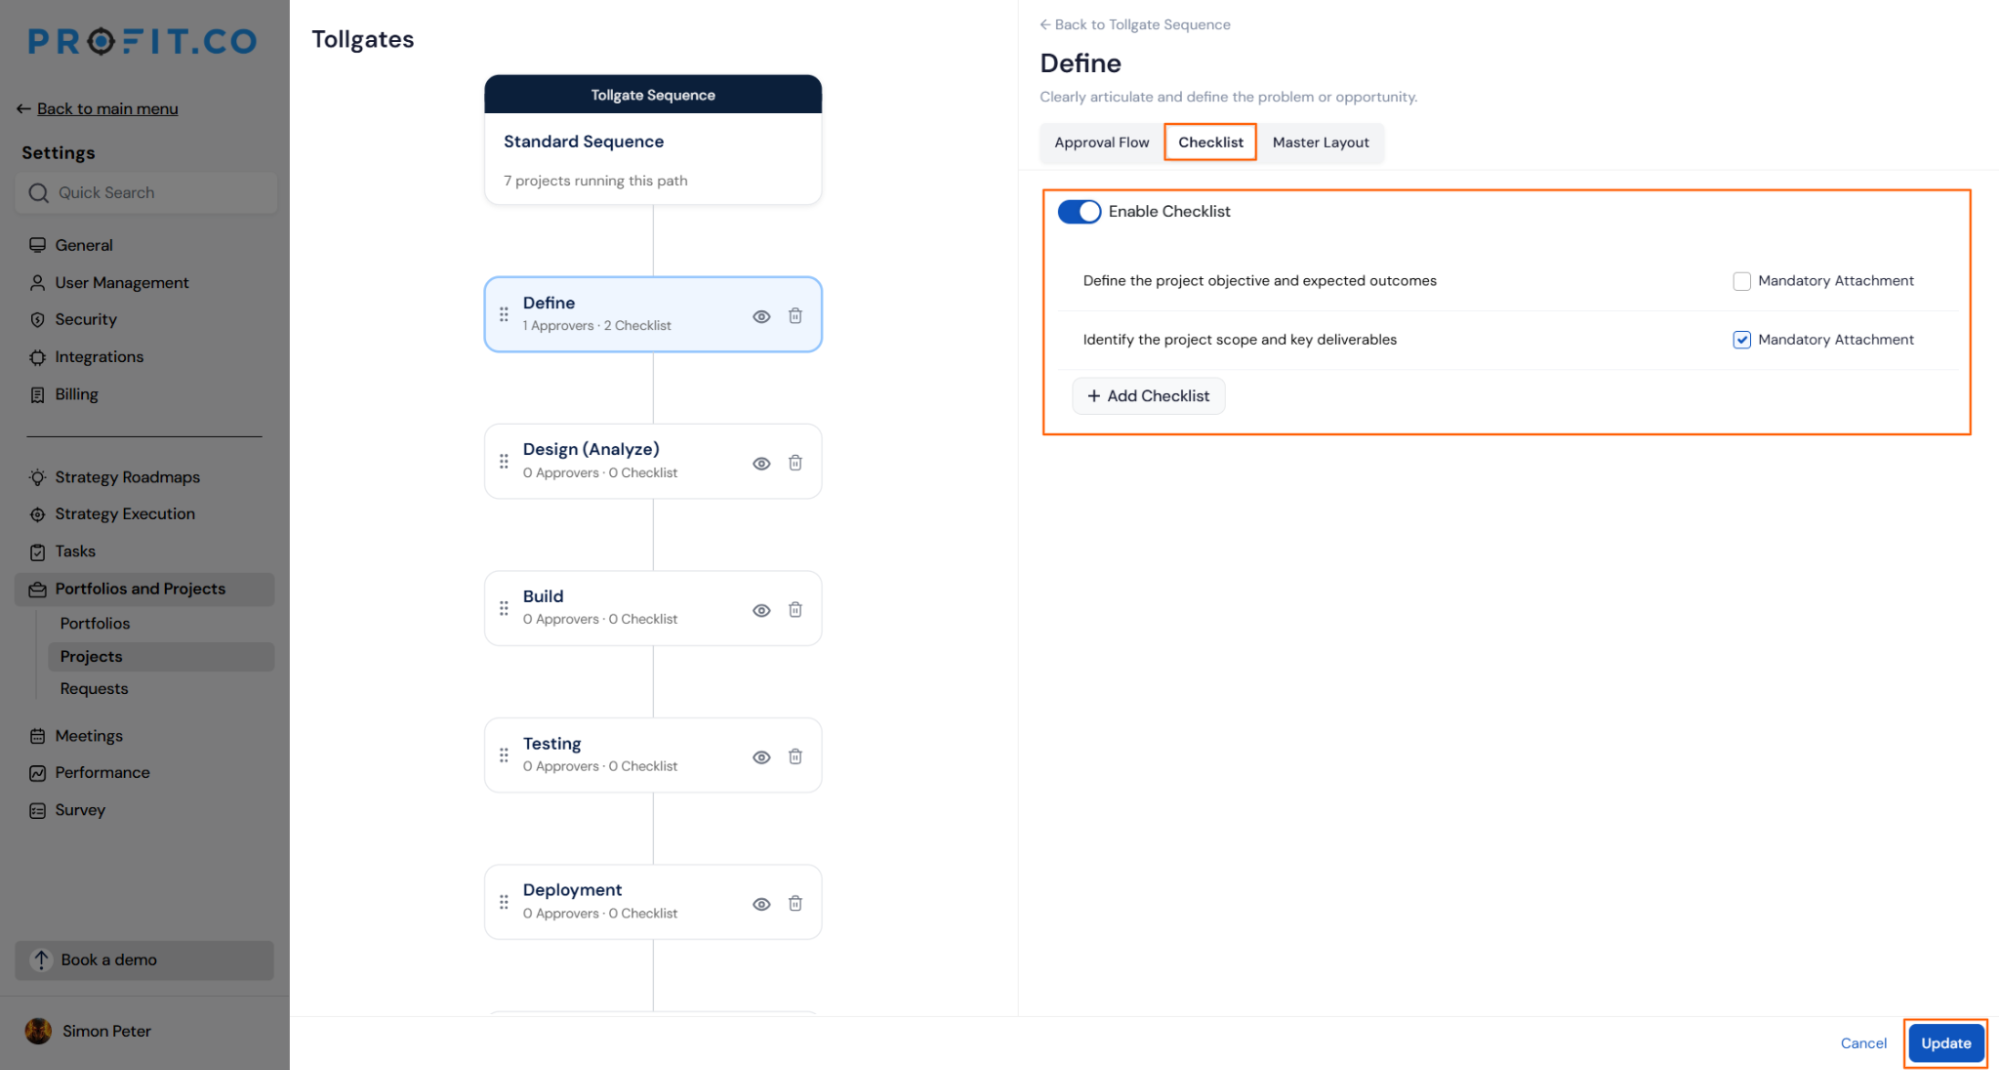
- Go to the Checklist tab and enable the Enable Checklist toggle if not already on
- For each checklist item, check the Mandatory Attachment box to require a file upload before that item can be marked complete
- Click Update to save the configuration
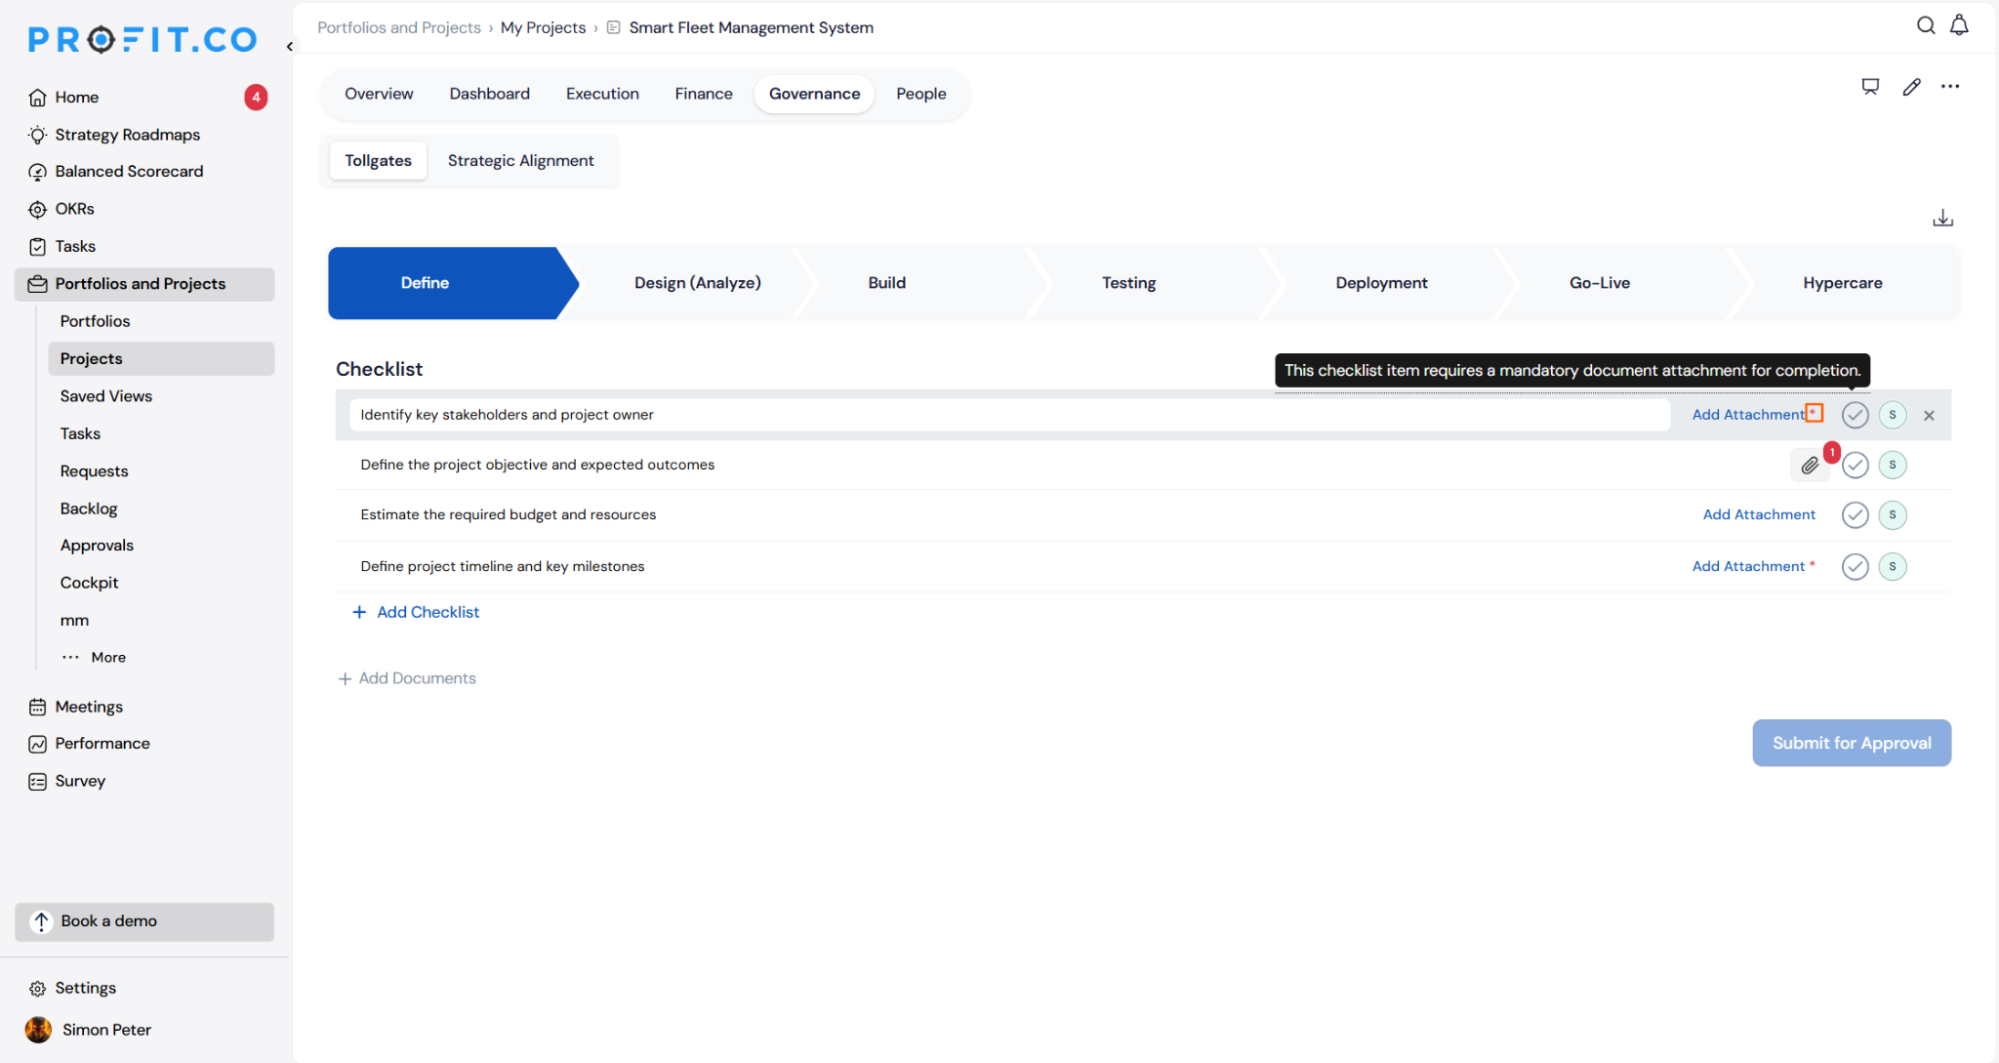
- When project members open that tollgate stage under Governance → Tollgates, checklist items with mandatory attachments show an Add Attachment prompt
- Hovering over the attachment icon displays a tooltip confirming that a document attachment is required for completion
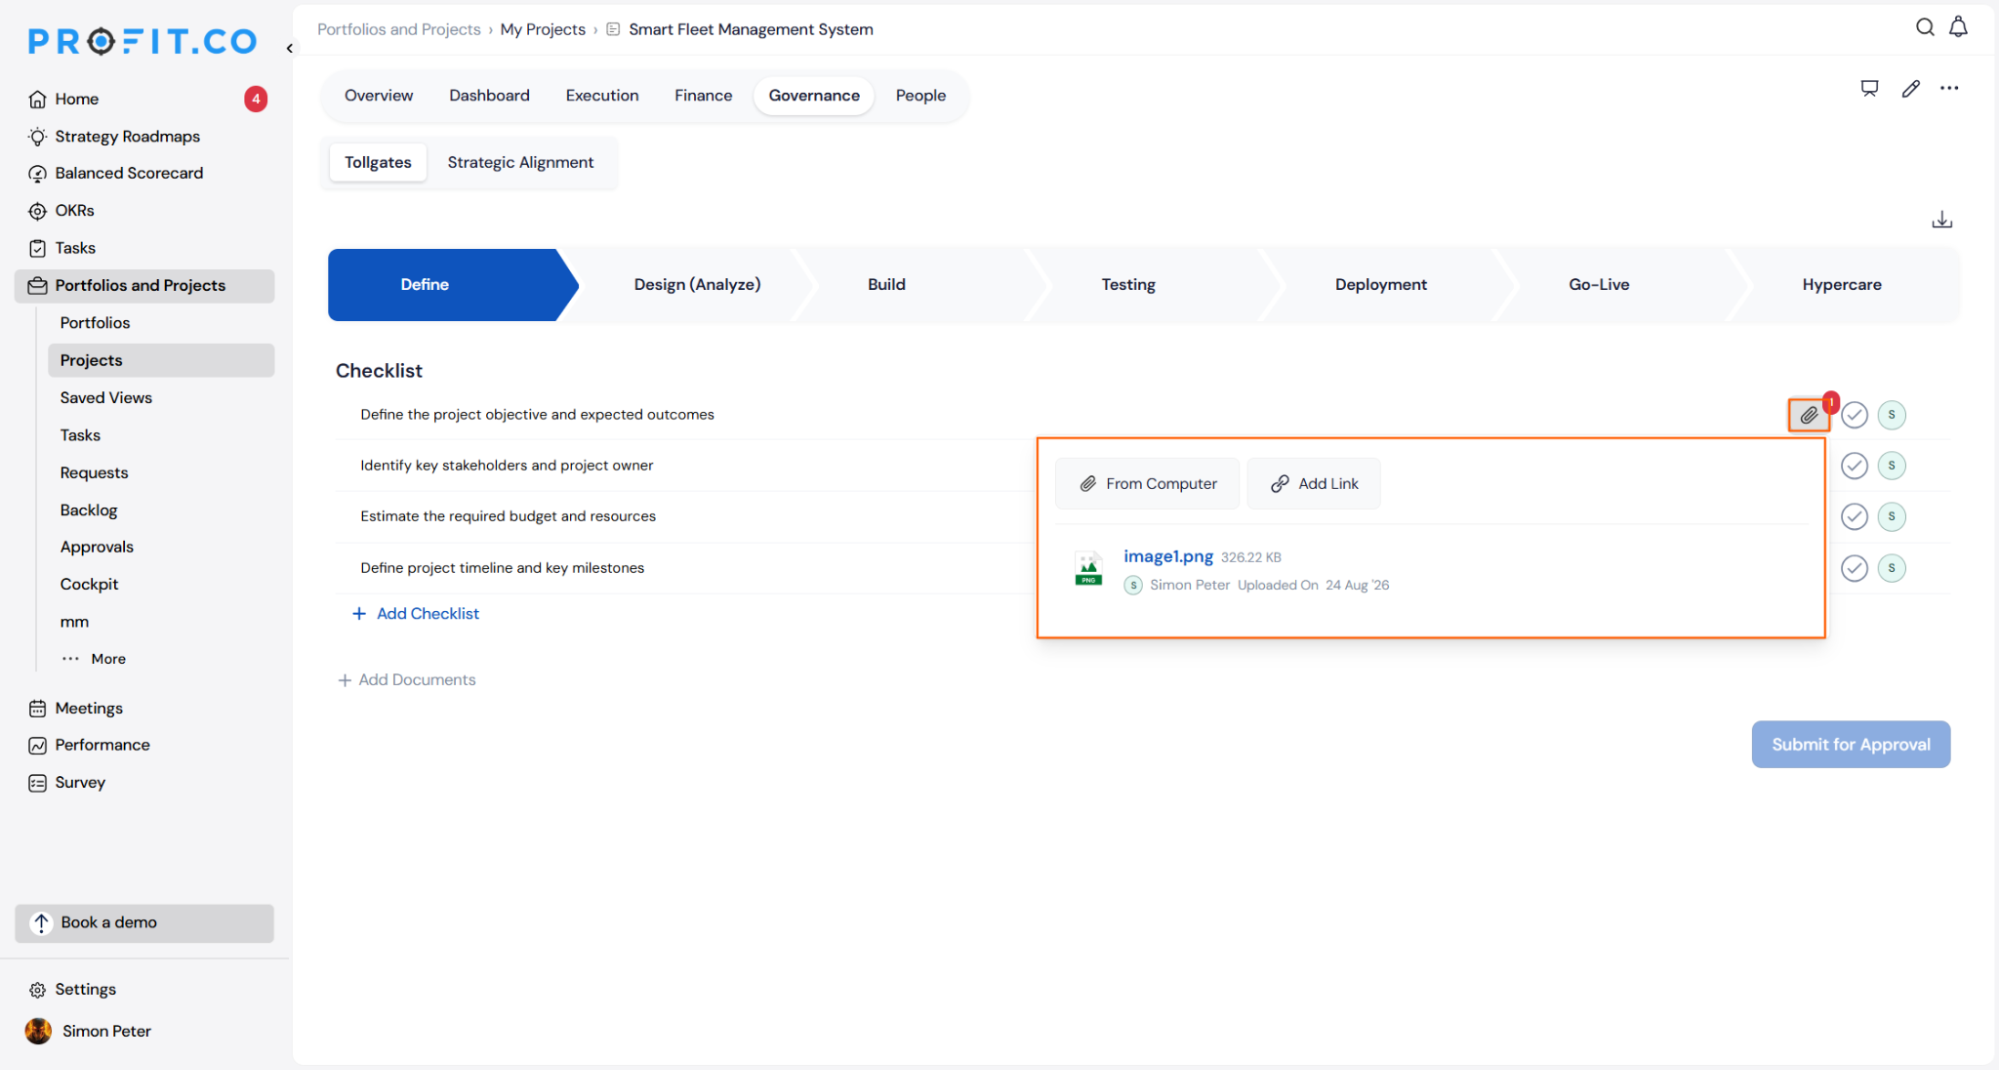
- Click the attachment icon on any checklist item to view all files that have been uploaded against it, including the file name, size, uploader name, and upload date
Why It Matters
- Enforced documentation standards: Project teams cannot mark a checklist item as done without attaching the required document, ensuring nothing is skipped before moving to the next stage.
- Stage- level control: Super users can set mandatory attachments on specific checklist items only, keeping flexibility for items where documentation is optional.
- Easy file review: Anyone with access to the tollgate can click the attachment icon to quickly view what has been uploaded against each checklist item, without navigating away from the stage.
2. KPI Creation at the Portfolio Level
Overview
Portfolio owners can now create, manage, and check in on KPIs directly at the portfolio level, bringing the same KPI capability already available in projects to portfolios. Each KPI tracks its own attainment based on a defined start value, target, and direction, giving portfolio owners a dedicated way to measure outcomes beyond just task and milestone completion. KPI attainment is independent and does not affect the portfolio's overall progress roll- up from projects.
How It Works
- Navigate to Portfolios and Projects → Portfolios → open the relevant portfolio
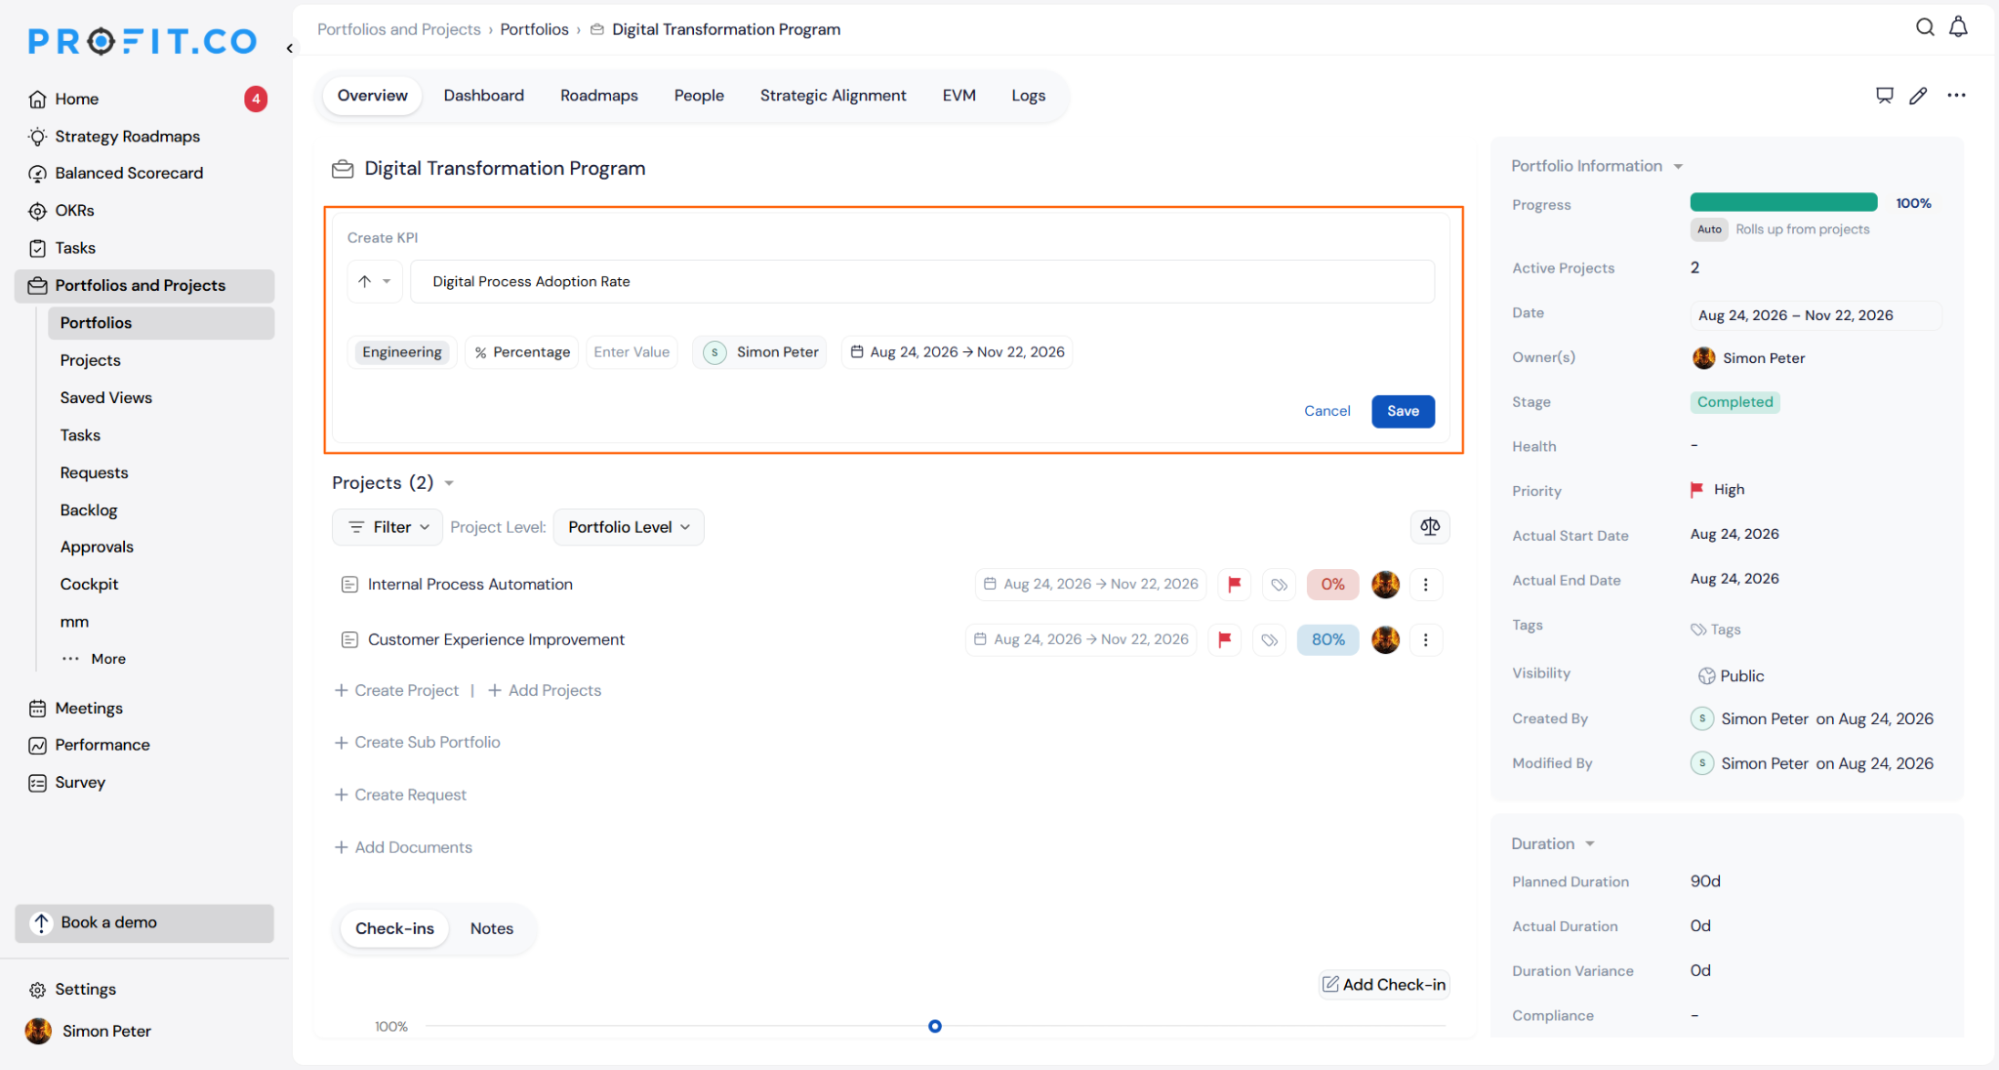
- On the portfolio Overview page, click Create KPI
- Set the KPI direction (Increase or Decrease), enter a name, select the unit type (Percentage, Number, or Currency), set the target value, assign an owner, and define the date range
- Optionally assign a category to organise the KPI
- Click Save to create the KPI , it appears in the KPI section of the portfolio Overview with attainment calculated automatically
- To record progress, click into the KPI and submit a check-in value with an optional comment , this updates the current attainment without affecting the portfolio's overall progress
- Use the row menu on any KPI to edit or delete it
- Users who own a KPI can always check in on it, even without full manage rights on the portfolio
Why It Matters
- Outcome tracking at portfolio level: Portfolio owners can now define and monitor what success looks like for the portfolio as a whole, not just track how many tasks or milestones are done.
- Consistent experience across projects and portfolios: KPI creation and check-in works the same way at the portfolio level as it does within projects, so there is no extra learning curve.
- Independent measurements: Portfolio KPIs track their own attainment separately, so check-ins never distort the portfolio's rolled- up progress from its underlying projects.
3. Project Category Assignment for Templates
Overview
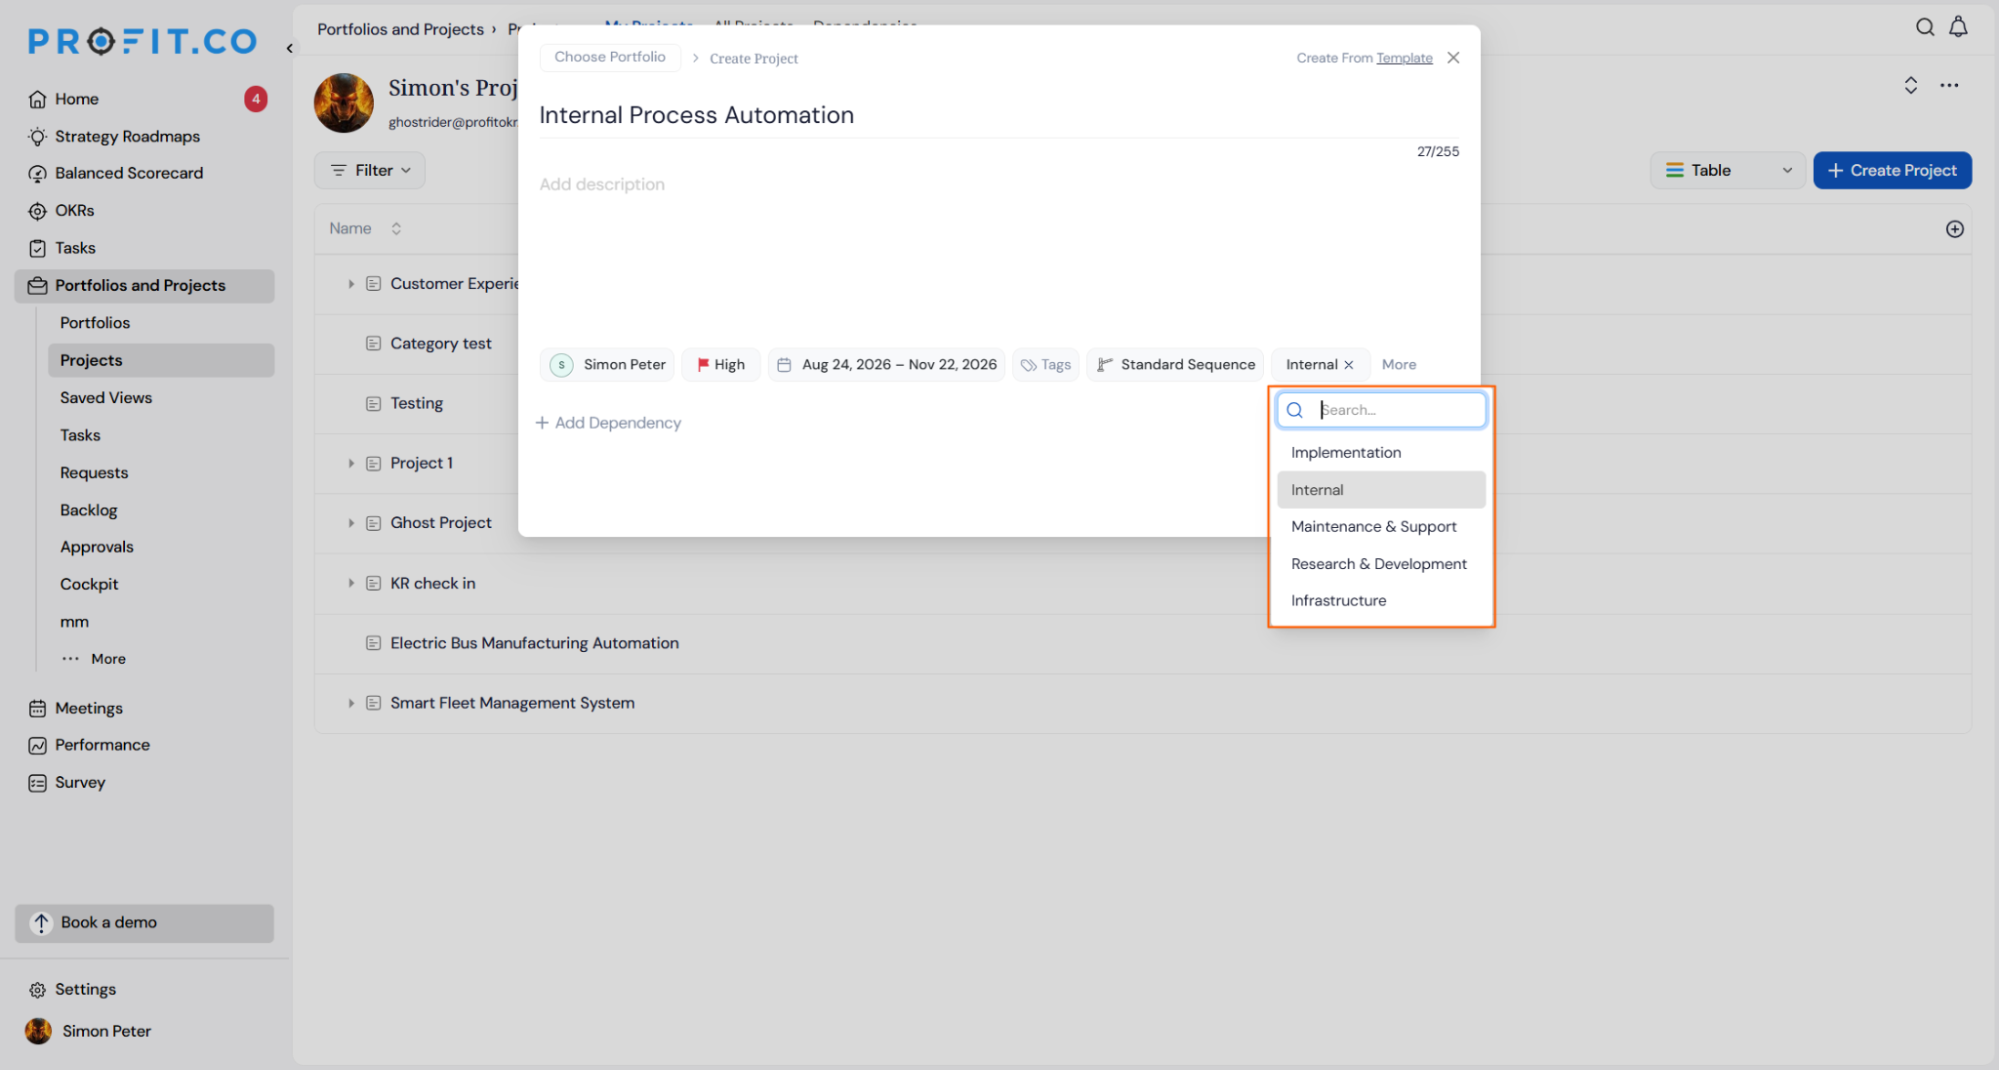
Project templates can now be assigned a category, making it easier to organise and find the right template when creating a project. Categories such as Implementation, Internal, Research and Development, and others are available by default, and super users can rename, disable, or create their own. When starting a new project from a template, users browse by category first and then select the template they need, replacing the previous flat list that required scrolling through all templates at once.
How It Works
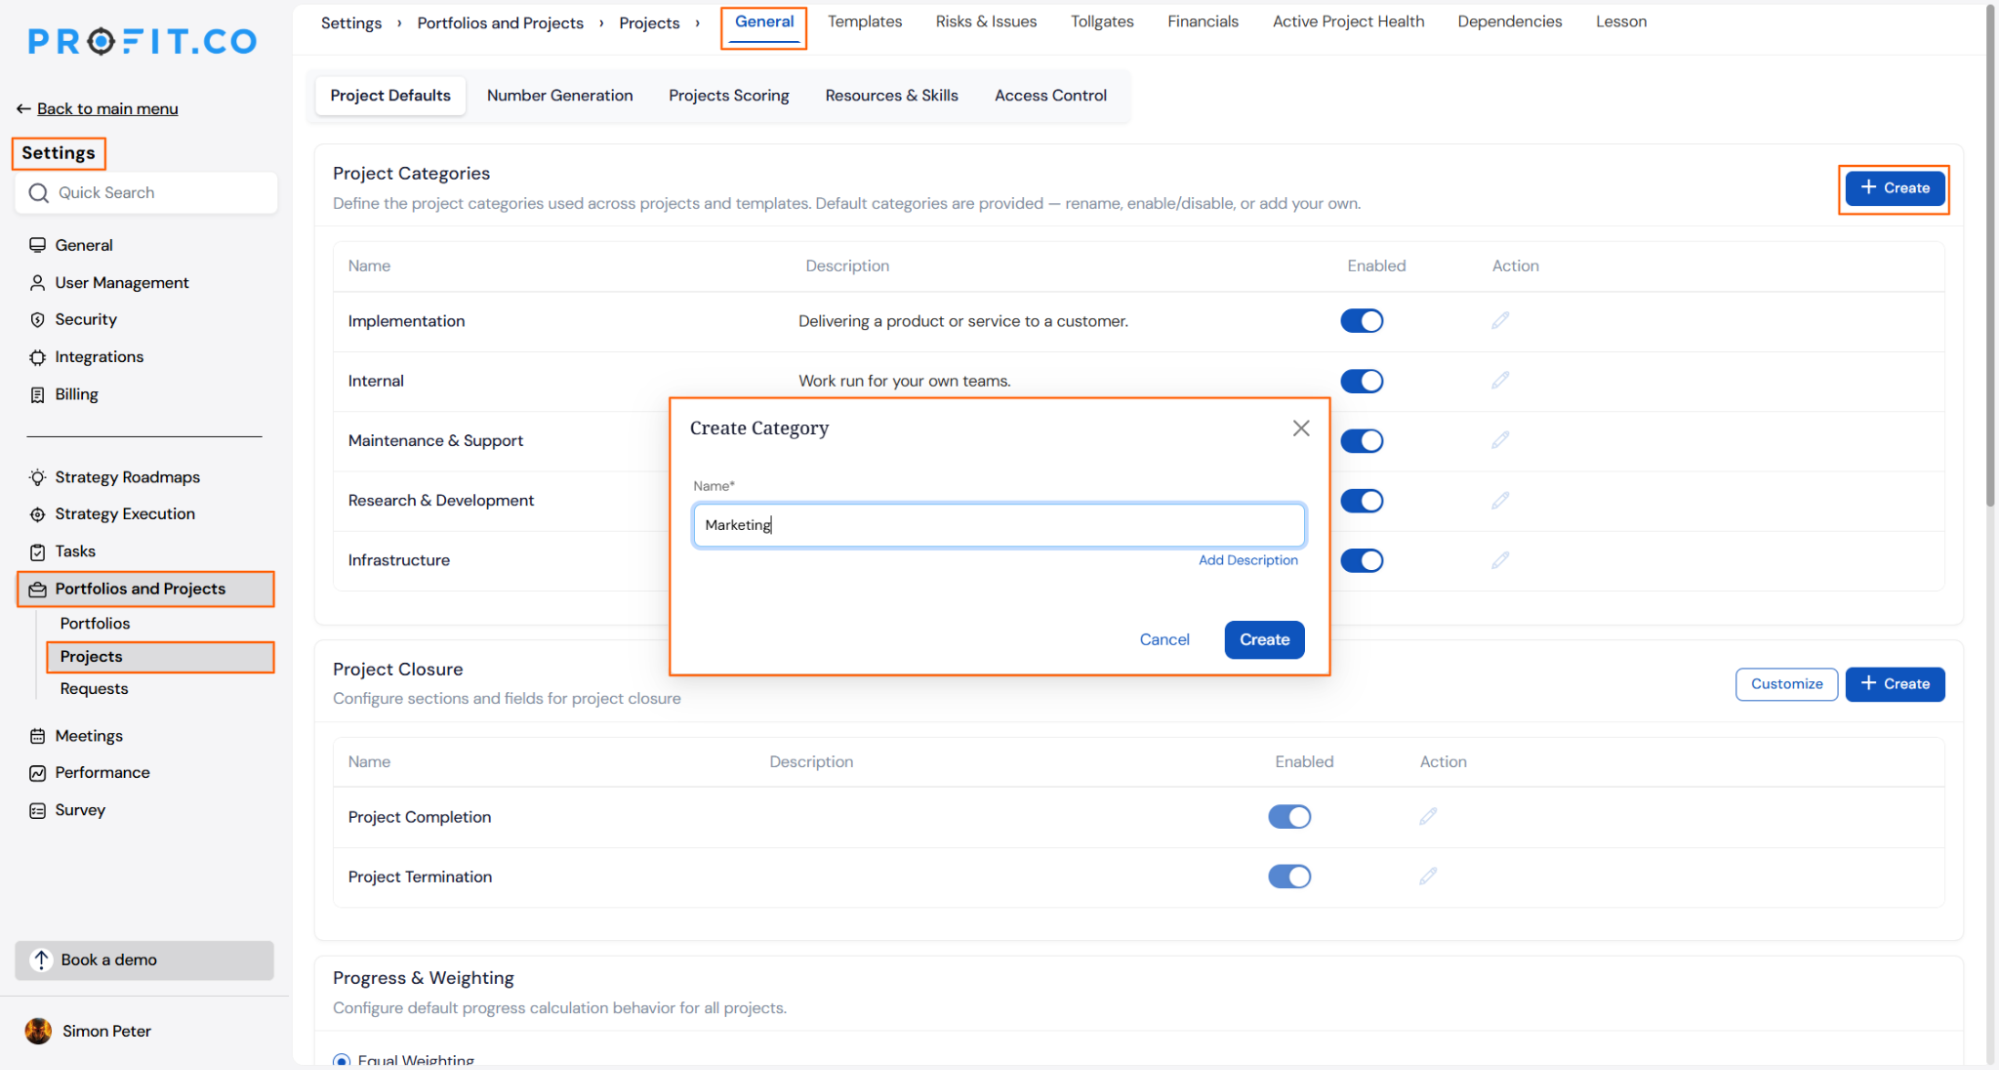
- Navigate to Settings → Portfolios and Projects → Projects → General → Project Defaults to view and manage available project categories
- Click + Create to add a new category, or use the edit icon on an existing category to rename or enable and disable it
- When editing a template, assign a category to it from the category list, or type a new category name to create one inline
- Templates with no category assigned are grouped under Uncategorized
- When creating a project, click Create From Template in the project creation panel
- Browse the available categories, select the one that matches your project type, and then choose the template to apply
- Use the search bar in the picker to find a template across all categories without navigating by category
Why It Matters
- Faster template selection: Project managers can go straight to the category that matches their work type instead of scrolling through every template in the library.
- Better organised template libraries: Super users can group templates by how they are used, keeping the library clean and easy to maintain as the number of templates grows.
- More consistent project setups: Guiding teams to the right category upfront reduces the chance of starting a project from the wrong template.
4. Portfolio-Level Resource Management
Overview
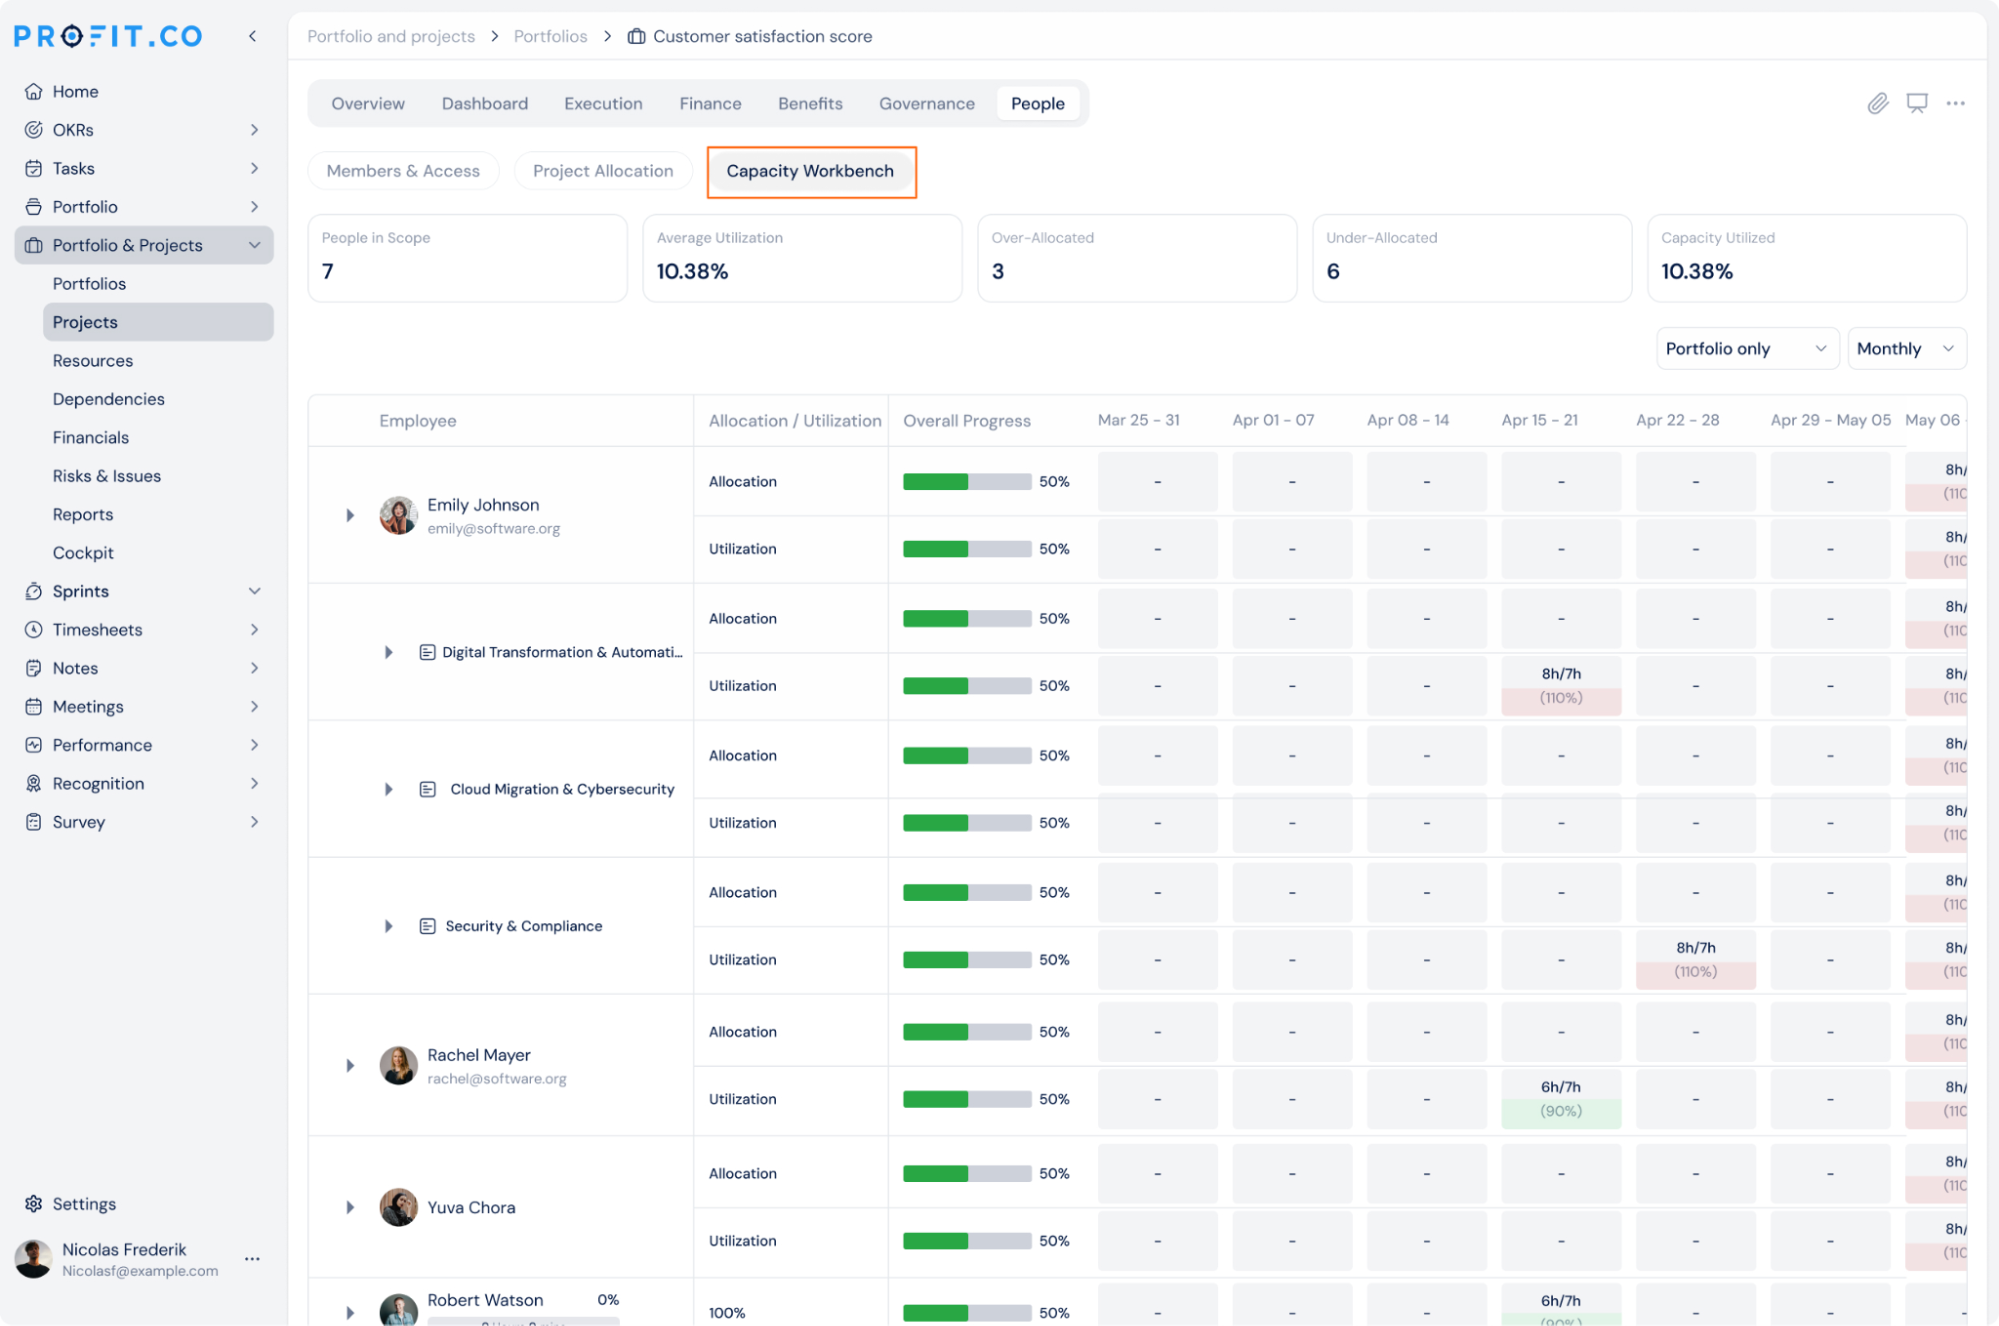
Portfolio owners can now manage, allocate, and monitor resources across all projects in a portfolio from a single place, without opening each project individually. The new People tab on the portfolio page brings together three views: Members & Access for managing who is in the portfolio, Project Allocation for assigning people to specific projects, and Capacity Workbench for monitoring each person's total load across the portfolio. This gives portfolio owners a clear picture of whether their portfolio is over- or under- committed before it becomes a delivery problem.
How It Works
- Navigate to Portfolios and Projects → Portfolios → open the relevant portfolio
- Click the People tab to access the three resource management sub- tabs
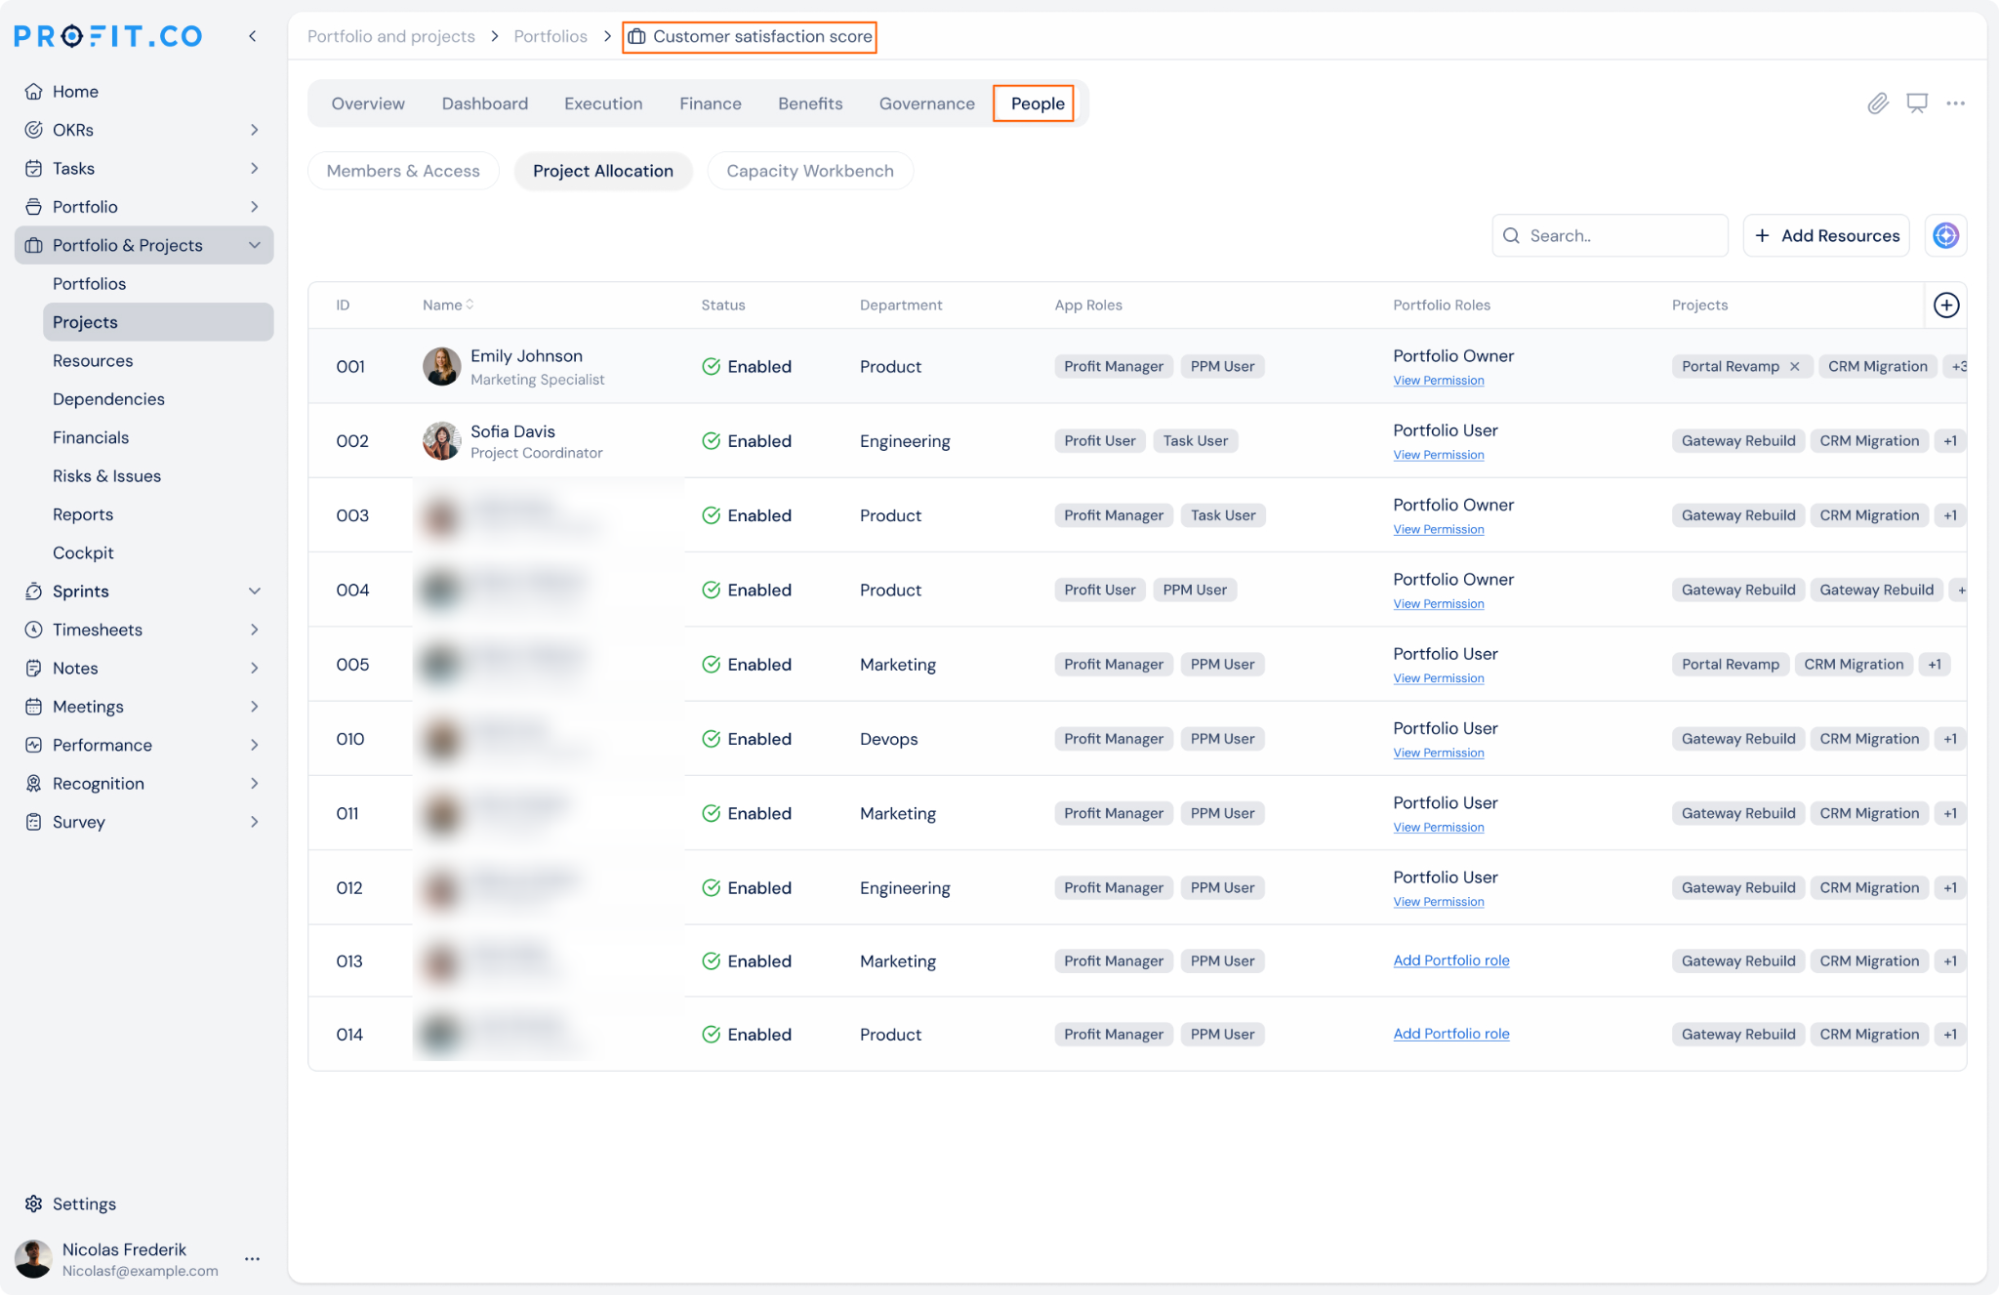
Members & Access
- Click + Add Members to add people to the portfolio and assign them a portfolio role
- The member list shows each person's status, department, job title, and portfolio role
- Portfolio roles grant visibility down through all sub- portfolios and projects beneath the portfolio
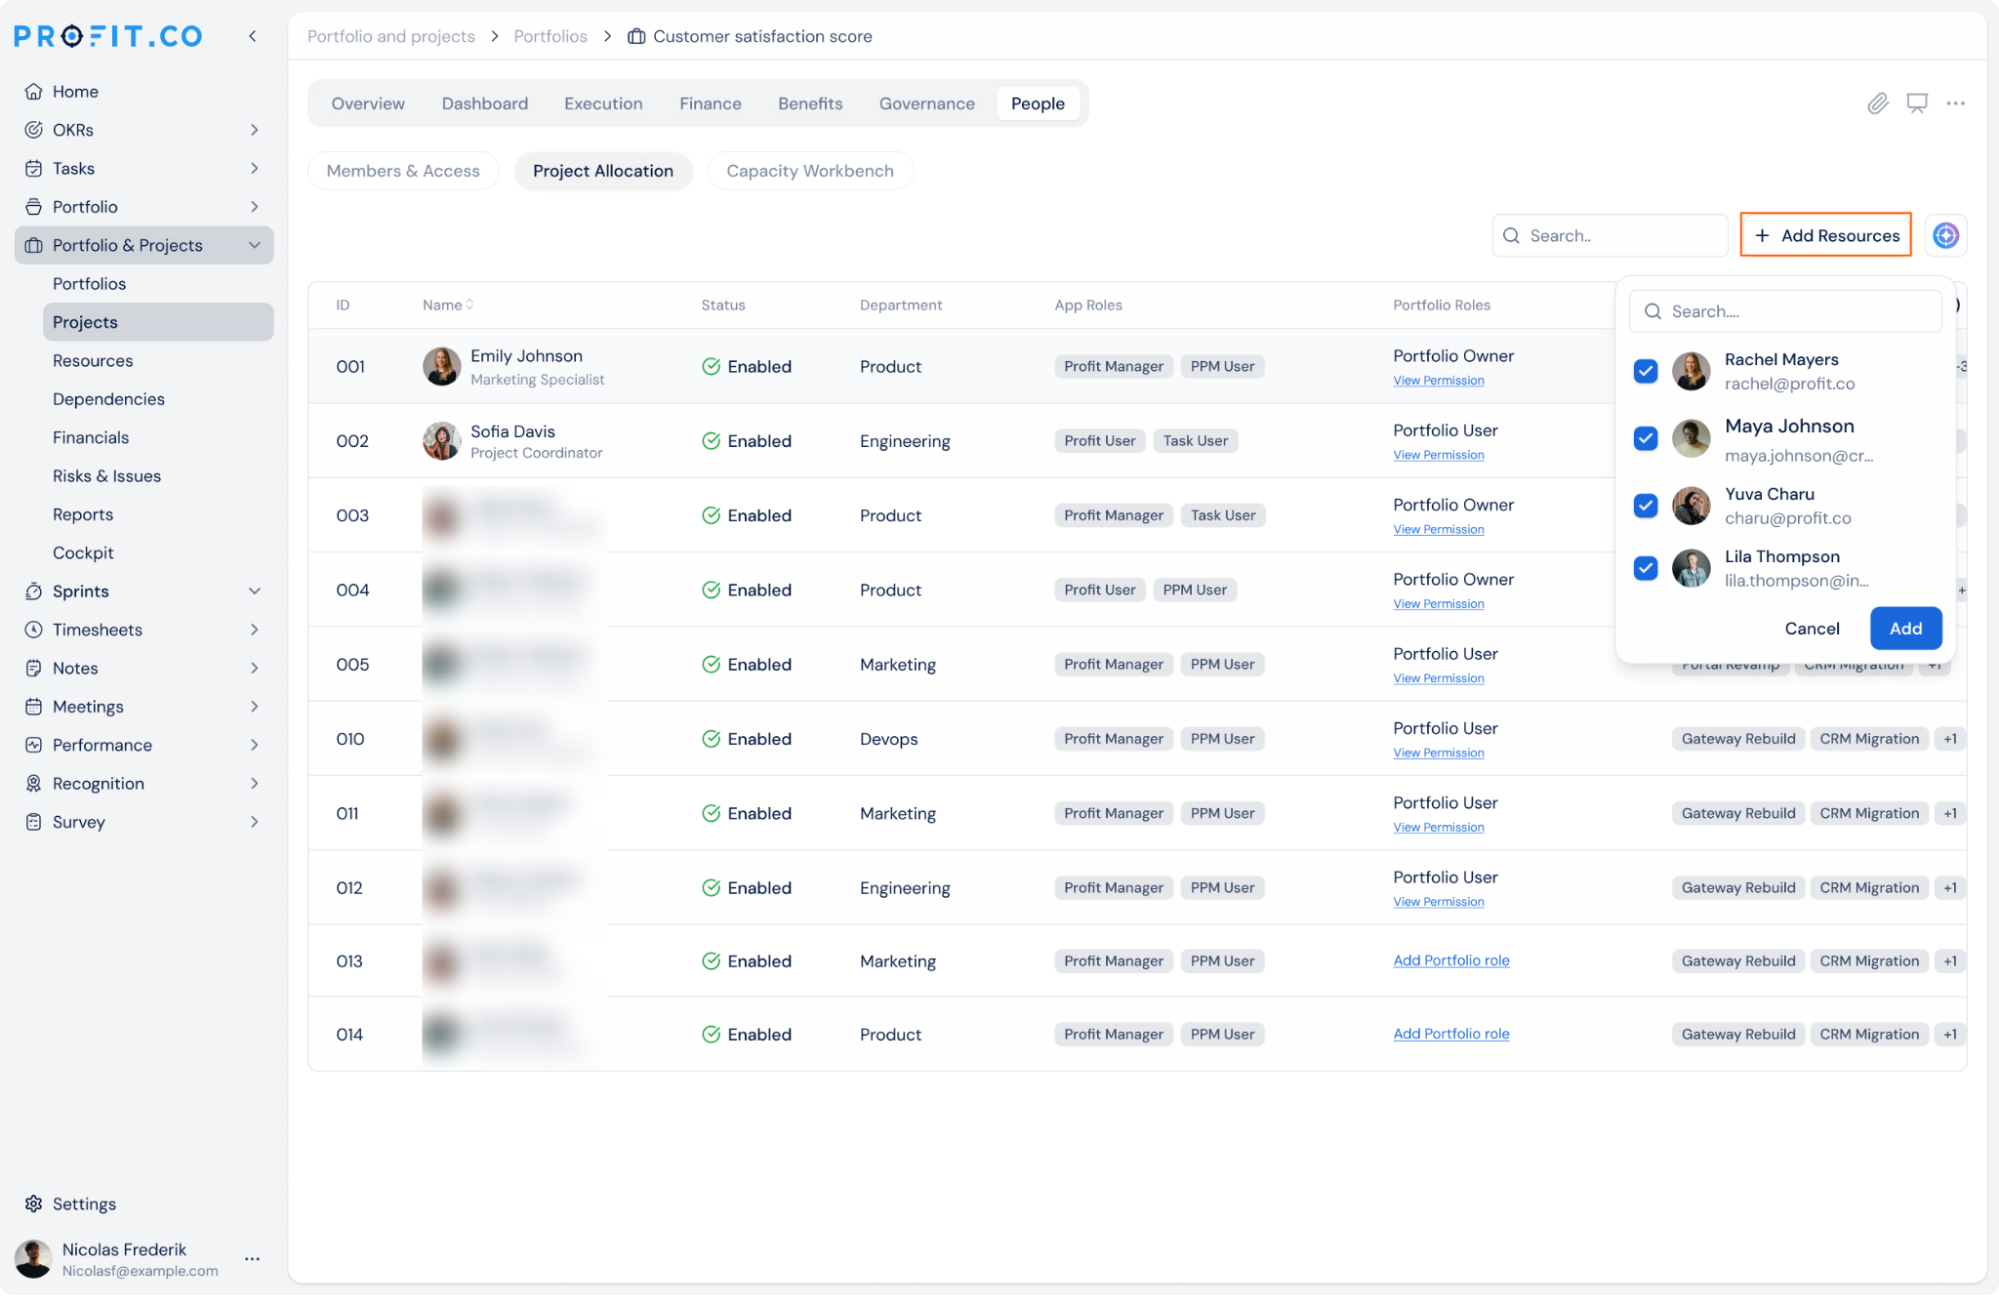
Project Allocation
- Select a project from the Allocate to project dropdown to open the allocation panel for that project
- Allocate portfolio members to the selected project using Full- time or Part- time options across weekly, monthly, or specific timeframe windows
- Each person's row shows which projects they are already allocated to; click the project chips to view or remove individual allocations
- Users who are on a project inside the portfolio but are not yet portfolio members appear automatically , click + Add to portfolio on their row to add them
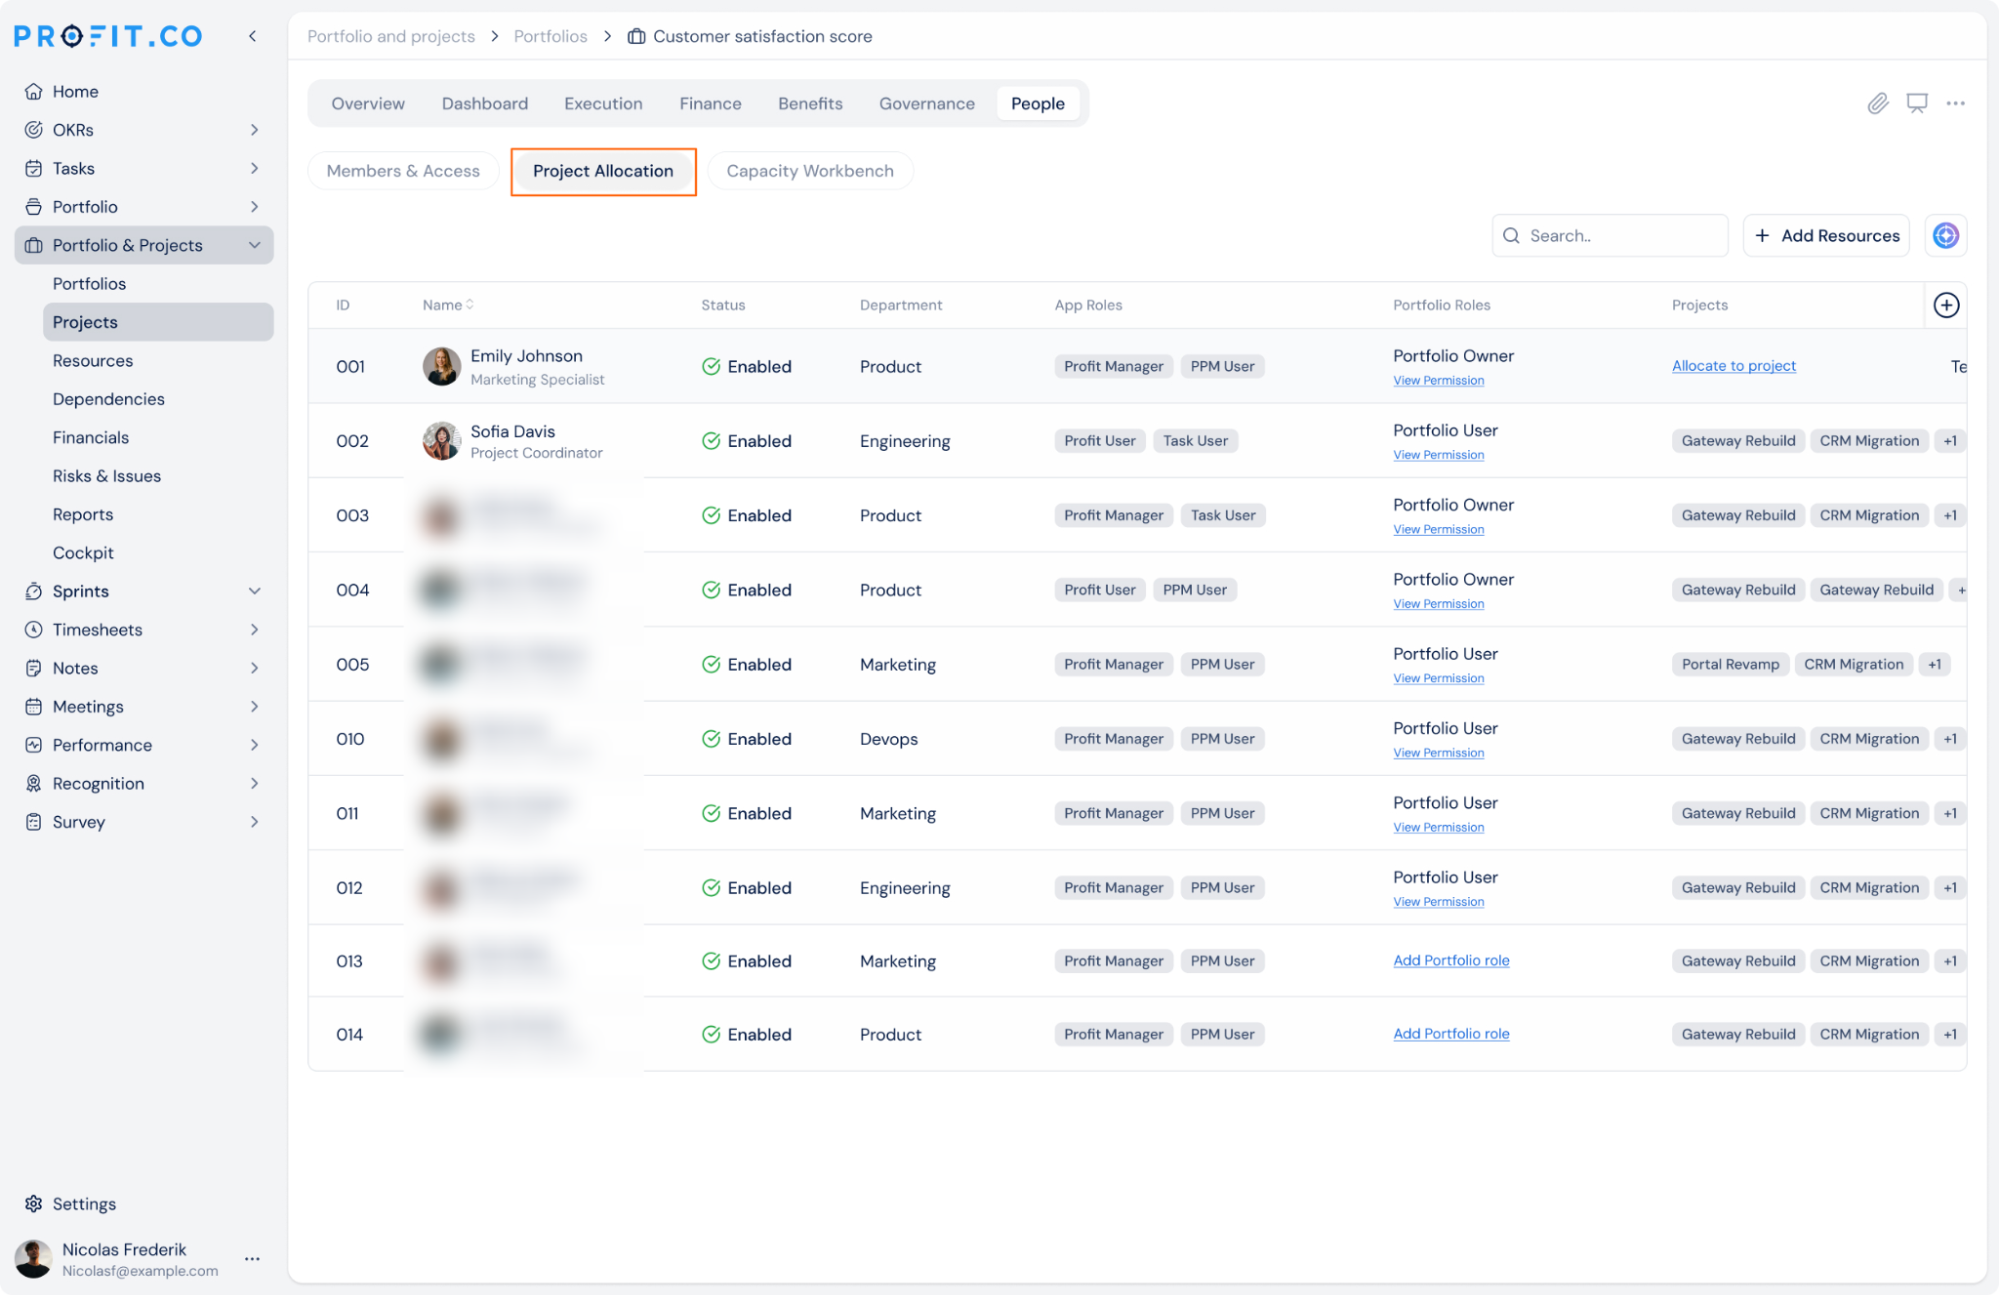
Capacity Workbench
- View each person's allocation and availability across all portfolio projects in a heatmap layout
- Switch between Monthly, Weekly, and Yearly views to see load at the right level of detail
- Use the scope selector to include only the main portfolio, the portfolio plus immediate sub- portfolios, or the portfolio plus all sub- portfolios
- People showing over 95% utilisation are flagged in red; click the resolve icon to open the rebalance panel and reassign hours or people across projects
Why It Matters
- Full portfolio visibility in one place: Portfolio owners can see everyone's load across all projects in the portfolio at once, replacing manual spreadsheet stitching with a live, accurate view.
- Early over- allocation detection: The Capacity Workbench flags over- committed people before the month starts, giving owners time to rebalance rather than react to a delivery problem.
- Governed allocation without duplication: Allocations are always authored on the individual project, and the portfolio rolls them up automatically, so there is no double entry and no risk of the portfolio and project records falling out of sync.
5. Decimal Value Support for Project and Portfolio KPIs
Overview
Project and portfolio KPIs now support decimal values when setting targets and recording check-ins, removing the previous limitation that restricted all KPI values to whole numbers. When creating a KPI, users can set the number of decimal places they need, and that precision carries through automatically to every check-in and wherever the KPI value is displayed. This is particularly useful for currency KPIs and any metric where whole- number tracking is not precise enough.
How It Works
- Navigate to Portfolios and Projects → open a project or portfolio → go to the Overview page
- Click Create KPI and fill in the KPI name, metric type, and other details
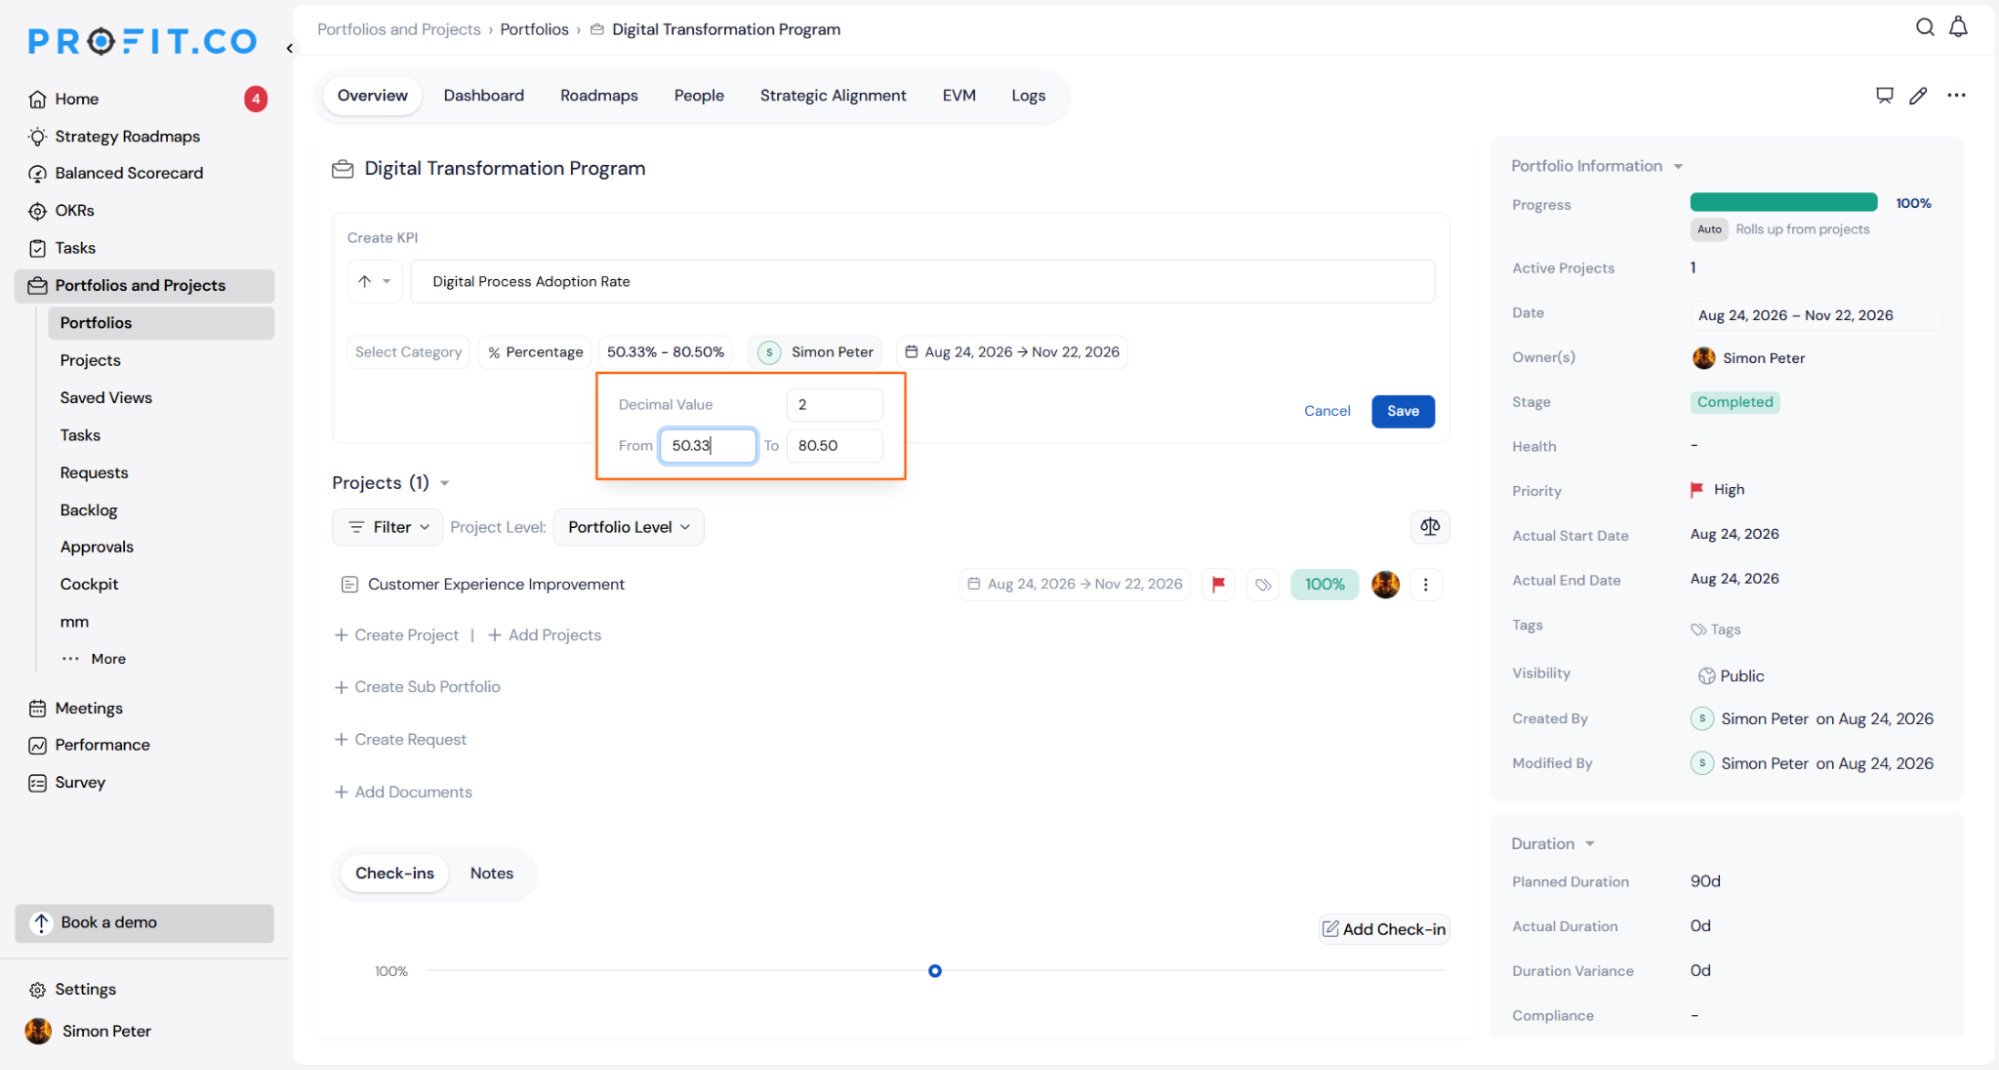
- Click Enter Value to open the value popup
- Set the number of decimal places using the Decimal Value control
- Enter the From (start) and To (target) values using decimals as needed
- Click Save to create the KPI
- When recording a check-in, the value field automatically matches the decimal precision set at creation , no separate configuration needed
- Decimal values display correctly across the KPI row, the check-in log, and the KPI trend chart
- Existing KPIs created with whole numbers are not affected by this change
Why It Matters
- More accurate KPI tracking: Teams working with currency amounts or precise numeric targets can now set and track KPI values at the level of detail their reporting actually requires.
- Consistent precision across all views: The decimal format set at creation flows through automatically to check-ins and charts, so values are always displayed the same way without manual adjustment.
- No disruption to existing KPIs: KPIs already set up with whole numbers continue to work exactly as before, so teams can adopt decimal support at their own pace.
6. AI Status Report Templates for Portfolio Summaries
Overview
Portfolio owners can now choose from multiple report templates when sending an AI- generated portfolio status report, including a new visual Dashboard template designed for leadership and board reporting. Previously, the Send Summary feature produced a single fixed text format. Users can now select the template that best suits their audience before sending, and super users can manage which templates are available, set a default, and control which sections appear in each template.
How It Works
- Open the relevant portfolio and click the ⋮ menu, then select AI Status Report
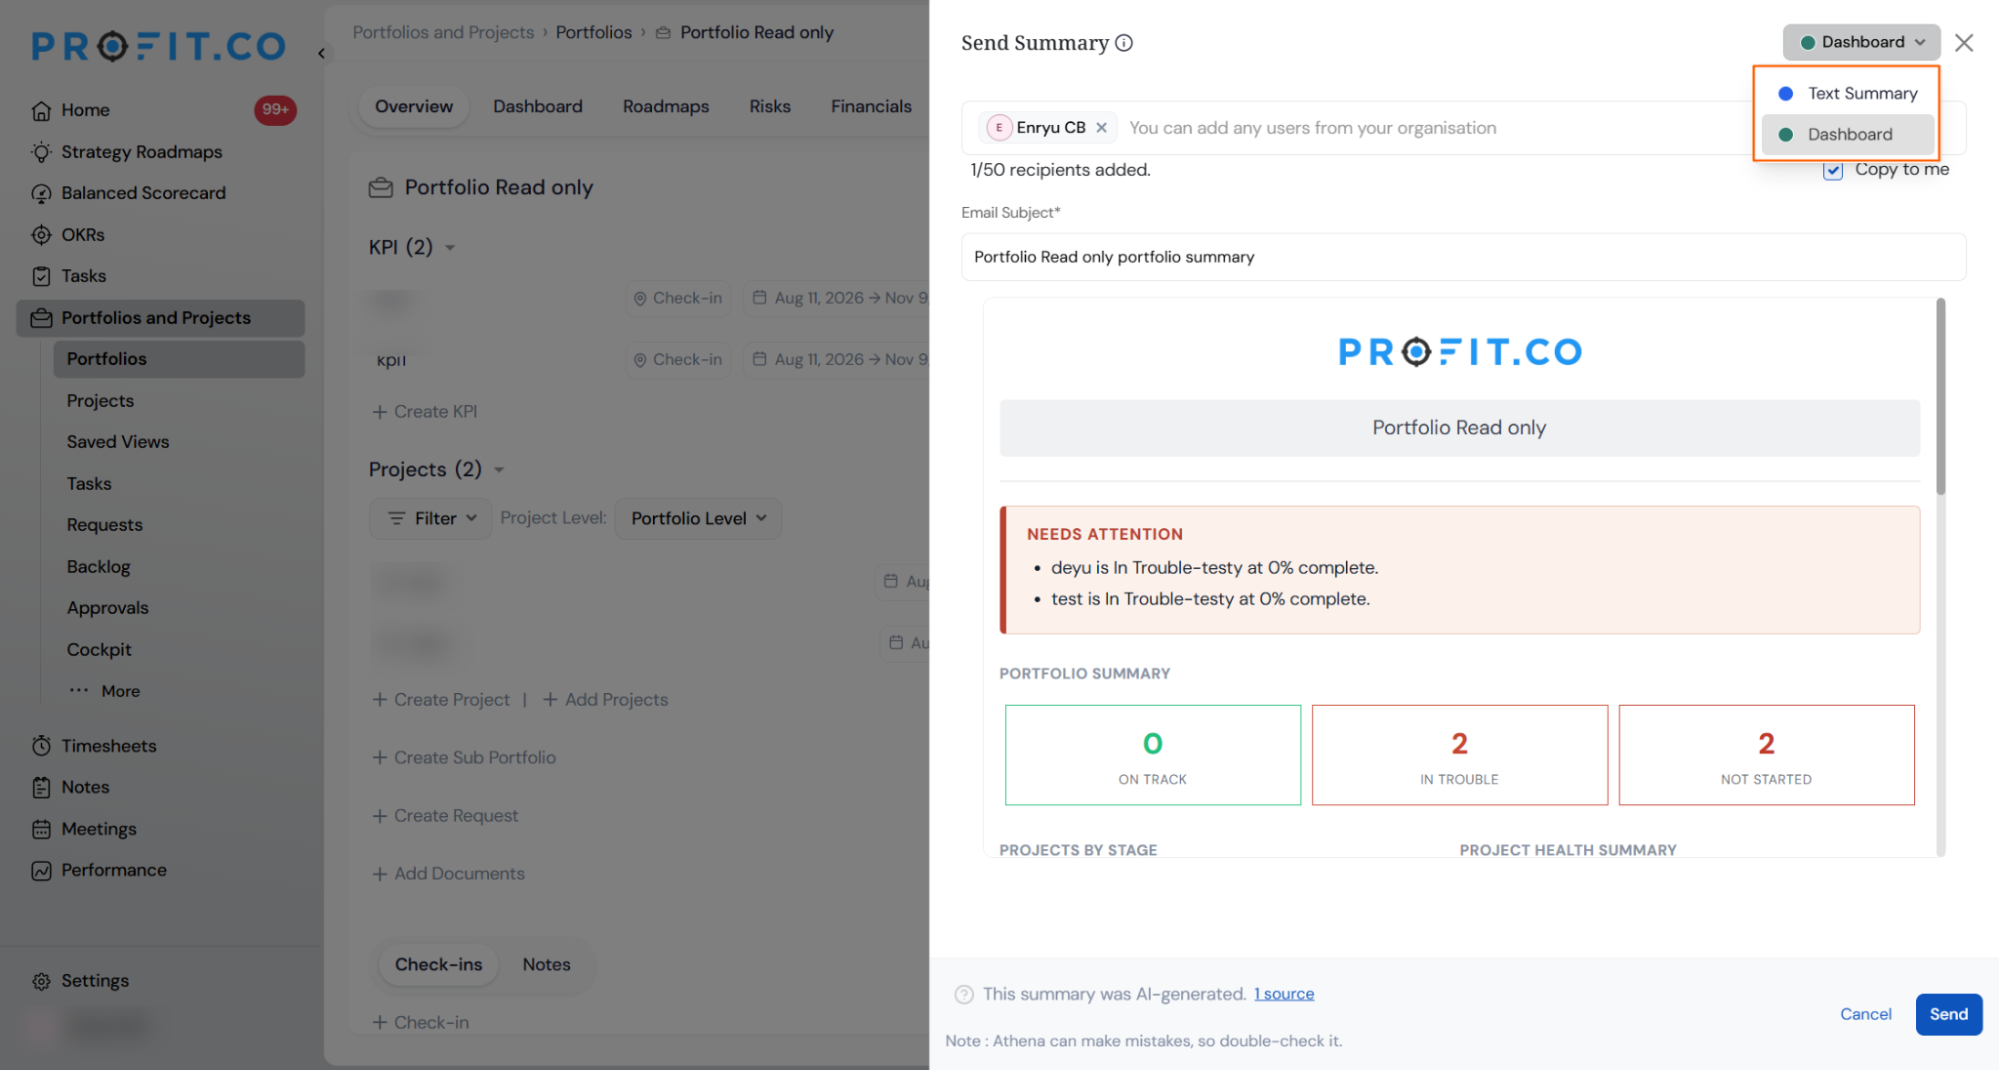
- The Send Summary panel opens on the right side of the screen with a live email preview
- In the top- right of the panel, click the template selector to choose between available report templates:
- Text Summary – a structured section- based email covering portfolio status, timeline, risks, issues, and budget
- Dashboard – a visual email with KPI summary cards, project health breakdown, stage distribution, and a needs- attention section, suited for executive and board audiences
- The preview updates immediately when a different template is selected
- Add recipients (up to 50), edit the email subject, and check Copy to me if needed
- Click Send to deliver the report
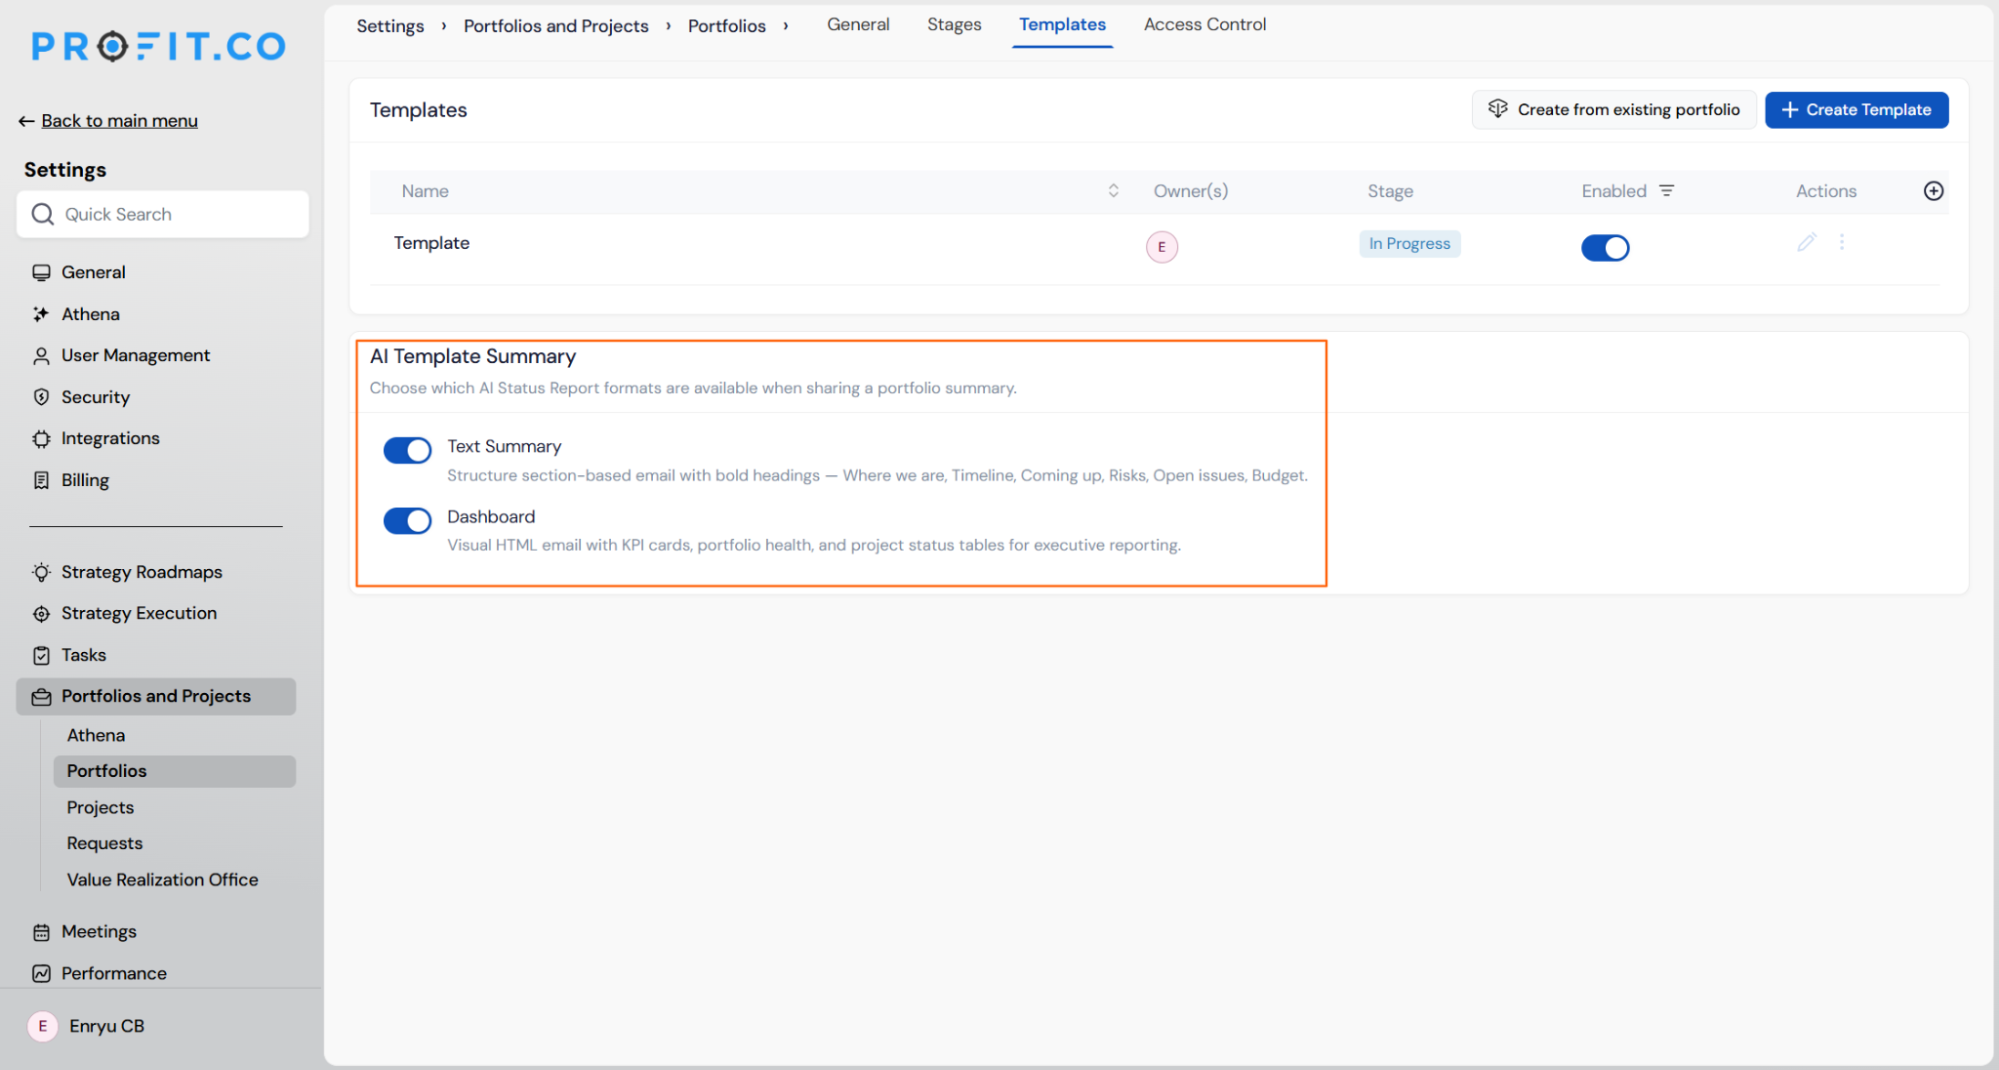
- To manage templates, navigate to Settings → Portfolios and Projects → Portfolios → Templates
- Super users can edit each template to show or hide individual sections, set a default template, and activate or deactivate templates to control what appears in the sender's template selector
Why It Matters
- Reports matched to the audience: Portfolio owners can send a detailed text summary to project teams and a visually clear dashboard report to leadership, without manually reformatting anything.
- Consistent reporting across the organisation: Super users define and manage the available templates centrally, so all portfolio status reports follow the same structure and standards regardless of who sends them.
- AI- generated with full control: The report content is generated automatically from live portfolio data, while section- level controls let admins tailor exactly what each template includes before it reaches the recipient.
7. Associated KR roll-up on project and portfolio list views
Overview
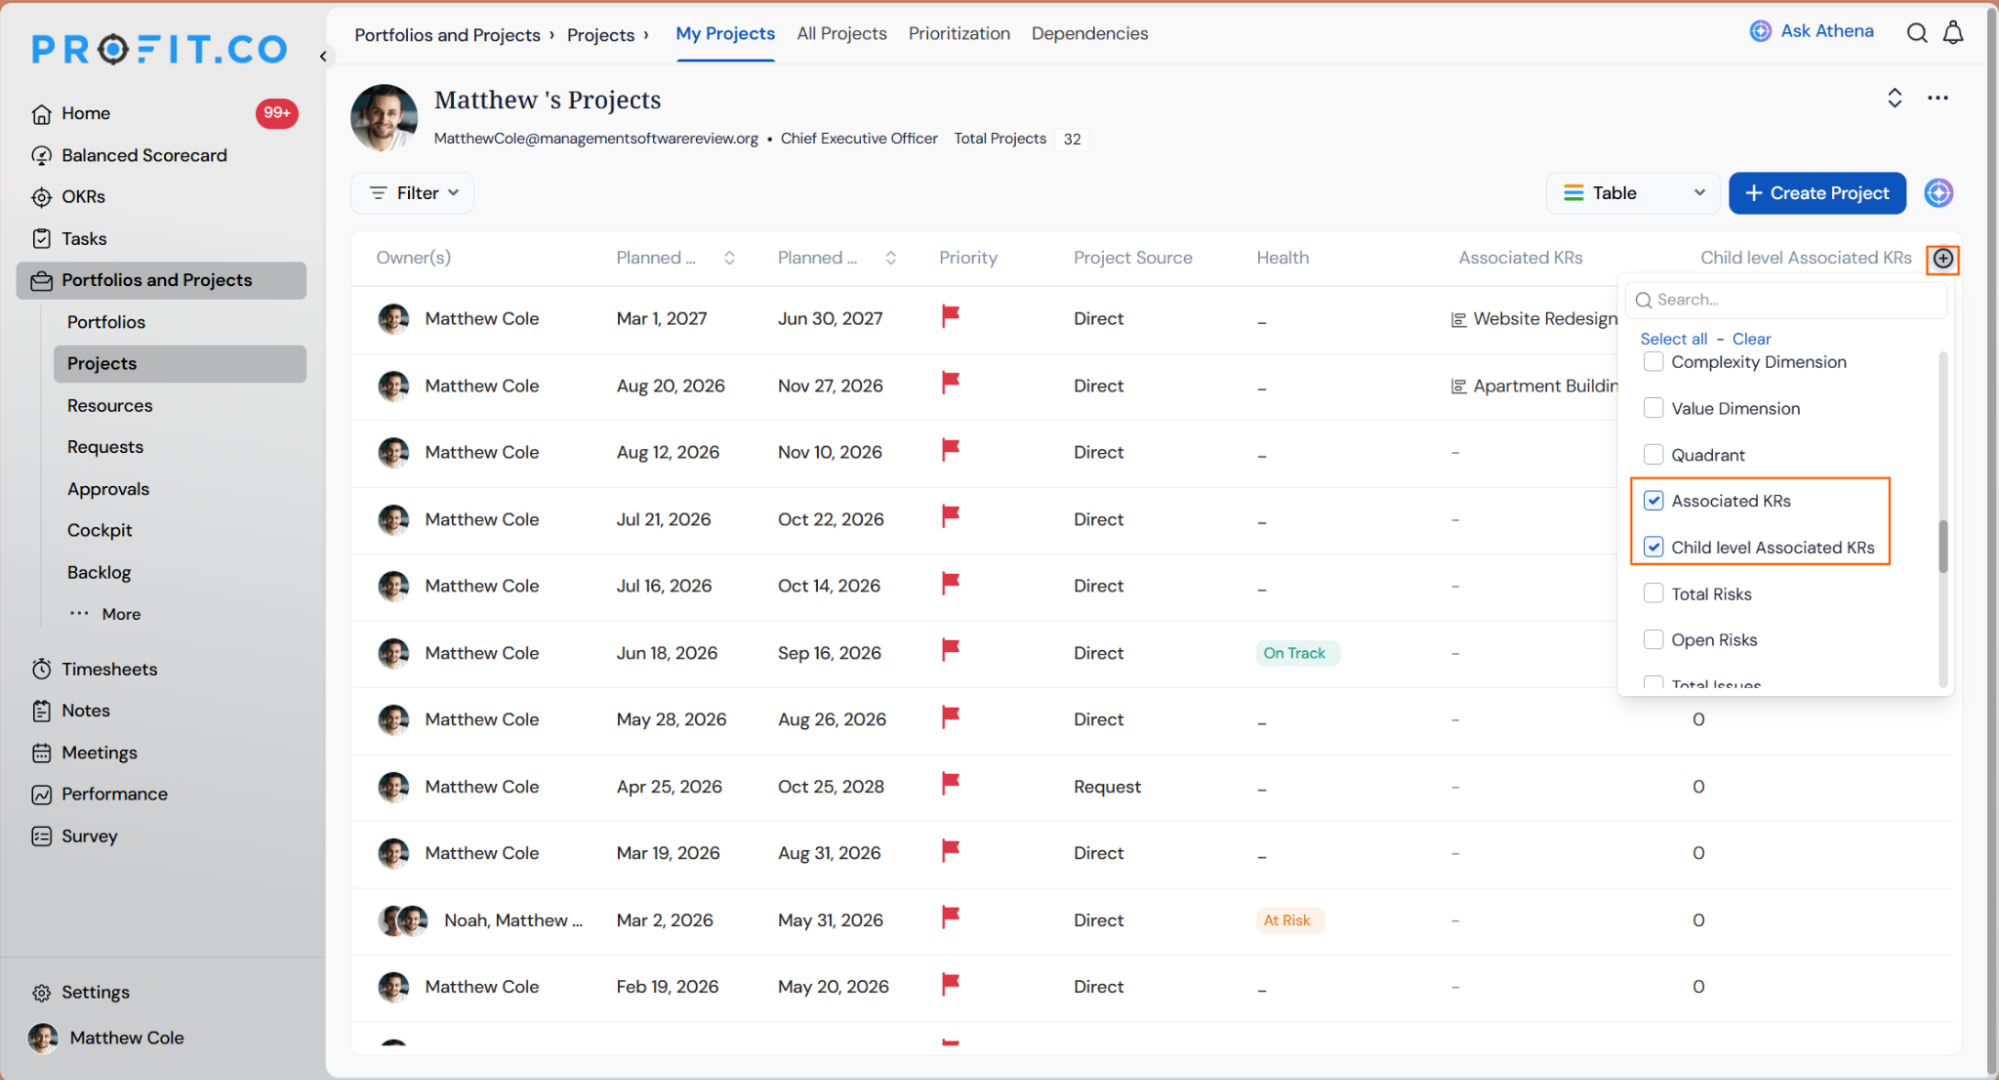
Project and portfolio list views now show how much OKR alignment exists across each row without needing to open individual items. Two new optional columns can be added: one showing the Key Results directly linked to each item, and another displaying a cumulative count of all KR alignments across the item and every descendant beneath it, at any depth. Clicking the count opens a drill-down panel that breaks down exactly which objects and Key Results are contributing to the total.
How It Works
- From the project or portfolio list view, click the + icon at the right end of the column header row to open the column picker.
- Enable Associated KRs to display the Key Result(s) directly linked to each row. The first KR name is shown; where more than one KR is associated, an overflow indicator (e.g., +1) appears immediately after the name.
- Enable Child level Associated KRs to display a running total of all KR alignment records across the item and every project, portfolio, or task beneath it. Rows with no alignment show a dash and are not interactive.
Why It Matters
- OKR alignment visible without opening items: Leaders can see at a glance how much strategic alignment exists under any project or portfolio row, making it easy to spot where coverage is strong and where it is absent across the full list.
- One click to the full breakdown: Clicking the count opens a drill-down showing the complete hierarchy of contributing objects and their aligned Key Results, removing the need to navigate through multiple levels manually.
- Optional and non-disruptive: Both columns are controlled through the existing column picker, so teams can surface KR alignment data when it is relevant without changing the default list layout for everyone.
Enhancements:
8. Portfolio Financial Alerts and Spend Threshold Dashboard
Overview
Portfolio owners and finance managers can now monitor budget utilisation across all projects in a portfolio from a single dashboard view, with automatic alerts when spending crosses defined thresholds. Super users configure warning, critical, and overrun thresholds once in Settings, and those rules apply across every portfolio in the account. When a project's spend crosses a threshold, the right people are notified in- app or by email, and the portfolio dashboard highlights exactly which project is driving the issue.
How It Works
- Navigate to Settings → Portfolios and Projects → Projects → Financials to configure financial alerts
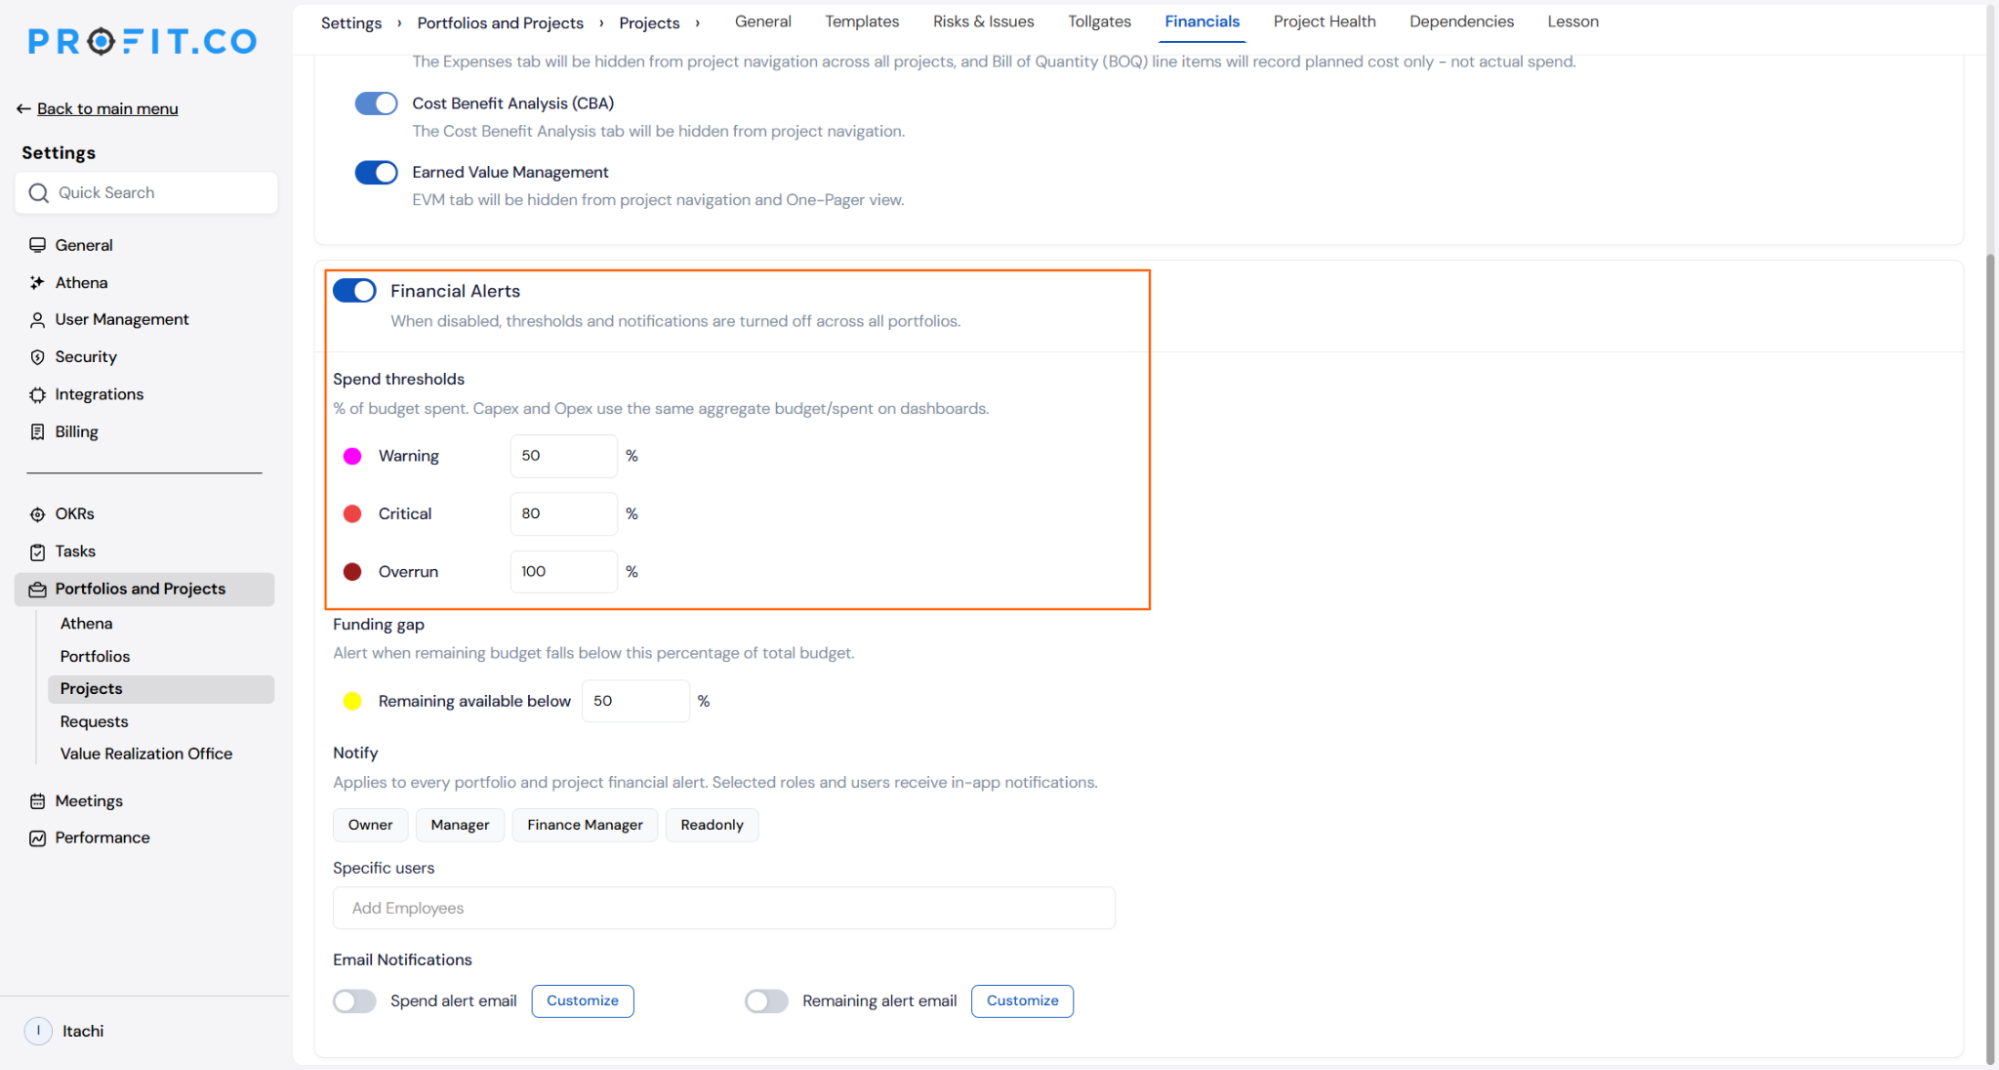
- Enable the Financial Alerts toggle to activate threshold evaluation across all portfolios
- Set spend threshold percentages for Warning, Critical, and Overrun levels; these apply to budget spent as a percentage of funded amount
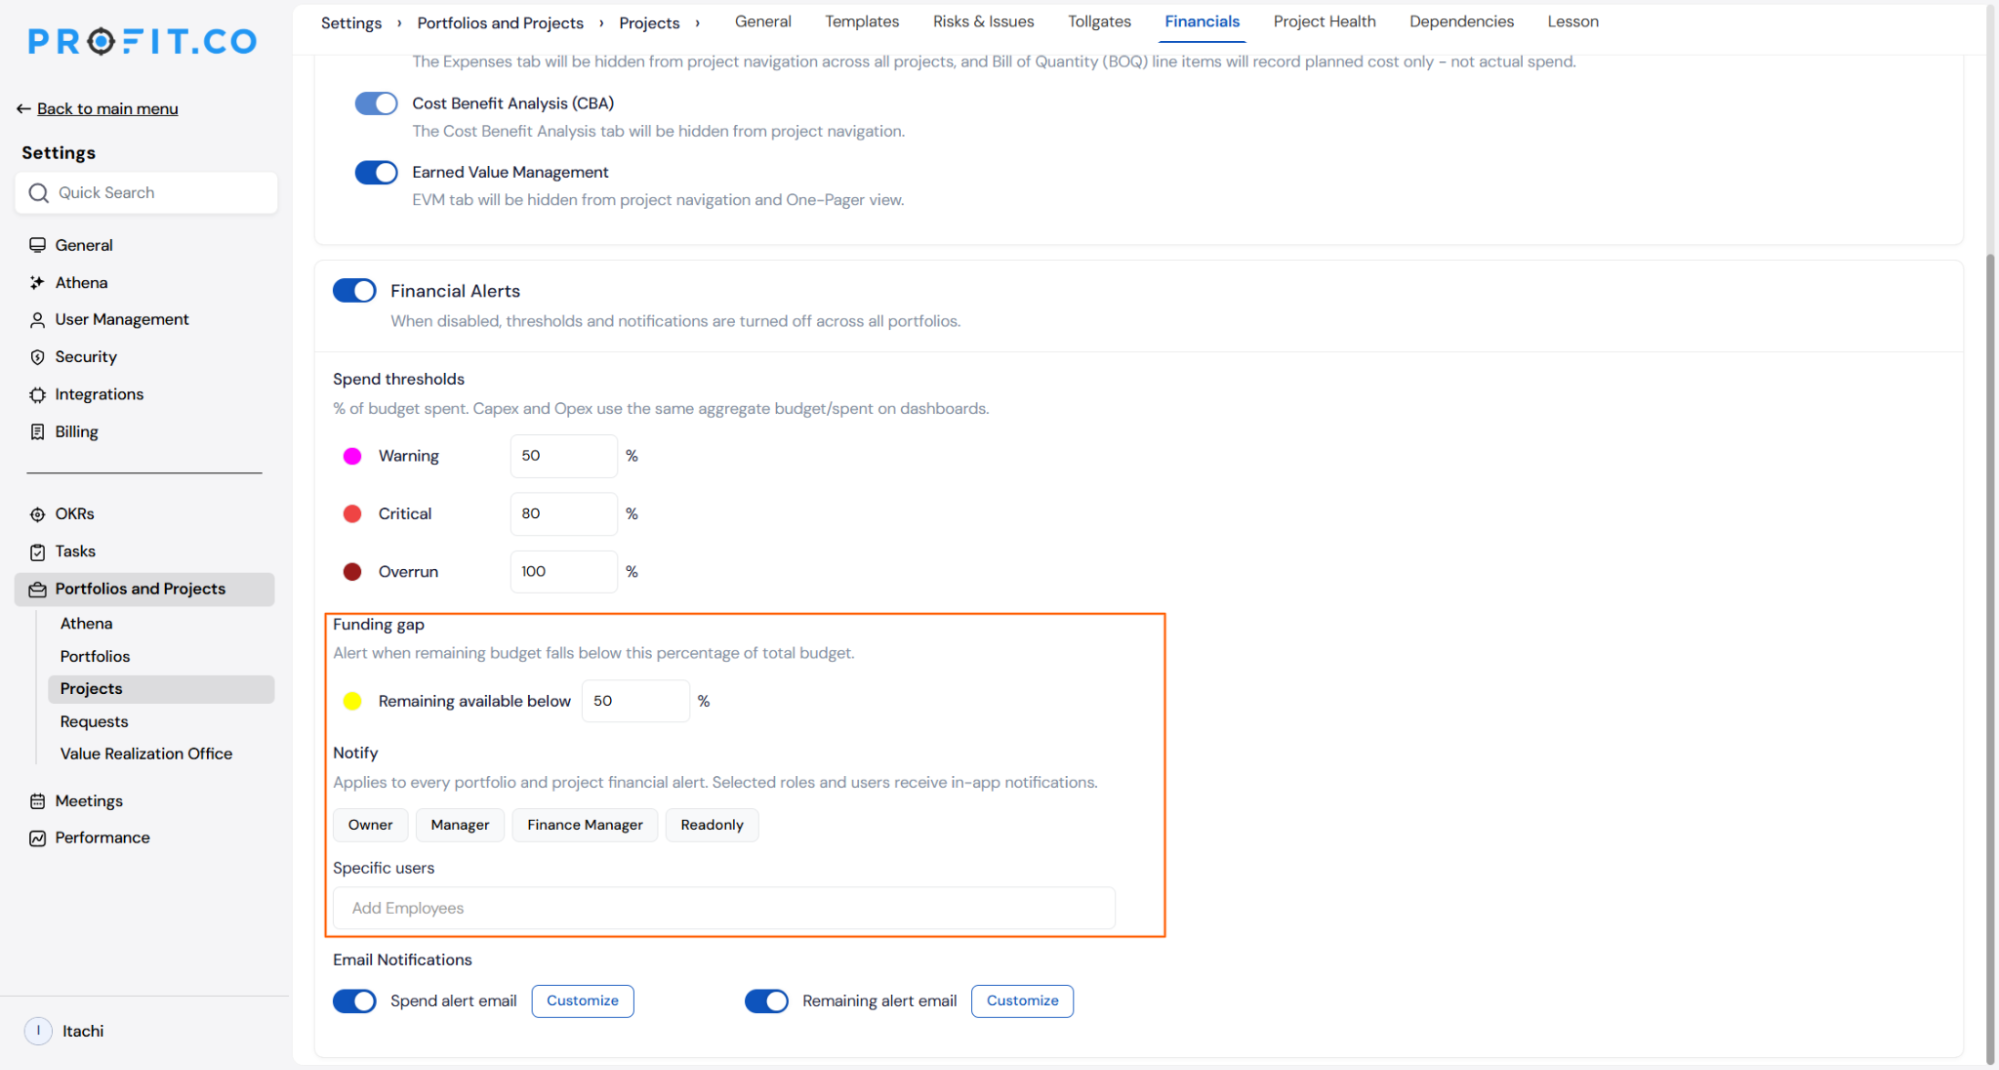
- Set a Funding Gap threshold to trigger an alert when remaining budget falls below a defined percentage of total budget
- Under Notify, select which roles receive alerts (Owner, Manager, Finance Manager) and add specific users who should be notified across all portfolios regardless of their membership
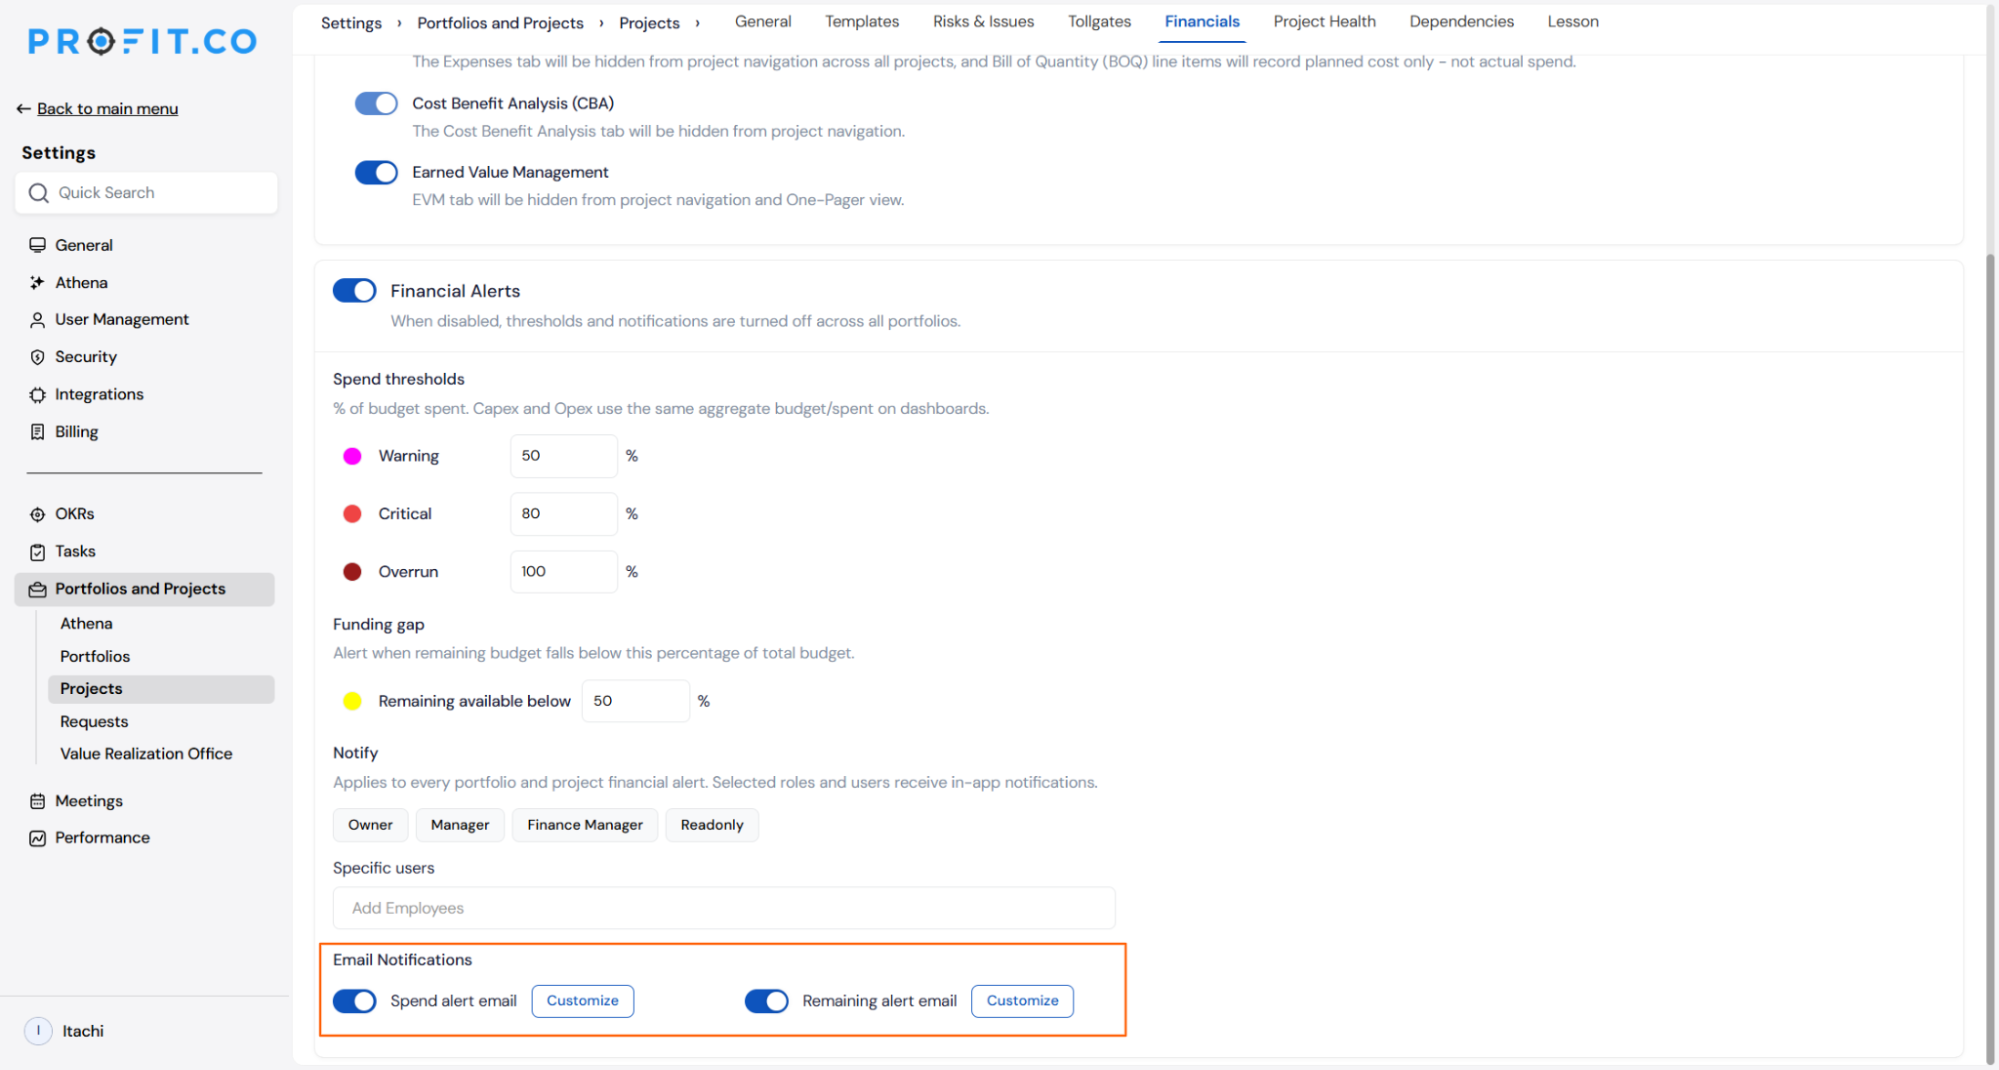
- Enable Email Notifications and customise the alert email templates for each alert type if needed
- On the portfolio Dashboard, the Financial Breakdown widget shows a per- project table with budget, funded amount, spent, remaining, utilisation, and health status
- Projects whose spending has crossed a threshold are highlighted with the corresponding health chip (Warning, Critical, or Overrun) directly on the dashboard
- Active alerts appear in the Alerts Strip on the portfolio Financials tab, each showing the severity, values, time fired, and a direct action to review or respond
- Forecast Overrun alerts fire automatically when a project's estimated cost at completion exceeds its funded amount, with no additional configuration needed
Why It Matters
- Early warning before problems escalate: Portfolio owners are notified the moment a project crosses a spend threshold, giving them time to act before a budget overrun becomes a delivery problem.
- Per- project financial clarity at portfolio level: The Financial Breakdown widget shows exactly which project is driving spend across the portfolio, without needing to open each project individually.
- Centralised configuration, consistent enforcement: Super users define alert rules once in Settings and they apply automatically to every portfolio, keeping governance consistent without repeated setup.
9. Activity Logs for Portfolio and Project Management
Overview
Every change made within a project, including edits, deletions, and status updates to milestones, tasks, and other project items, is now recorded in a dedicated Logs view. Project owners and team members can open the log at any time to see a full history of what changed, who made the change, and when it happened. This gives teams a clear, reliable record to refer back to whenever they need to understand how a project evolved.
How It Works
- Navigate to Portfolios and Projects → Projects → open the relevant project
- Click the ⋮ menu in the top- right corner of the project page
- Select Logs from the dropdown
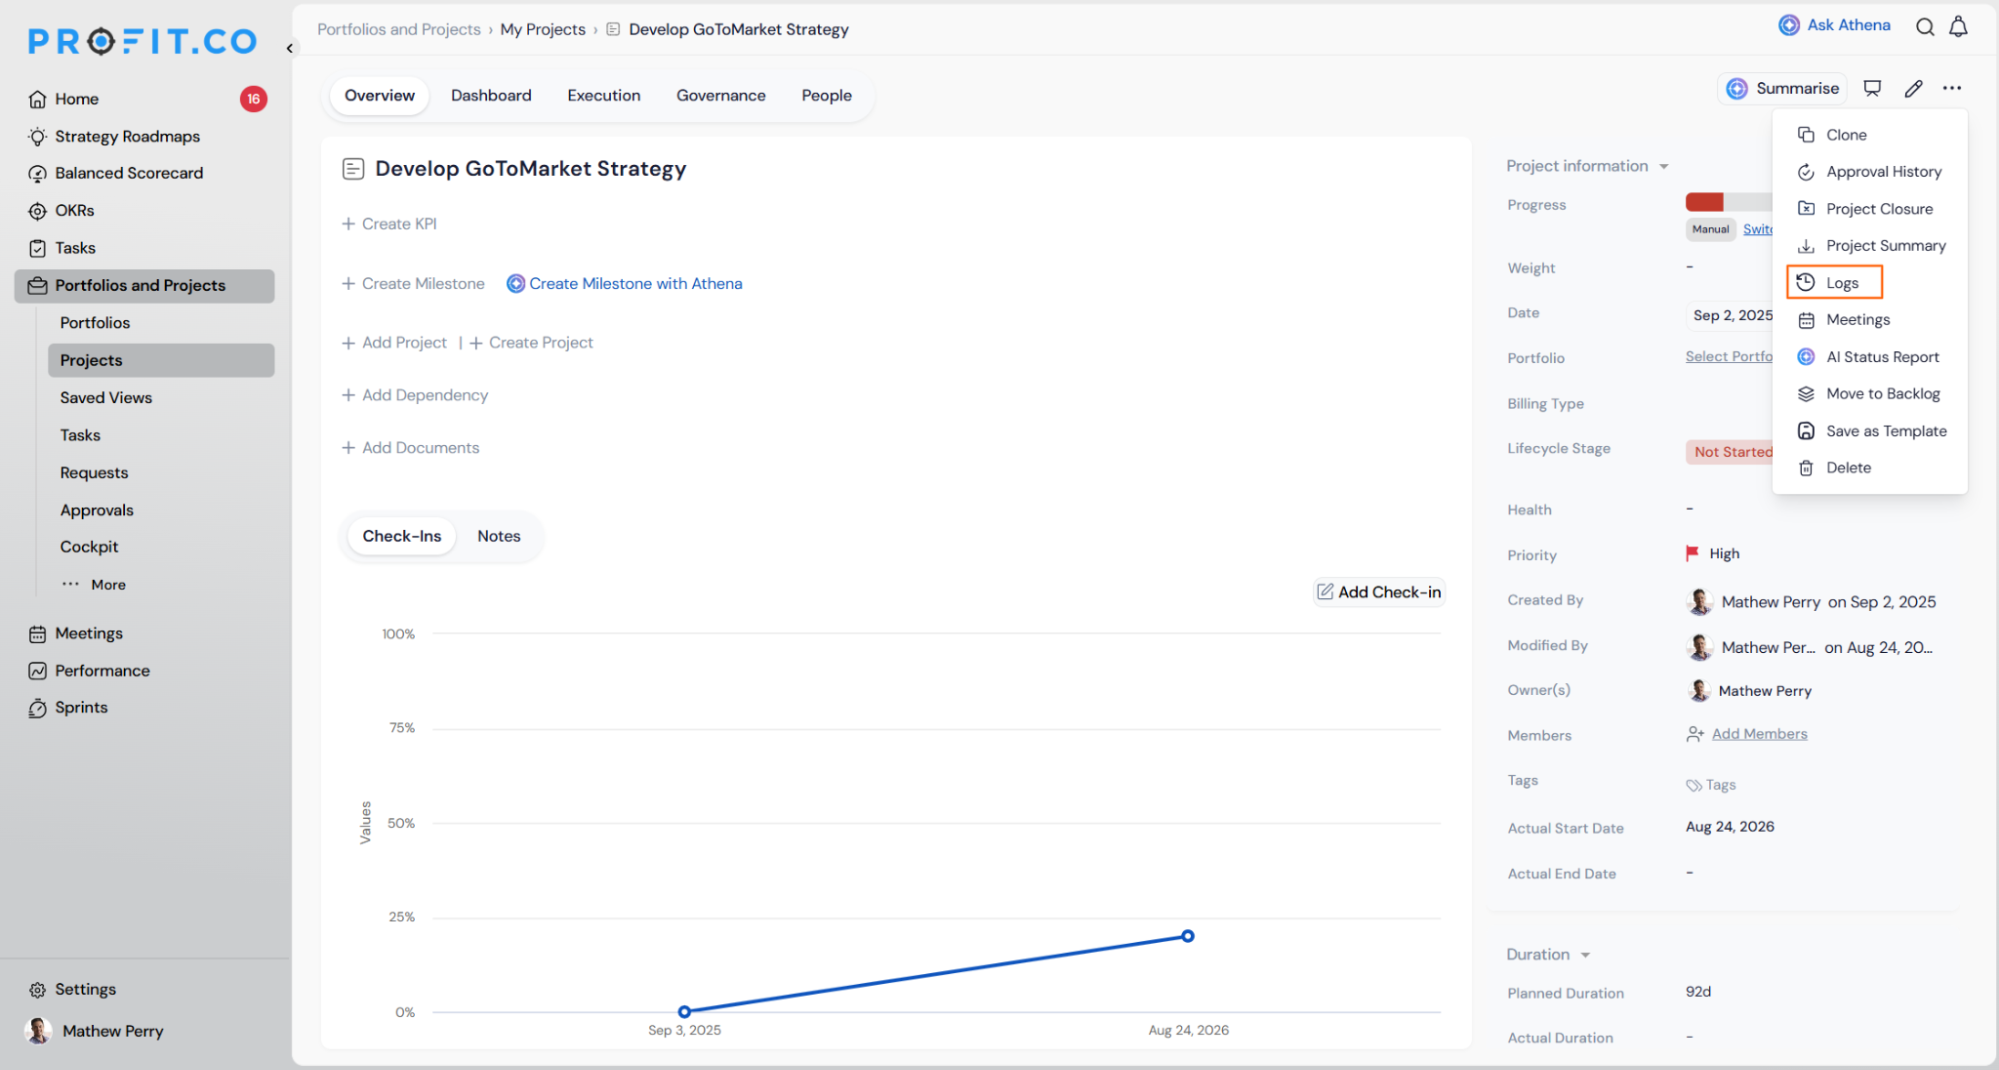
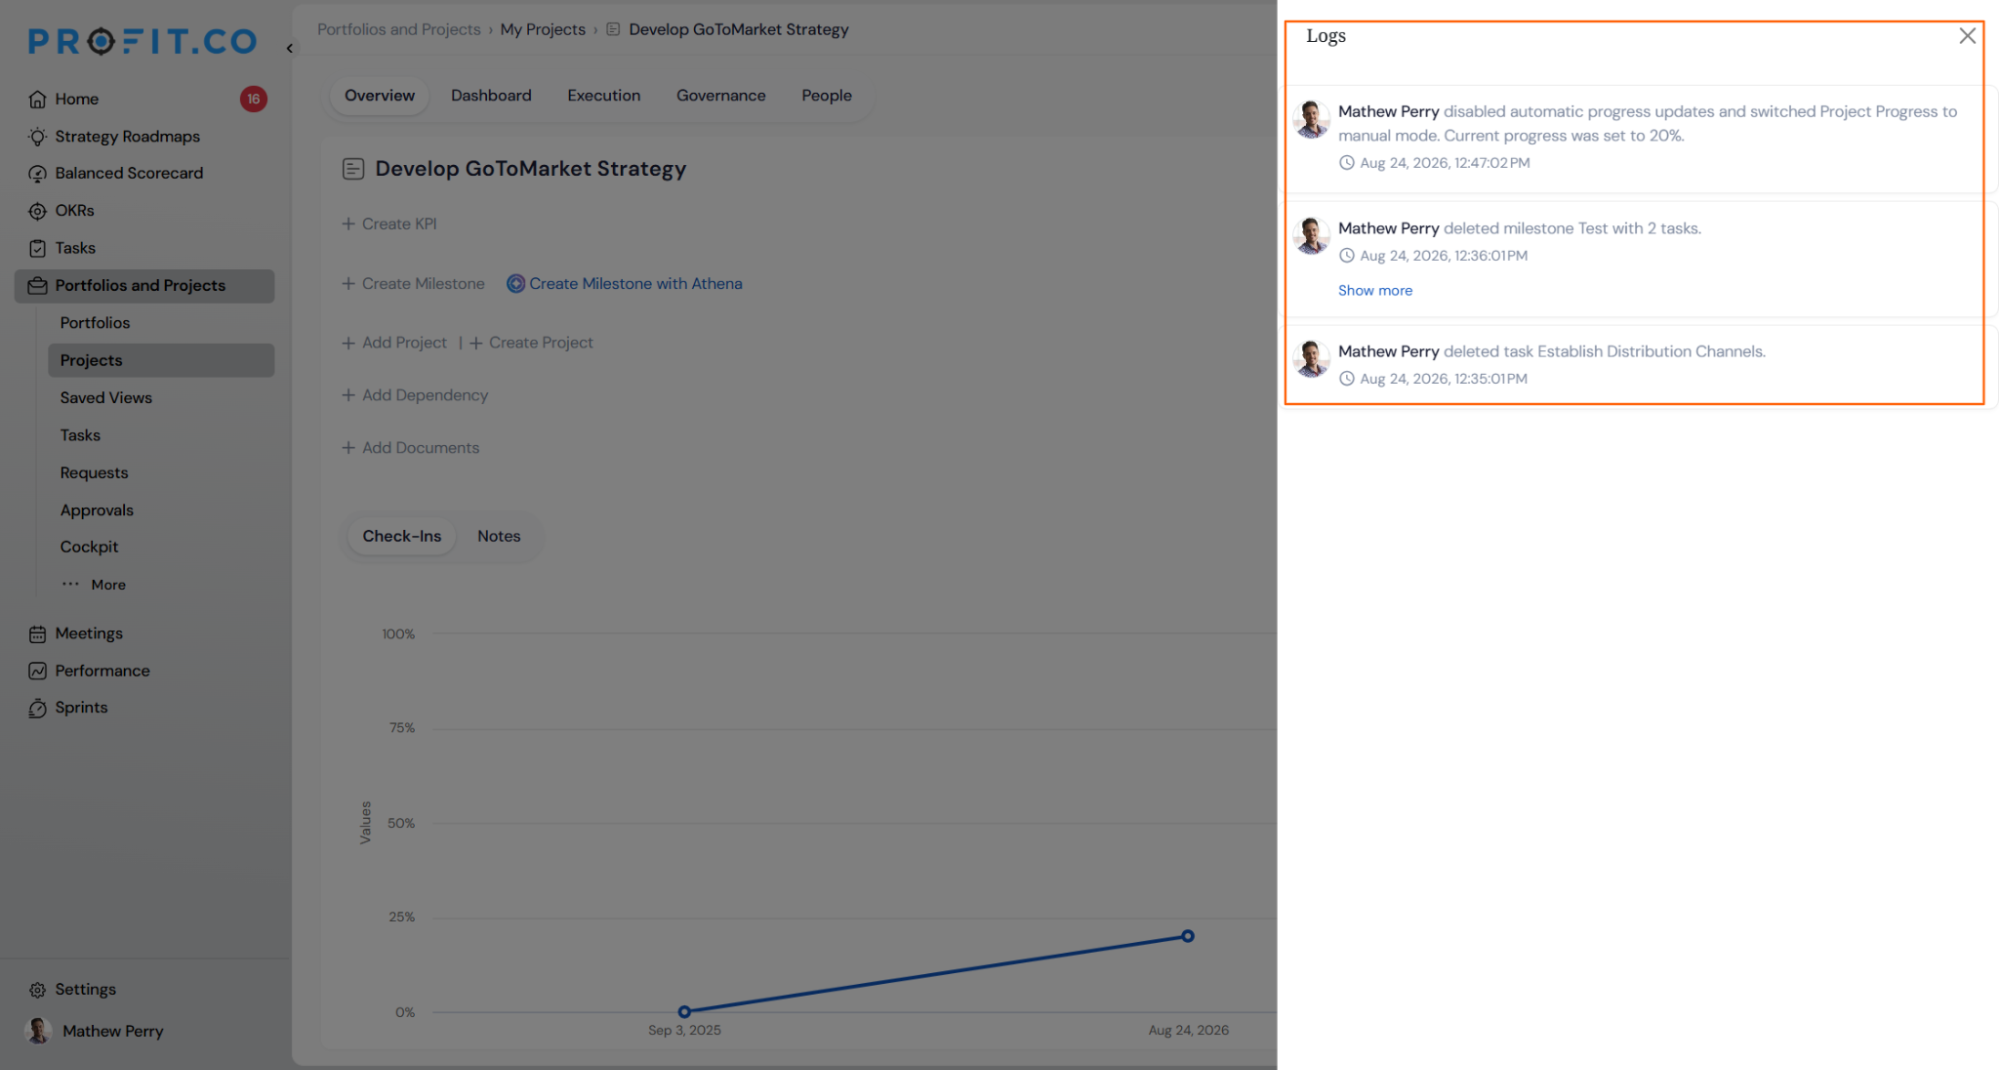
- The Logs panel opens on the right side of the screen, showing a chronological list of all changes made to the project
- Each log entry shows the name of the person who made the change, what was changed, and the date and time it happened
- Click Show more on any entry to see additional detail about that specific change
Why It Matters
- Full change history in one place: Anyone on the team can look up exactly what was changed and by whom, without relying on memory or chasing colleagues for answers.
- Faster issue resolution: When something looks off in a project, the log makes it easy to trace back to the change that caused it and who made it.
- Accountability across teams: Having a clear record of edits and deletions keeps project activity transparent, especially on projects with multiple contributors.
10. Email Notifications for PPM and Task Action Center Events
Overview
Email notifications are now available for all Action Center events across the PPM and Task modules, covering milestones, portfolios, projects, and tasks. When a relevant event occurs, such as an assignment, a due date change, a deletion, or an approval decision, the right person receives an email automatically. Super users can configure each notification type individually, controlling who receives it and what the message says, directly from the Notifications settings.
How It Works
- Navigate to Settings → General → Notifications → Action Center
- Select the Portfolios and Projects tab or the Tasks tab to view the available notification types for each module
- Notification types are grouped by entity, such as Milestone, Portfolio, and Project, with each group listing its individual events
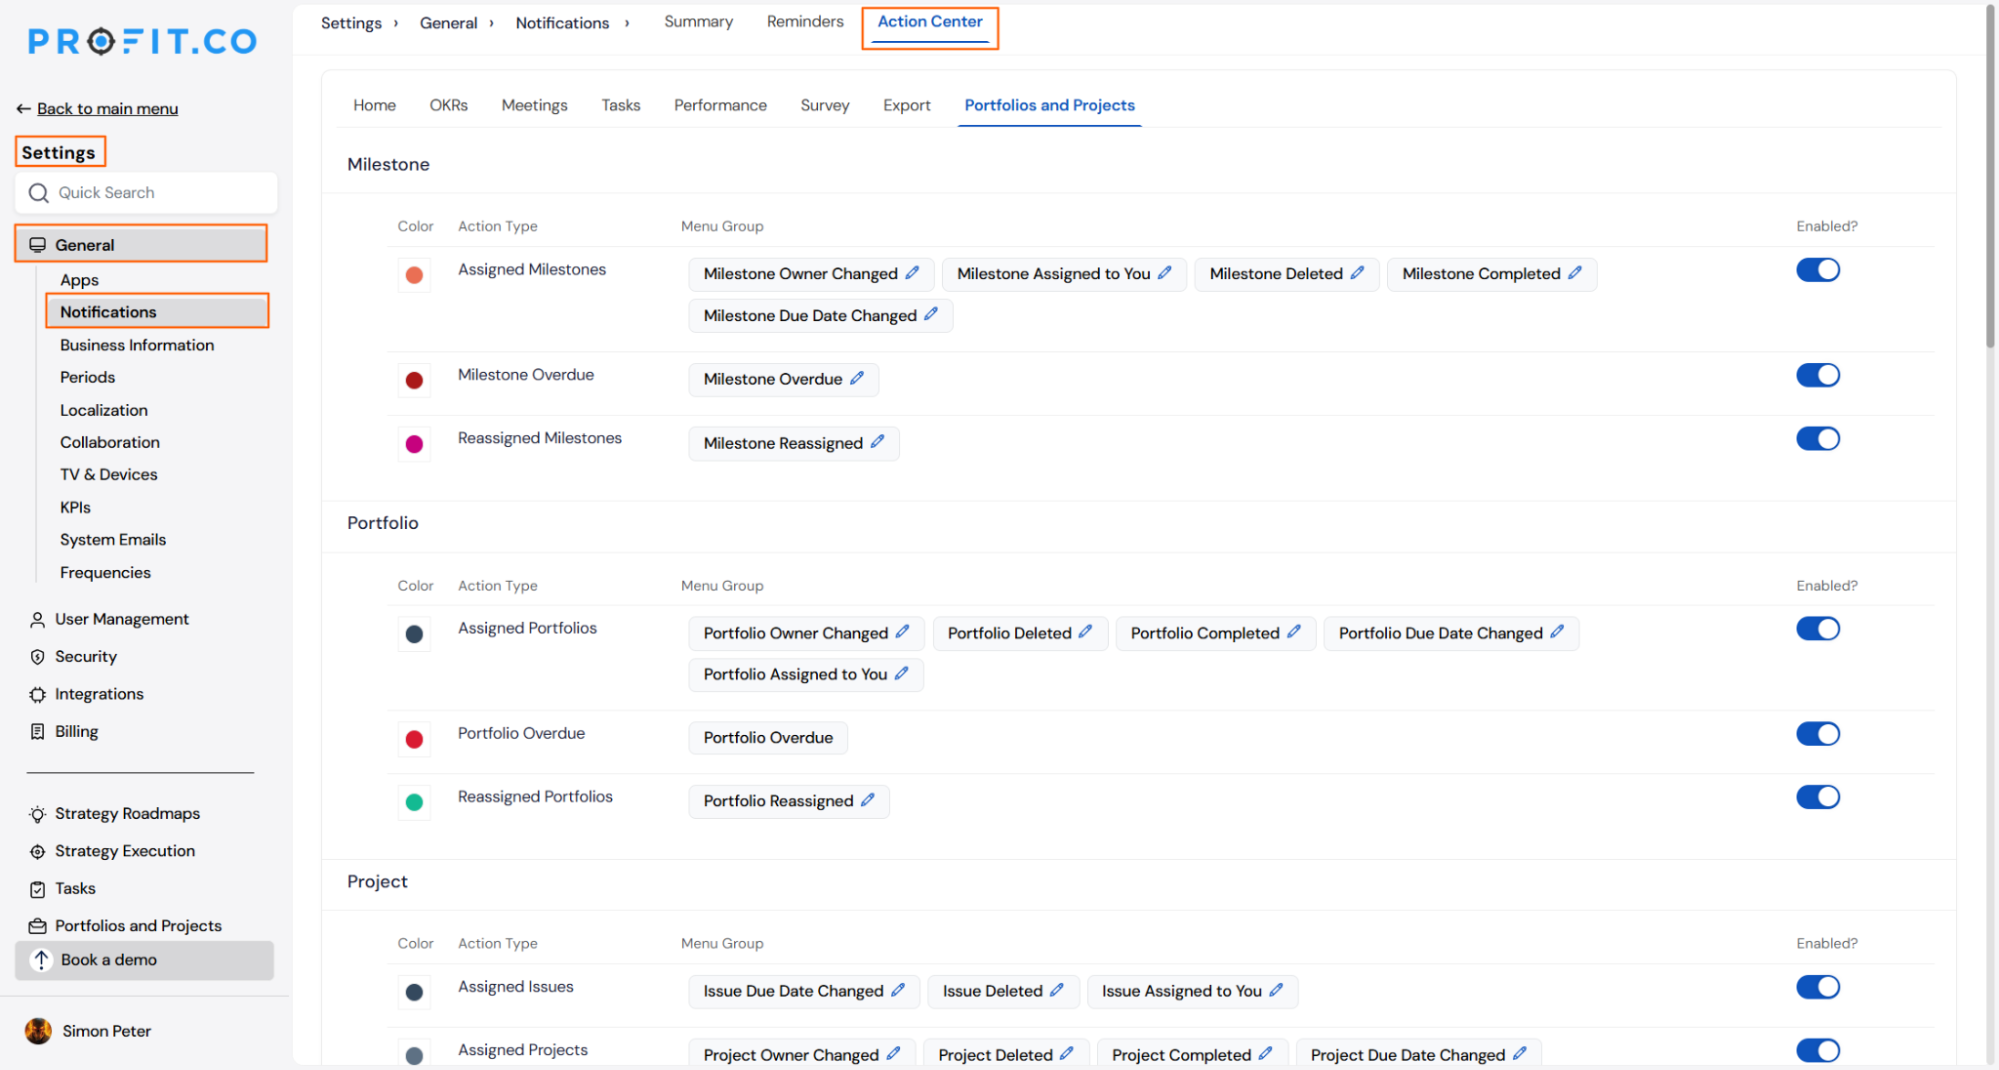
- Use the Enabled toggle on each action type to turn notifications on or off
- Click the edit icon on any event tile to customise the recipient, subject line, and message body for that notification
- Notifications are sent automatically when the triggering event occurs, such as an item being assigned, reassigned, completed, deleted, or moved to overdue
- Approval- related notifications route the request to the approver and send the approval or rejection decision back to the person who submitted it
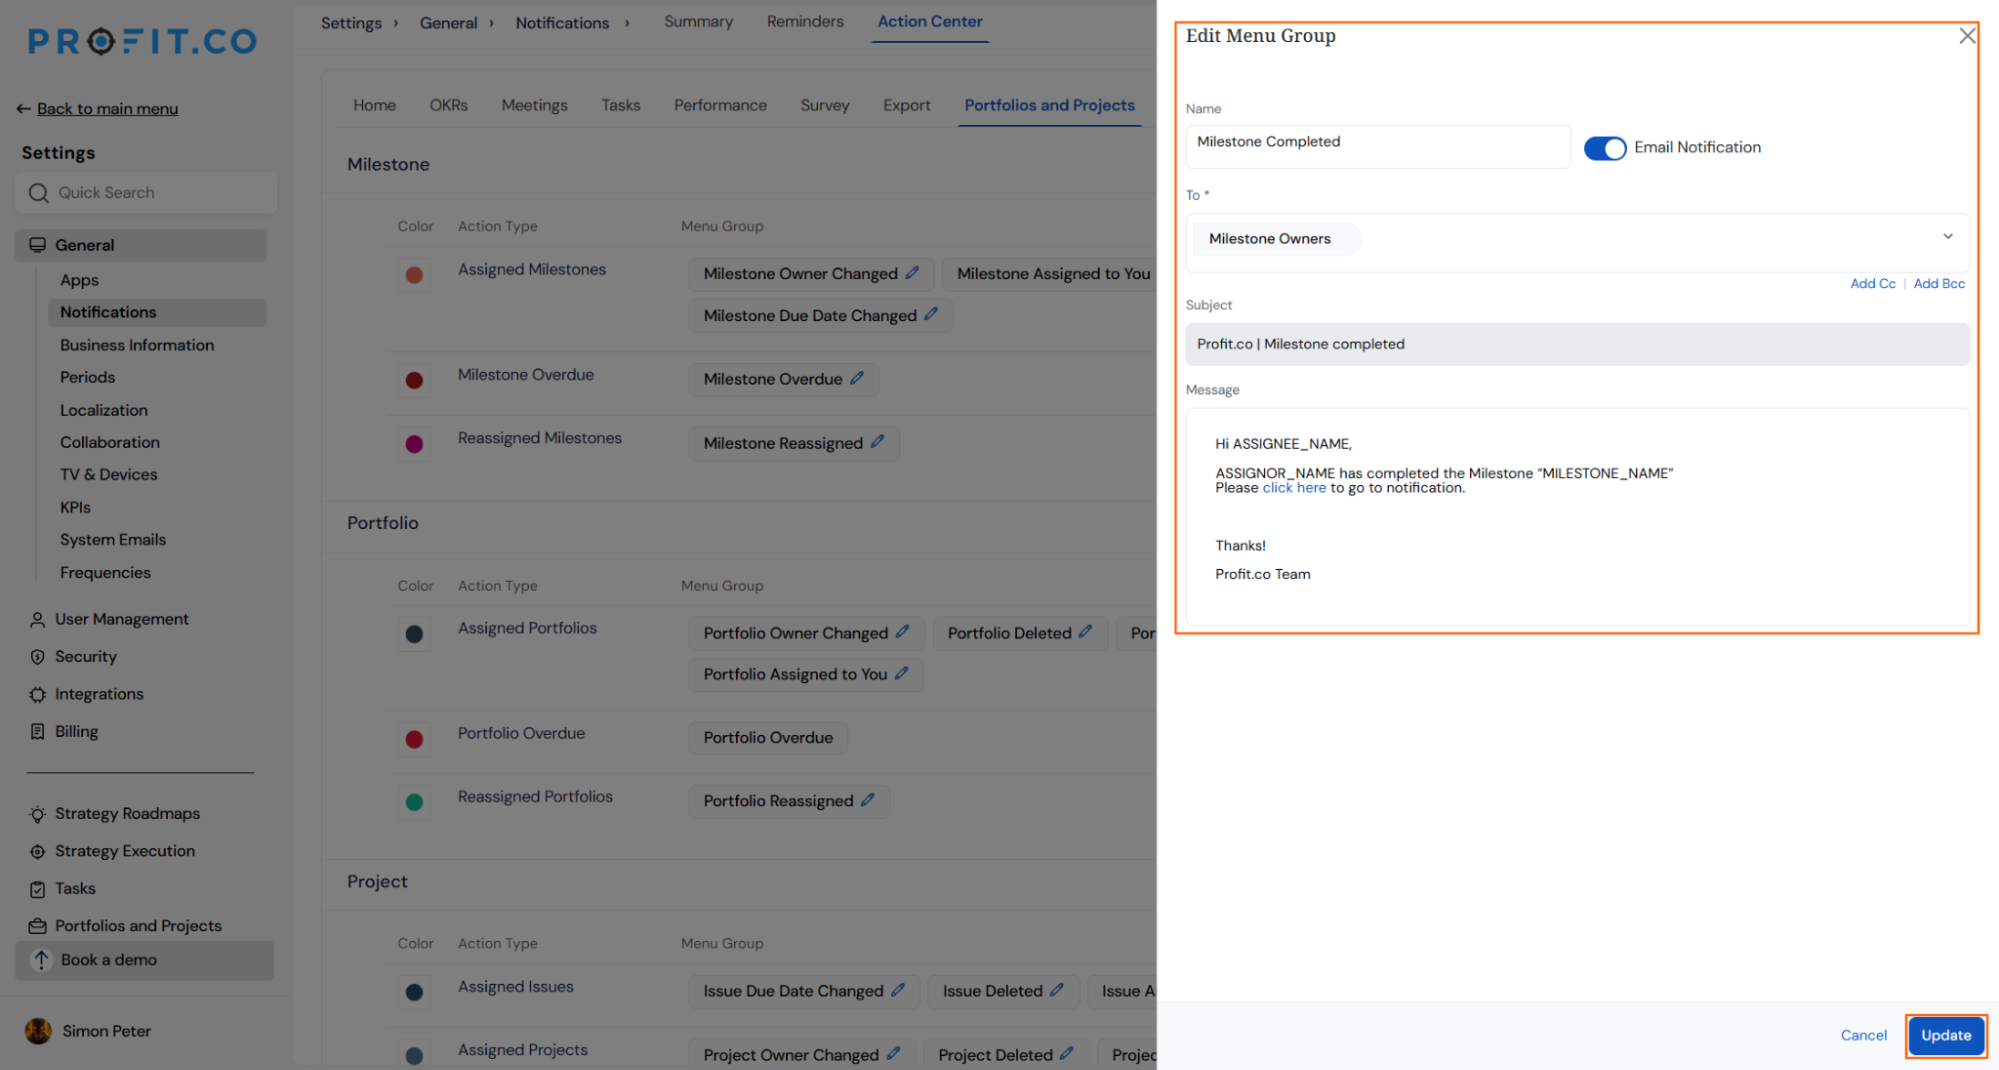
Why It Matters
- Right people are notified automatically: Team members, owners, and approvers receive timely emails for the events that matter to them, without anyone needing to manually follow up.
- Full control for super users: Each notification type can be enabled or disabled independently, and the recipient, subject, and message can be tailored to match how the organisation communicates.
- Approval flows keep moving: Approval requests and decisions are routed automatically to the correct person at each step, reducing delays caused by missed actions.
PERFORMANCE (Performance, Goals, Development Plans, Recognition, Survey)
1. Threshold-Based Rating Derivation for Reviews
Overview
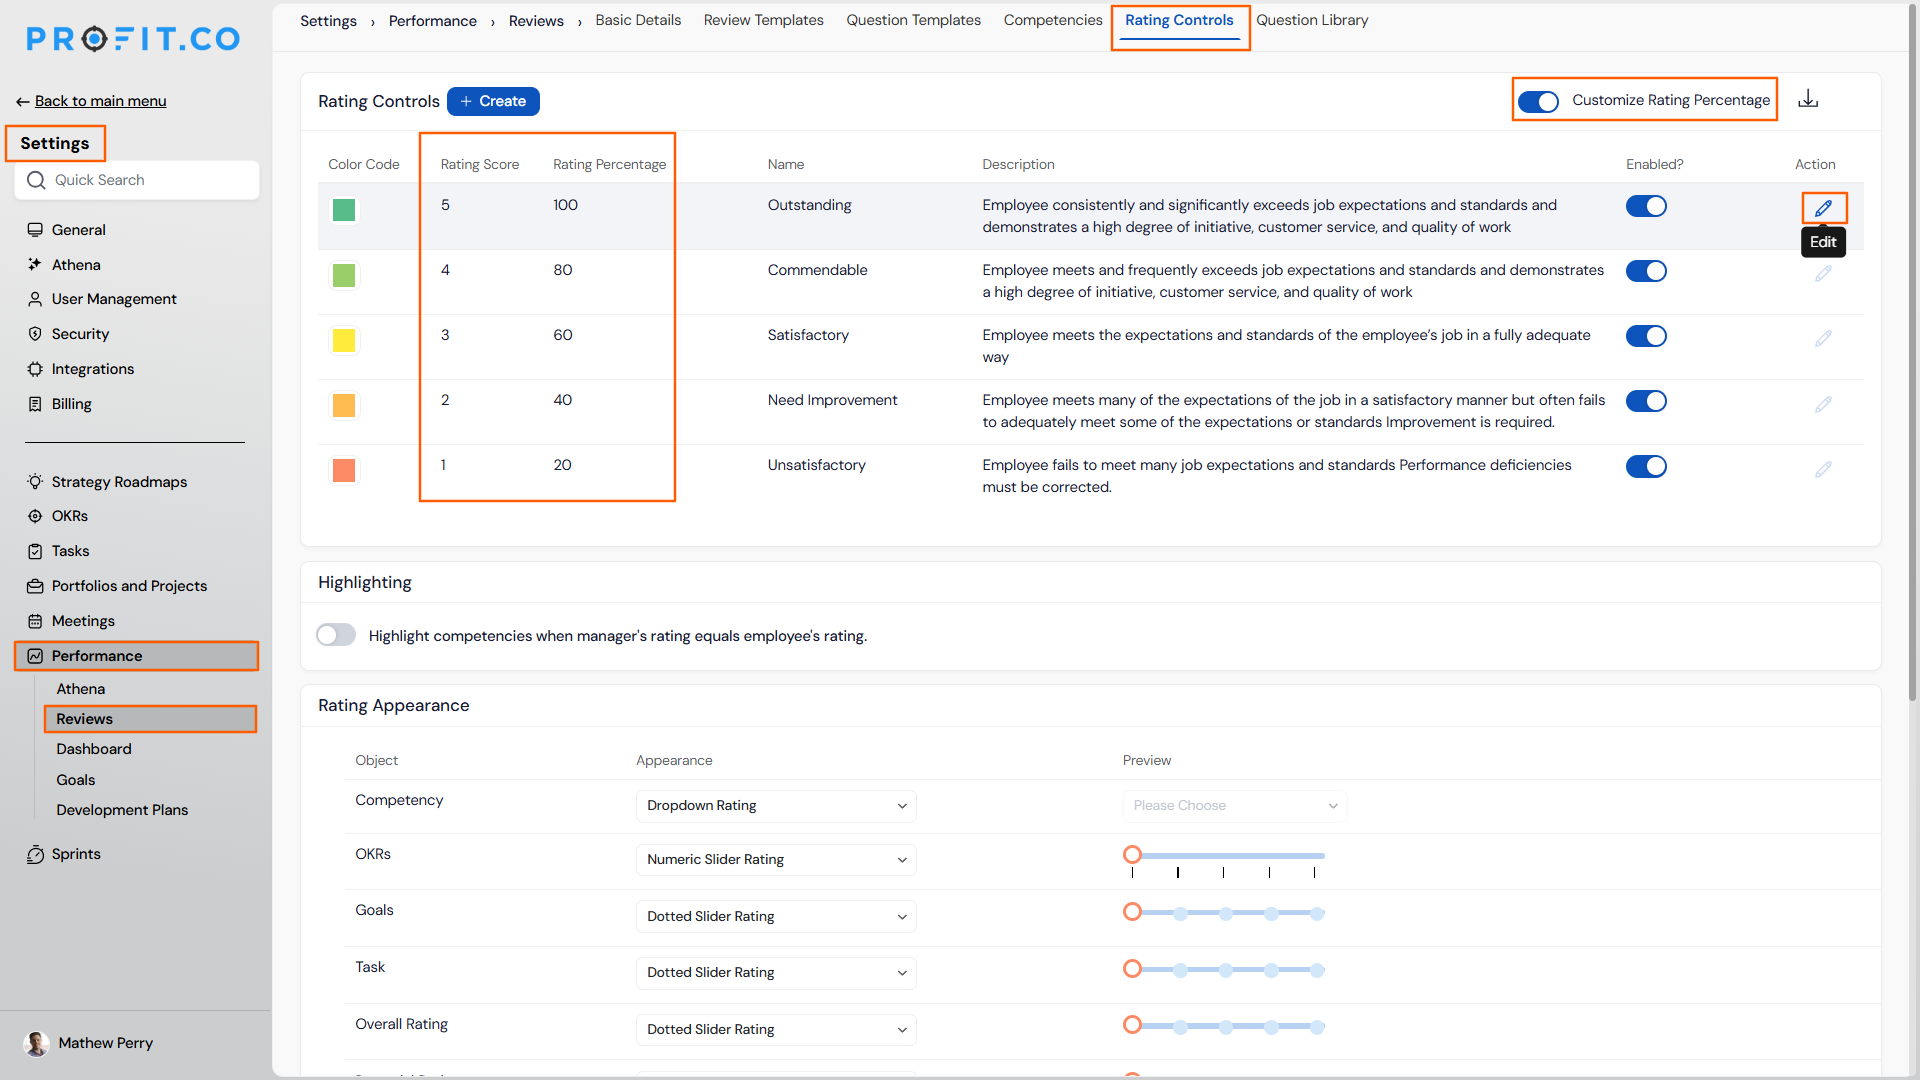
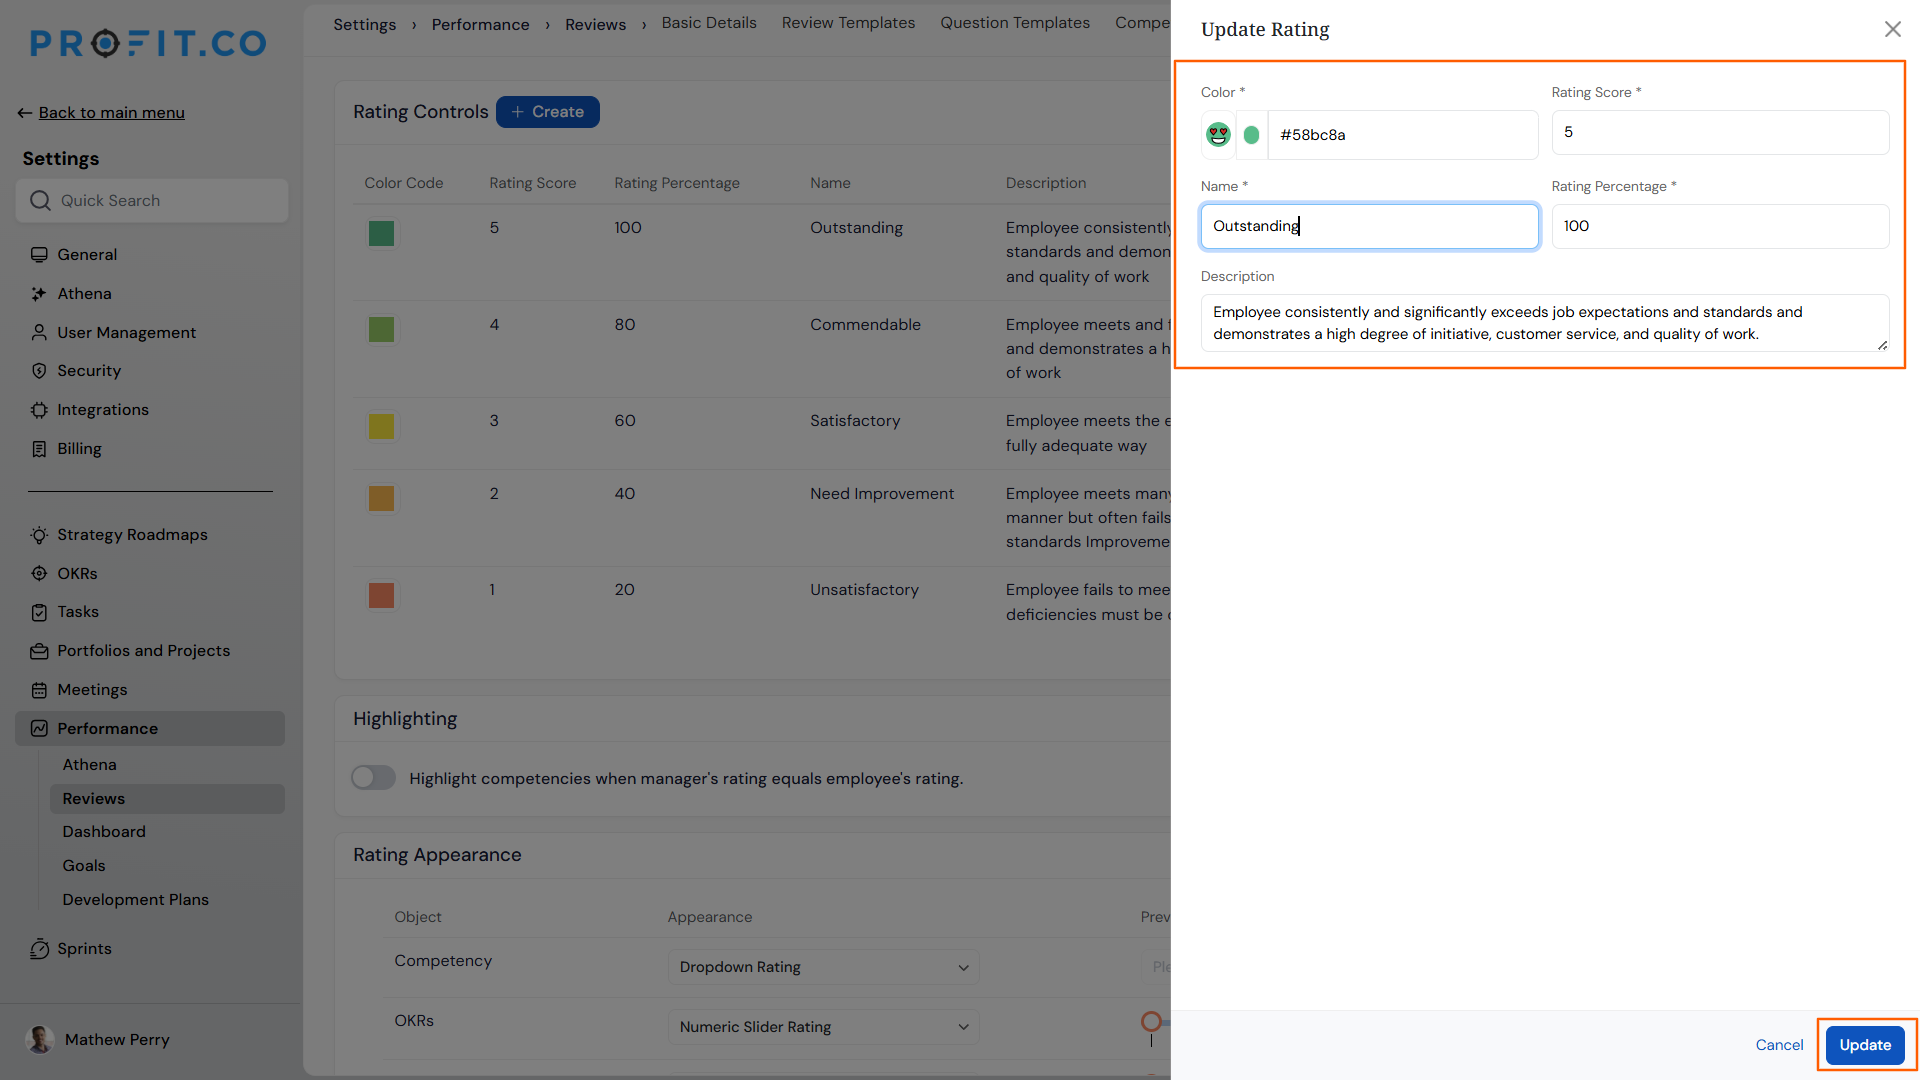
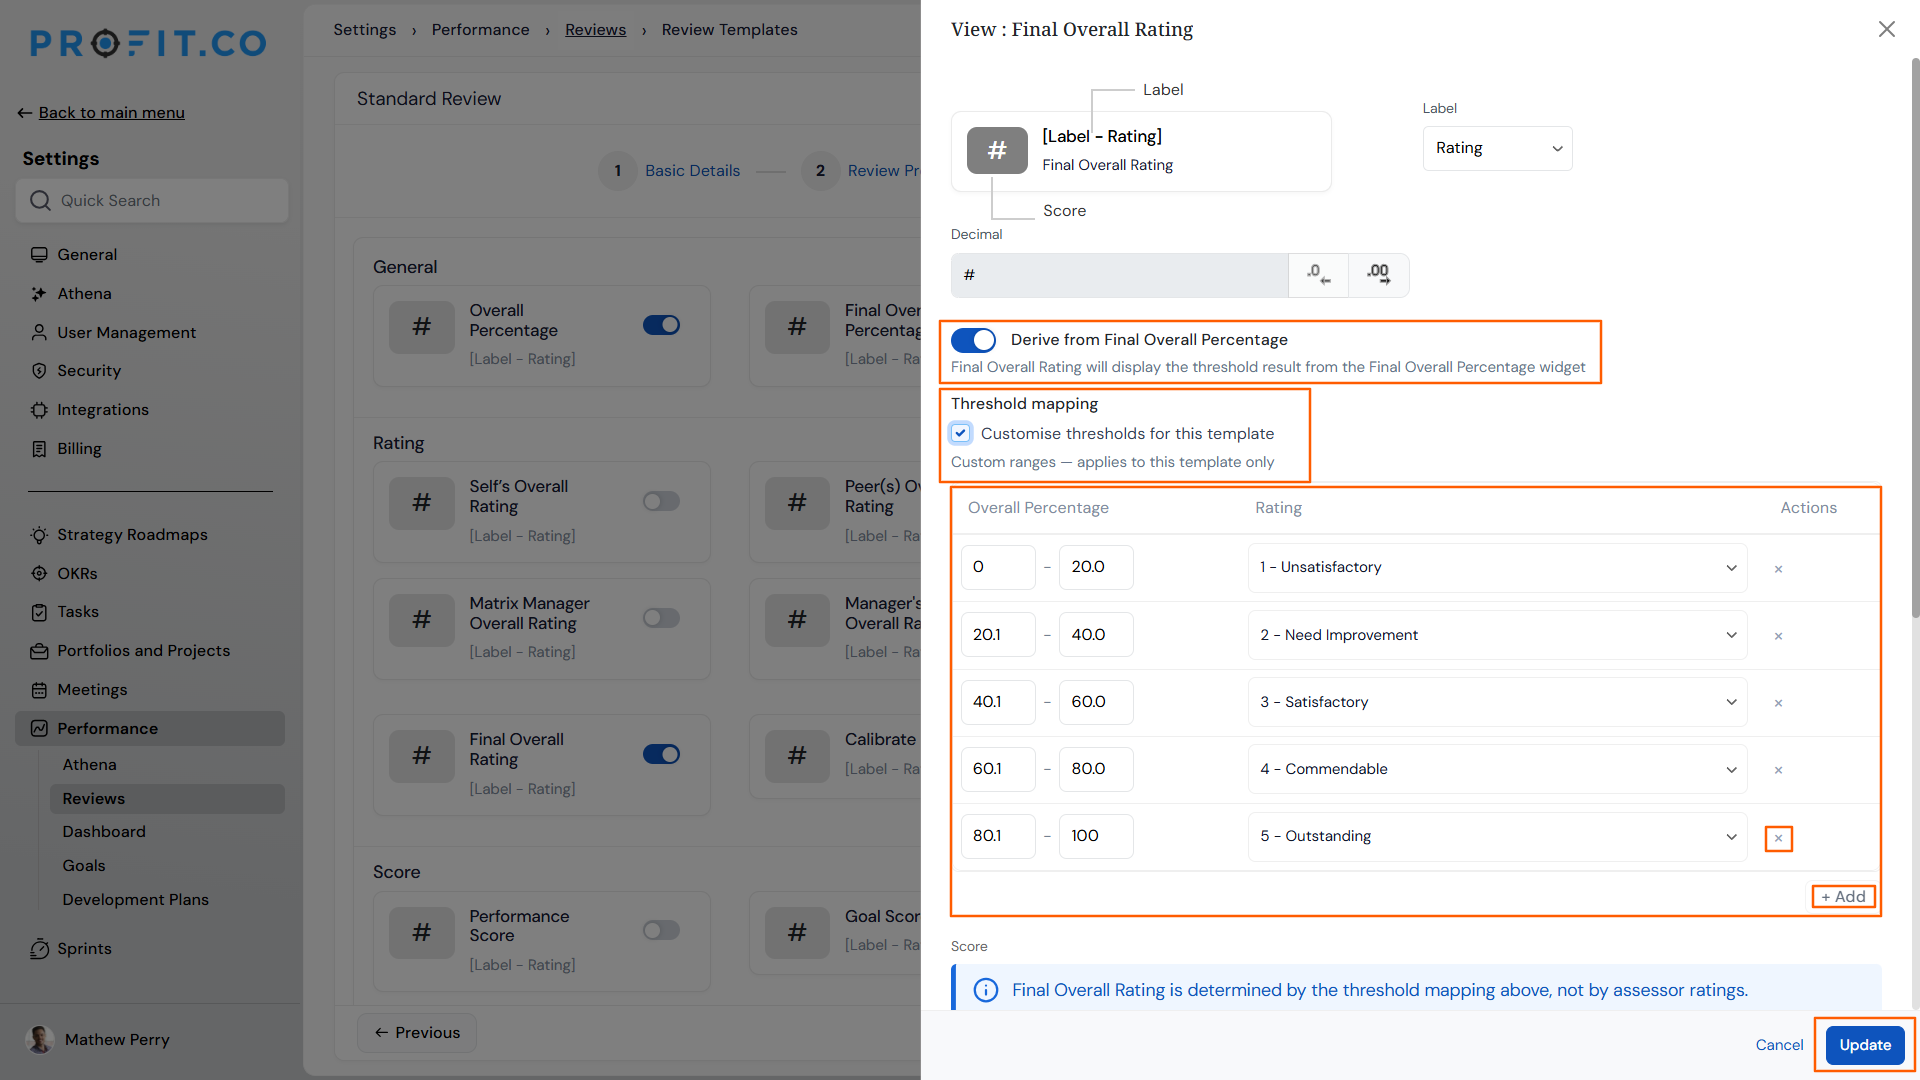
When a review is completed in Profit.co, the system calculates a final overall percentage for each employee. Administrators can now configure threshold ranges that map these percentages to a rating – so a score falling in the 0–20% range displays as Rating 1, a score in the 21–40% range displays as Rating 2, and so on. This mapping can be applied globally across all review templates, or customised individually per template to suit different evaluation frameworks.
How It Works
To configure thresholds globally (applies to all templates):
- Navigate to Settings → Performance → Reviews → Rating Controls.
- Define threshold percentage ranges and assign a rating value to each range (e.g., 0–20% = Rating 1, 21–40% = Rating 2).
- Save the configuration – the defined thresholds apply automatically across all review templates.
To customise thresholds for a specific template:
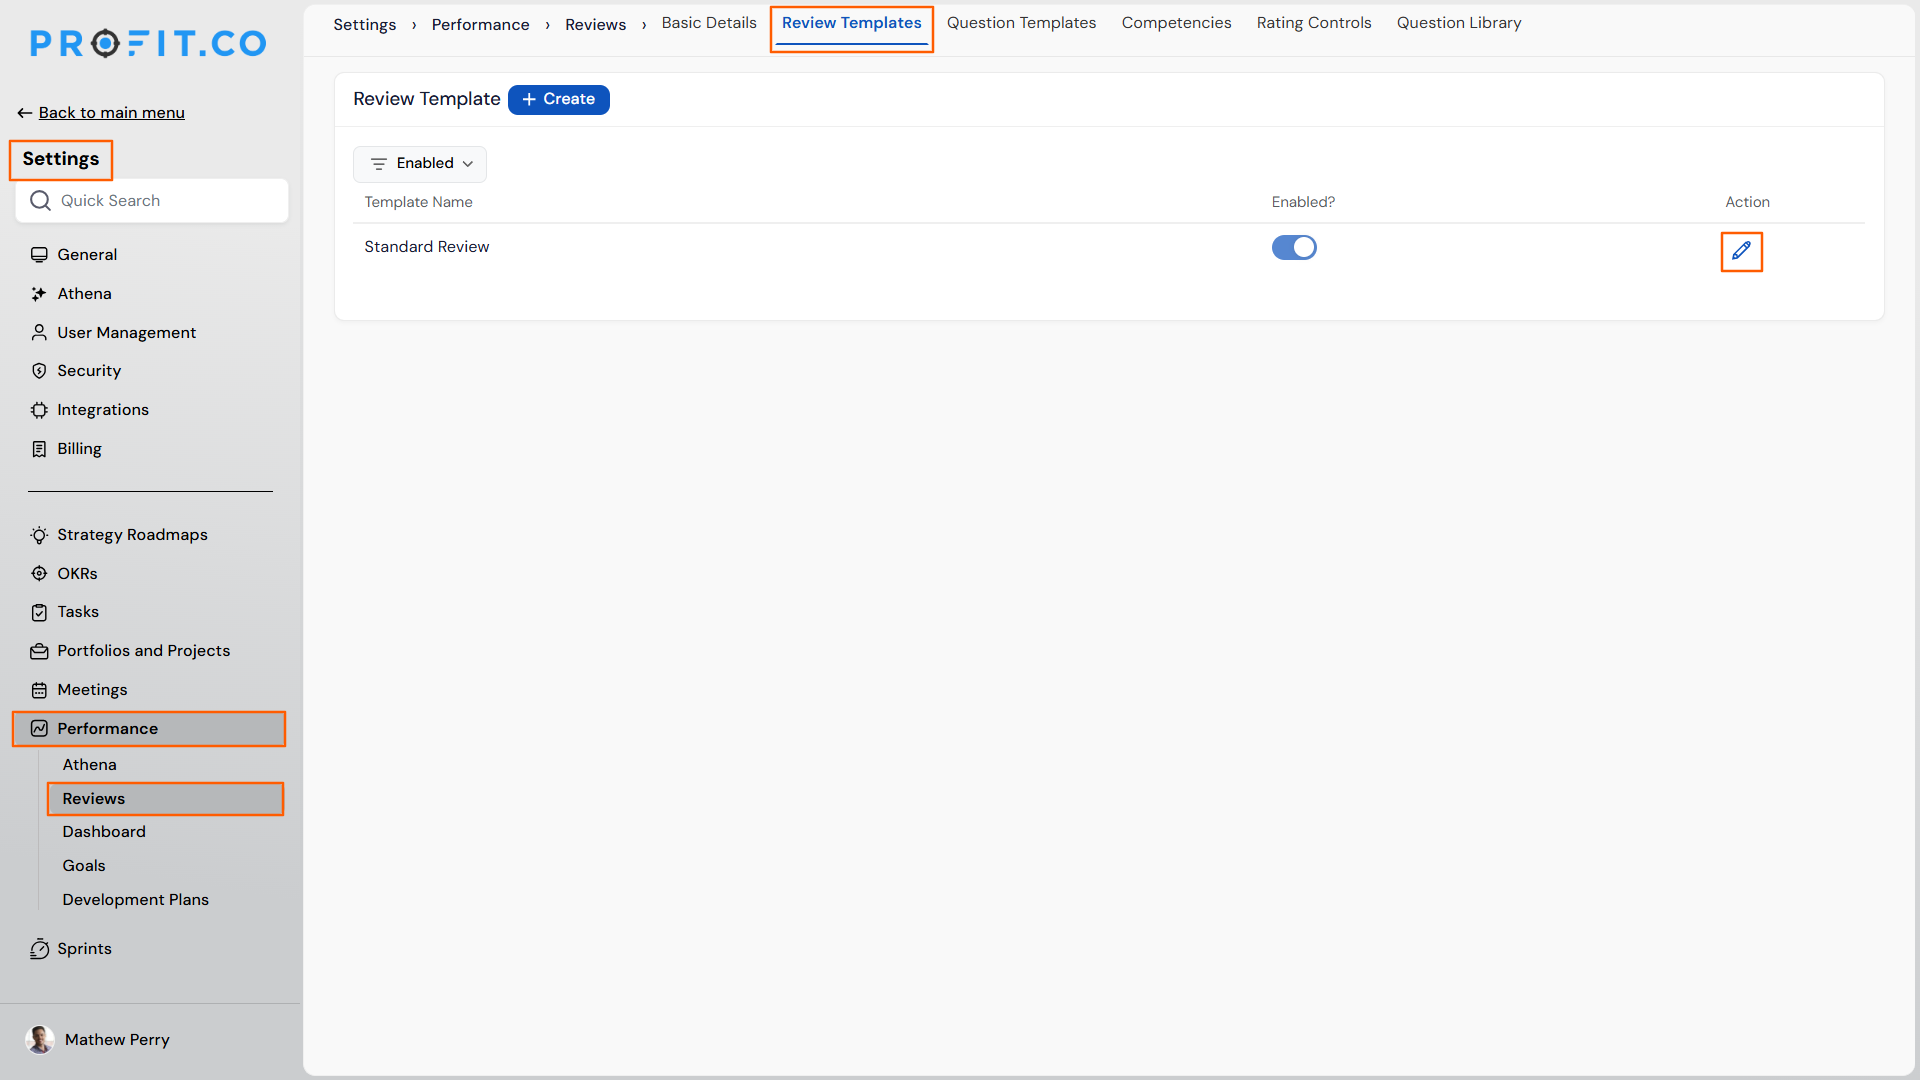
- Navigate to Settings → Reviews and open the required review template for editing.
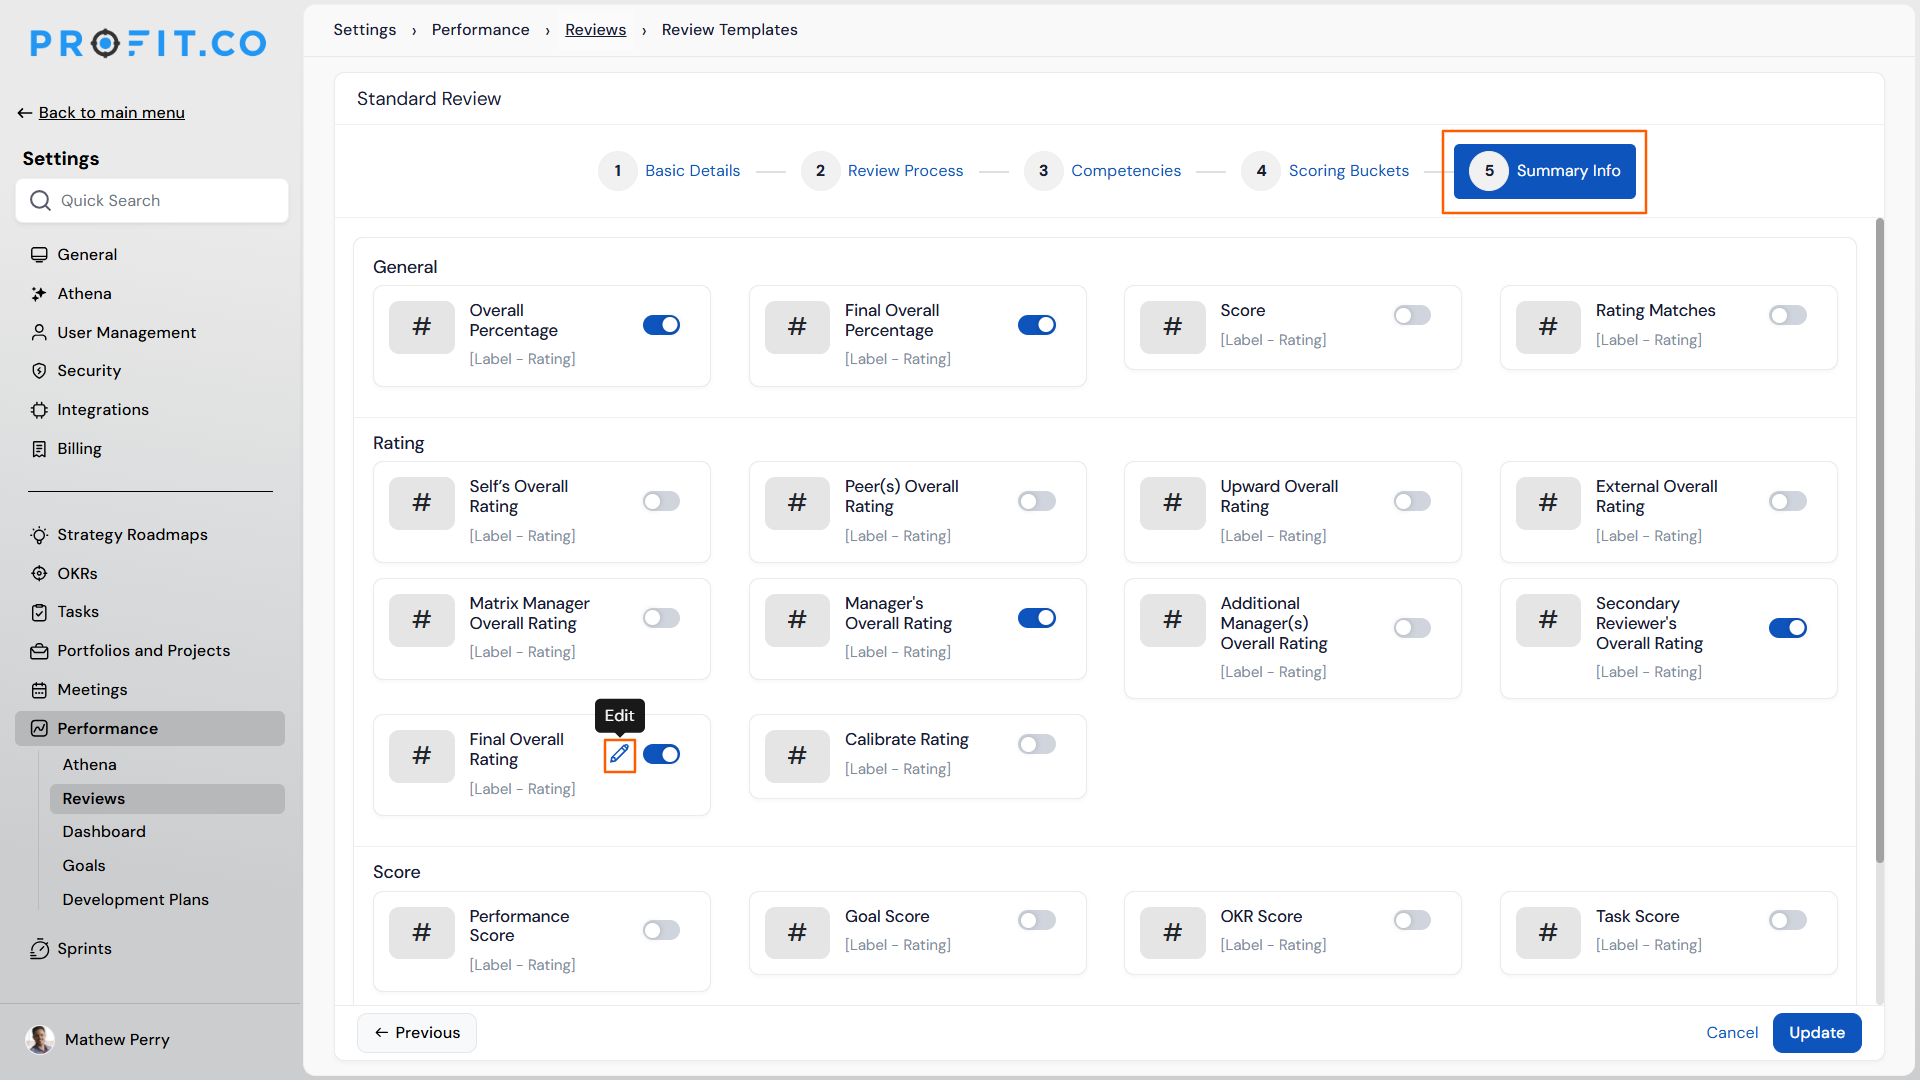
- Go to Summary Info and click Edit on the Final Overall Rating field.
- Enable the Derive from Final Overall Percentage toggle.
- Check Customise thresholds for this template to override the global configuration.
- Add, remove, or edit threshold ranges and their corresponding rating values as needed, then save.
Why It Matters
- Automatic rating assignment: Final ratings are derived directly from the calculated percentage score, removing the need for manual interpretation or post- review adjustments by administrators.
- Global- to- template flexibility: Organizations can enforce a consistent rating standard across all templates, or apply tailored threshold ranges for specific roles, teams, or evaluation frameworks – without changing the global configuration.
- Transparent and auditable outcomes: Every rating displayed is tied to a clearly defined percentage range, giving HR administrators a straightforward and traceable basis for each employee's final rating.
2. Bell Curve Support for Non-Calibrated Reviews
Overview
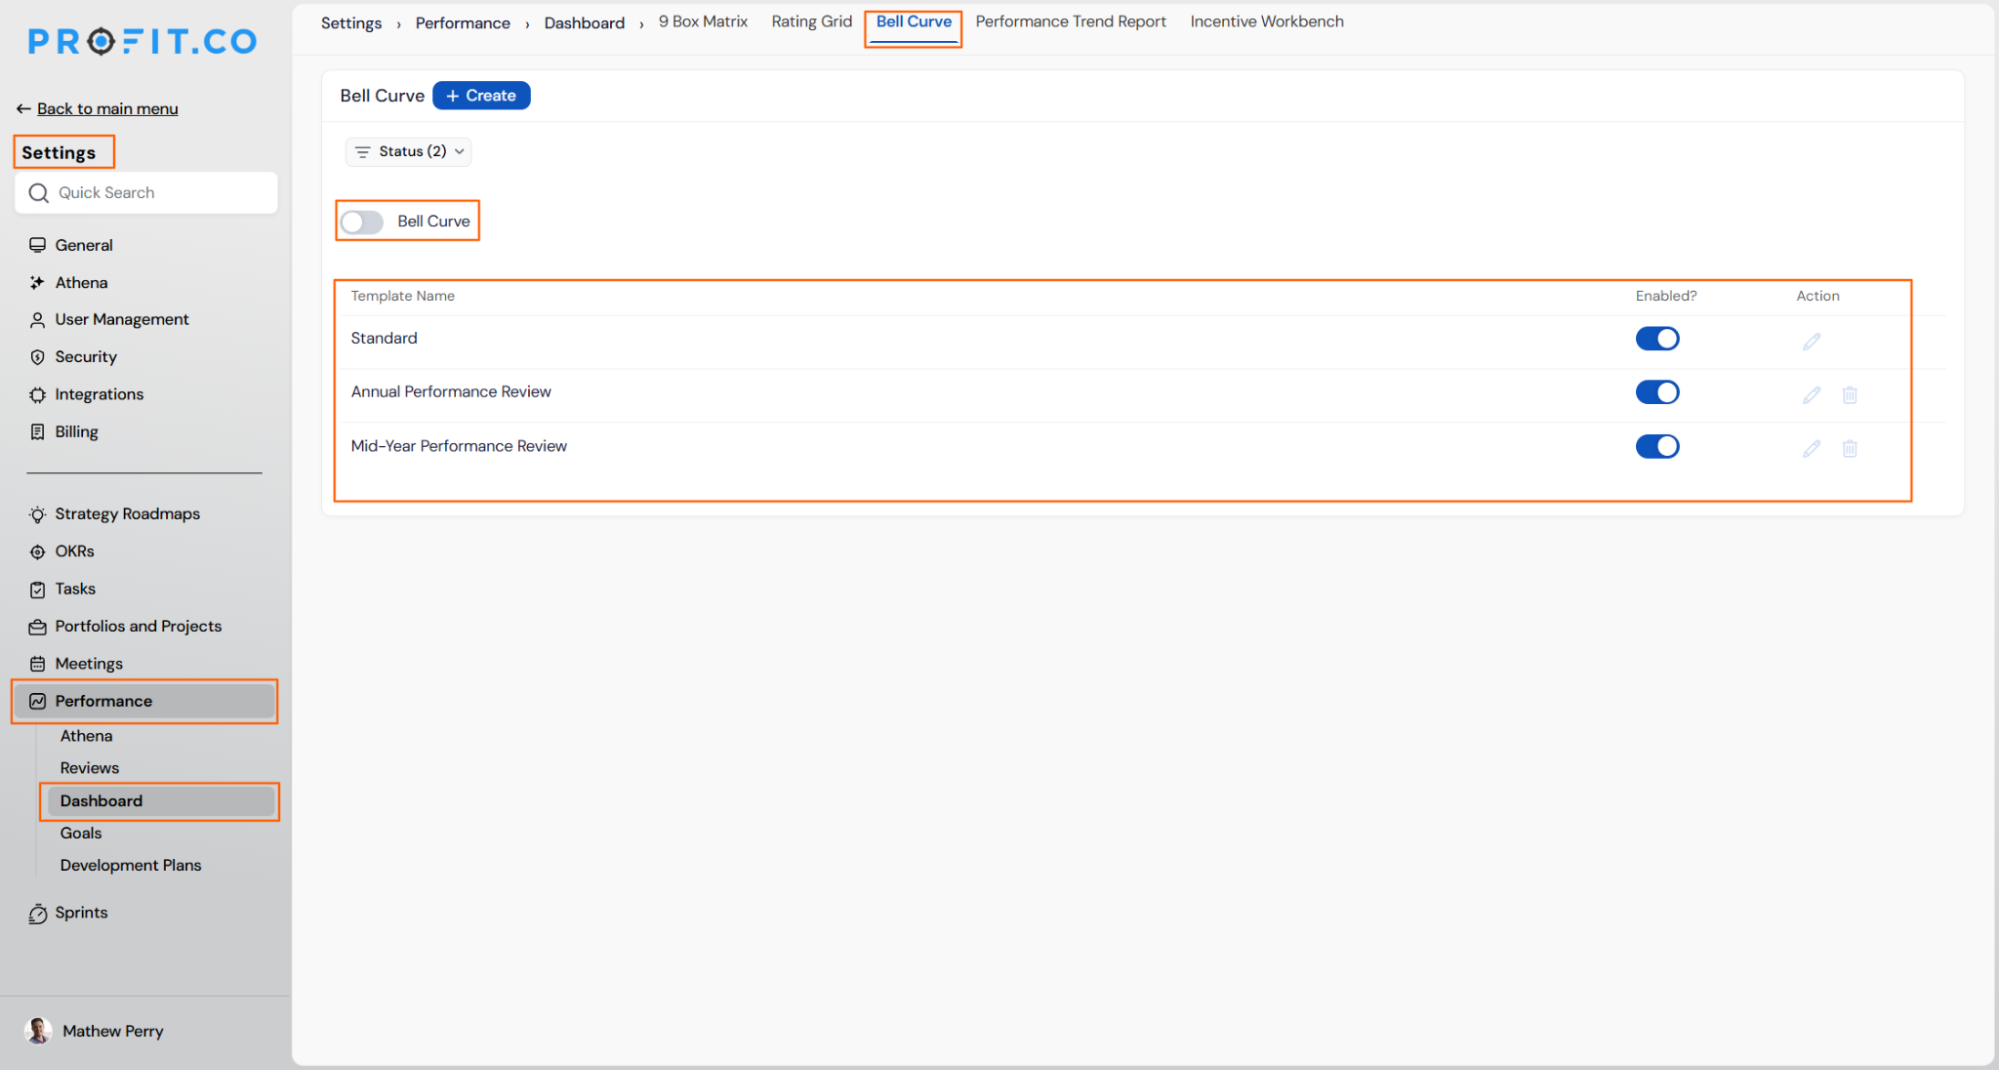
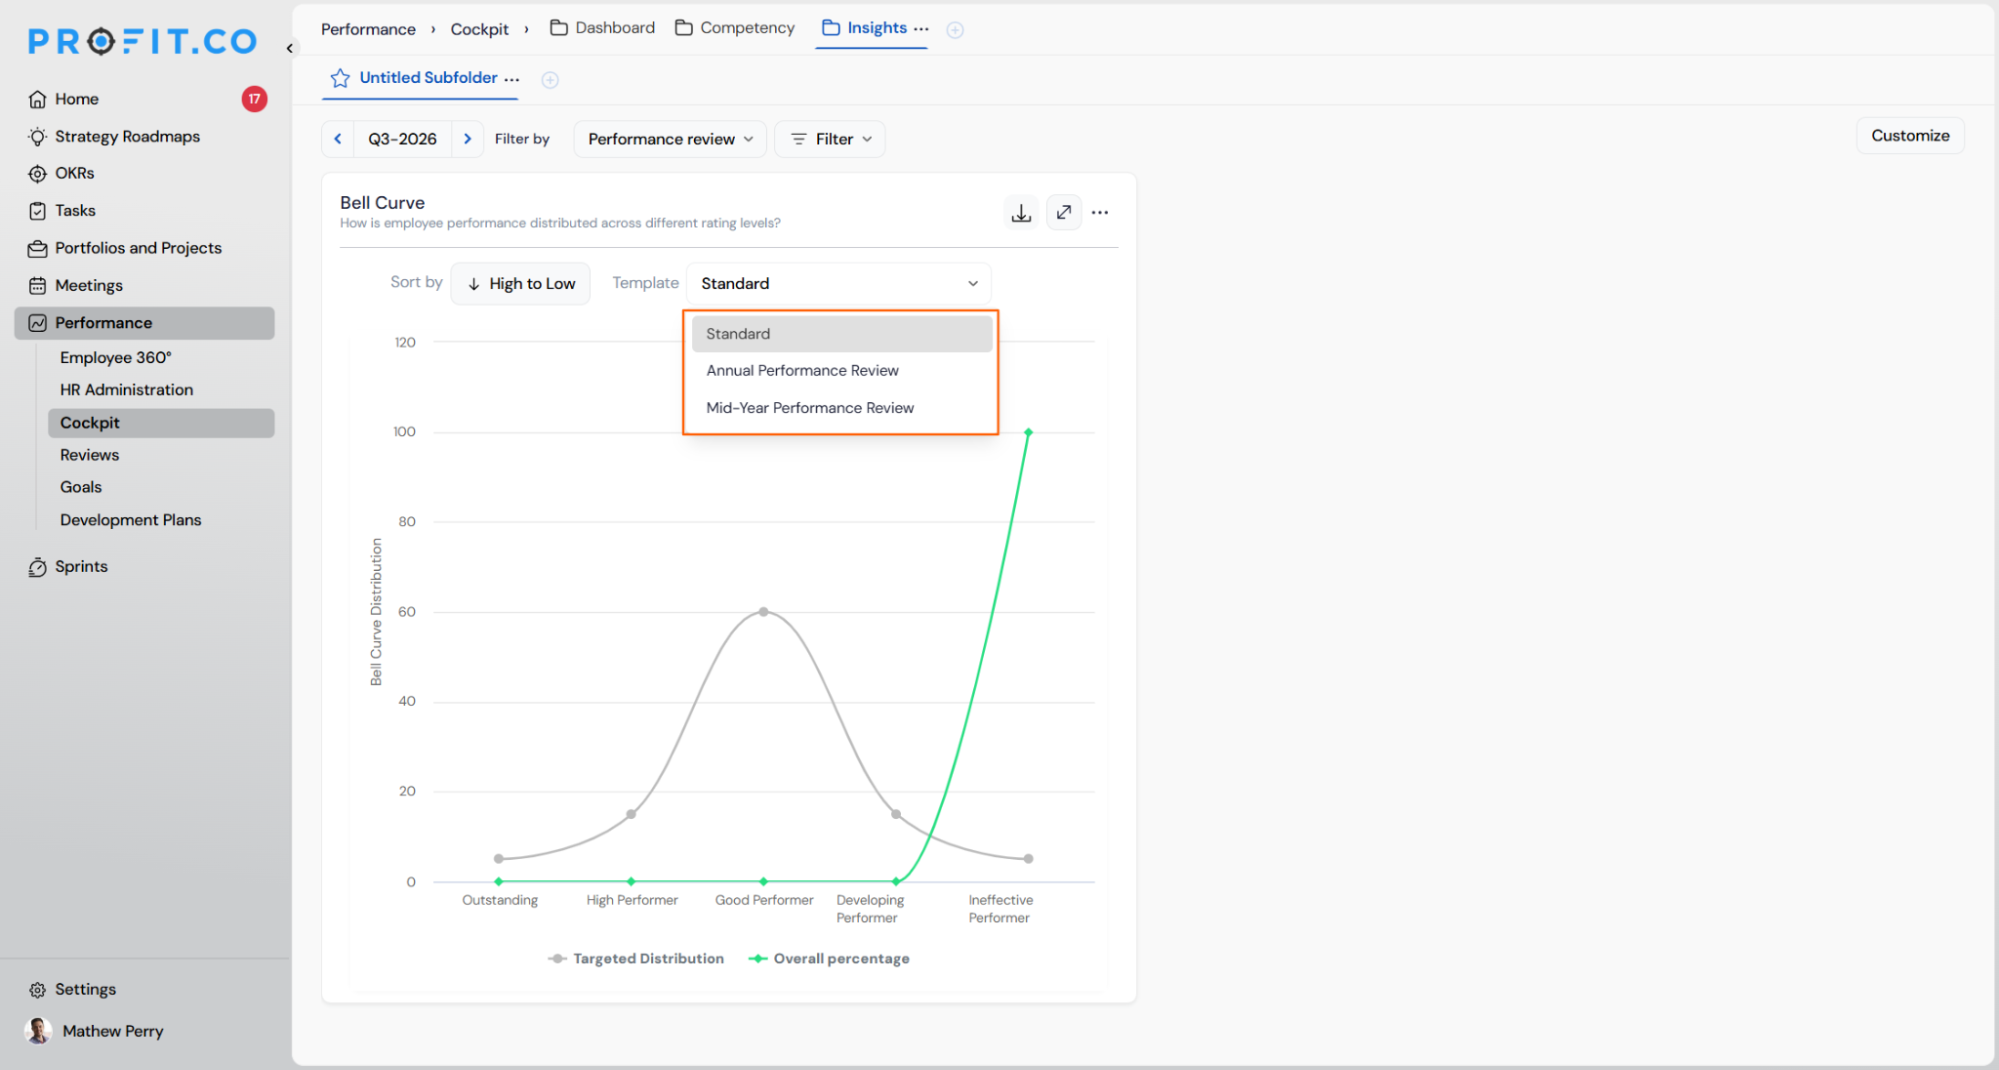
The Bell Curve template list in Settings is now visible even when the Bell Curve toggle is disabled, allowing super users to view and configure templates without changing the global setting. Once the Bell Curve is enabled for a specific template, it becomes available for all non- calibrated reviews associated with that template. Super users and HR admins can also view the Bell Curve chart in the Cockpit for those reviews, independent of the global toggle state.
How It Works
- Navigate to Settings → Performance → Reviews → Bell Curve
- The list of Bell Curve templates is displayed even when the Bell Curve toggle is disabled
- Select the required review template and enable the Bell Curve option for it
- Once enabled, the Bell Curve becomes available for all non- calibrated reviews associated with that template
- Navigate to Performance → Cockpit to view the Bell Curve chart for applicable non- calibrated reviews
Why It Matters
- Template- level control: Super users can enable the Bell Curve for specific templates only, so Organizations apply Bell Curve- based evaluations exactly where needed rather than toggling it on globally.
- Stable global settings during setup: The template list stays accessible while the Bell Curve toggle is off, letting super users configure templates without touching the global setting.
- HR visibility into rating distribution: HR admins can view the Bell Curve chart in the Cockpit for non- calibrated reviews without needing the global toggle enabled, giving them consistent access to distribution data across review types.
3. Excluded Users Panel for Active Review Cycles
Overview
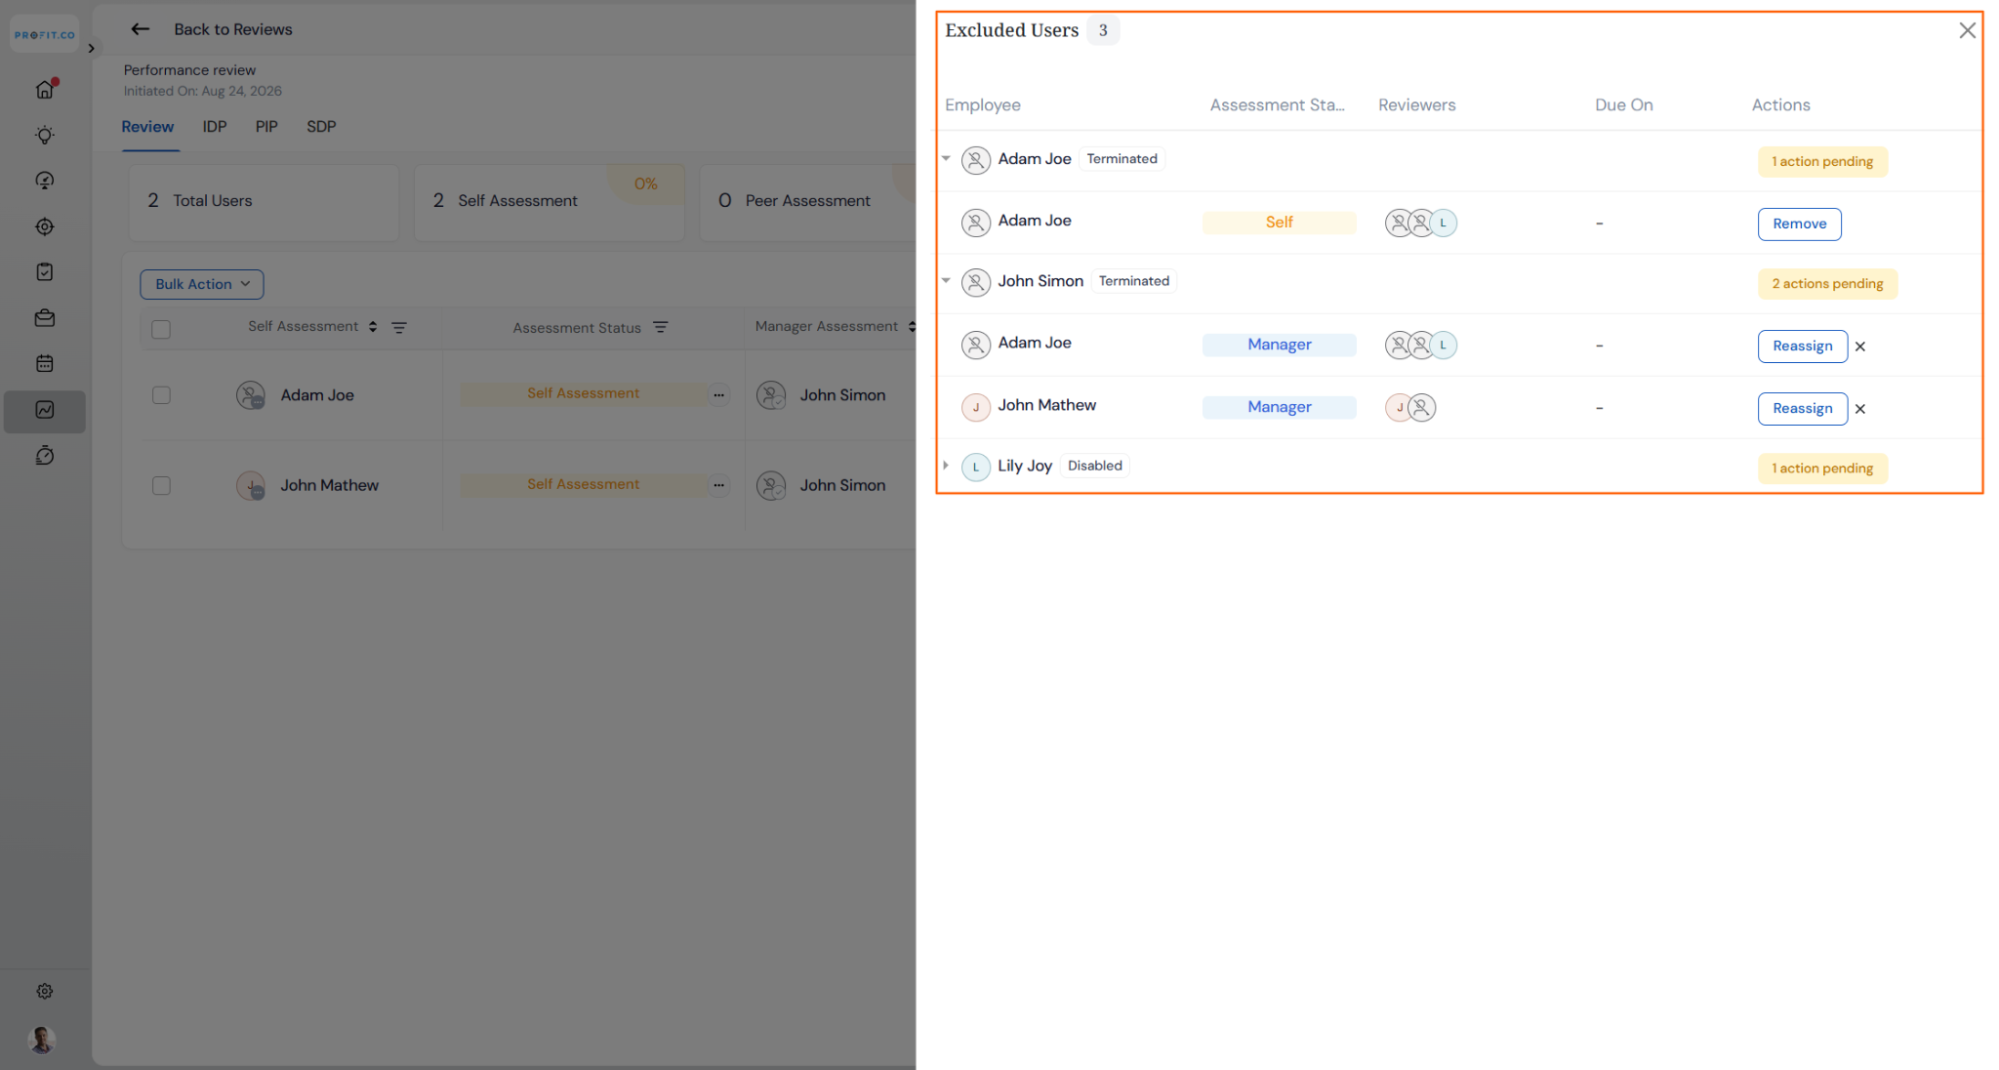
When an employee is terminated or disabled during an active review cycle, Profit.co now automatically identifies all assessment slots they held and surfaces them in a dedicated Excluded Users view. HR admins can see exactly which reviews are affected, grouped by assessment role, and take corrective action by reassigning each slot directly from the cycle admin page. Cycle completion percentages update automatically to reflect only active participants once an employee is excluded.
How It Works
- Navigate to Performance → HR Administration → Reviews → open the relevant review cycle
- Click the ⋮ menu in the top- right corner and select Excluded Users
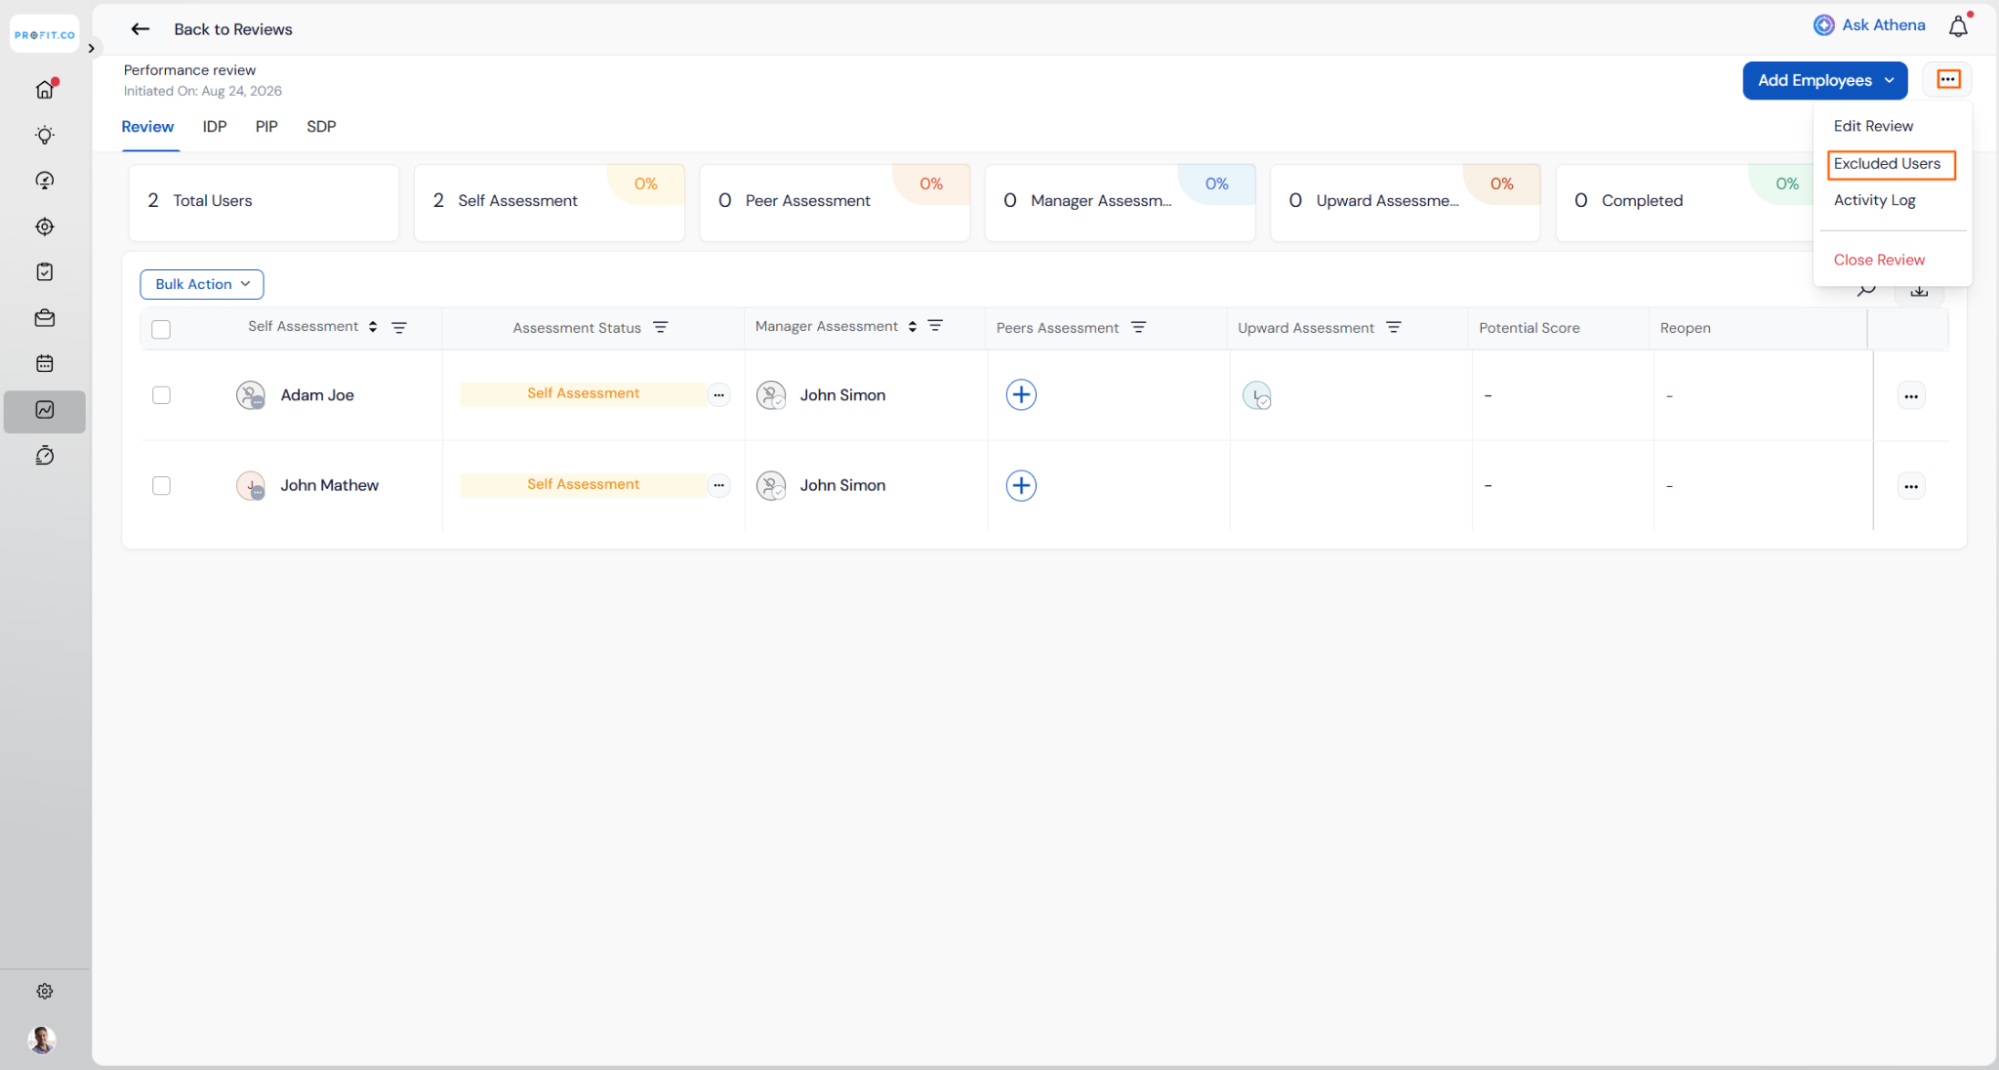
- The Excluded Users view opens, showing affected assessment slots grouped by role type.
- For each affected row, choose the appropriate action:
- Remove to fully remove an excluded employee in the Self Assessment group from the cycle
- Reassign to assign a replacement assessor; the newly assigned person receives an email notification
- Stage completion percentages and pending counts update immediately after each action, without a page refresh
- All Reassign actions are logged in the cycle activity log with the HR admin's name and timestamp
Why It Matters
- No silent cycle blockages: HR admins are immediately alerted when a terminated or disabled employee was acting as a manager or reviewer for others, preventing review cycles from stalling without explanation.
- Role- by- role clarity: The grouped view shows exactly which employees are affected and in what capacity, so HR can prioritise reassignments by role type across the cycle.
- Accurate completion tracking: Once an excluded employee is removed, cycle completion percentages recalculate against active participants only, giving HR a true picture of review progress.
4. Clearer Progress Display in the Review Cycle Summary Bar
Overview
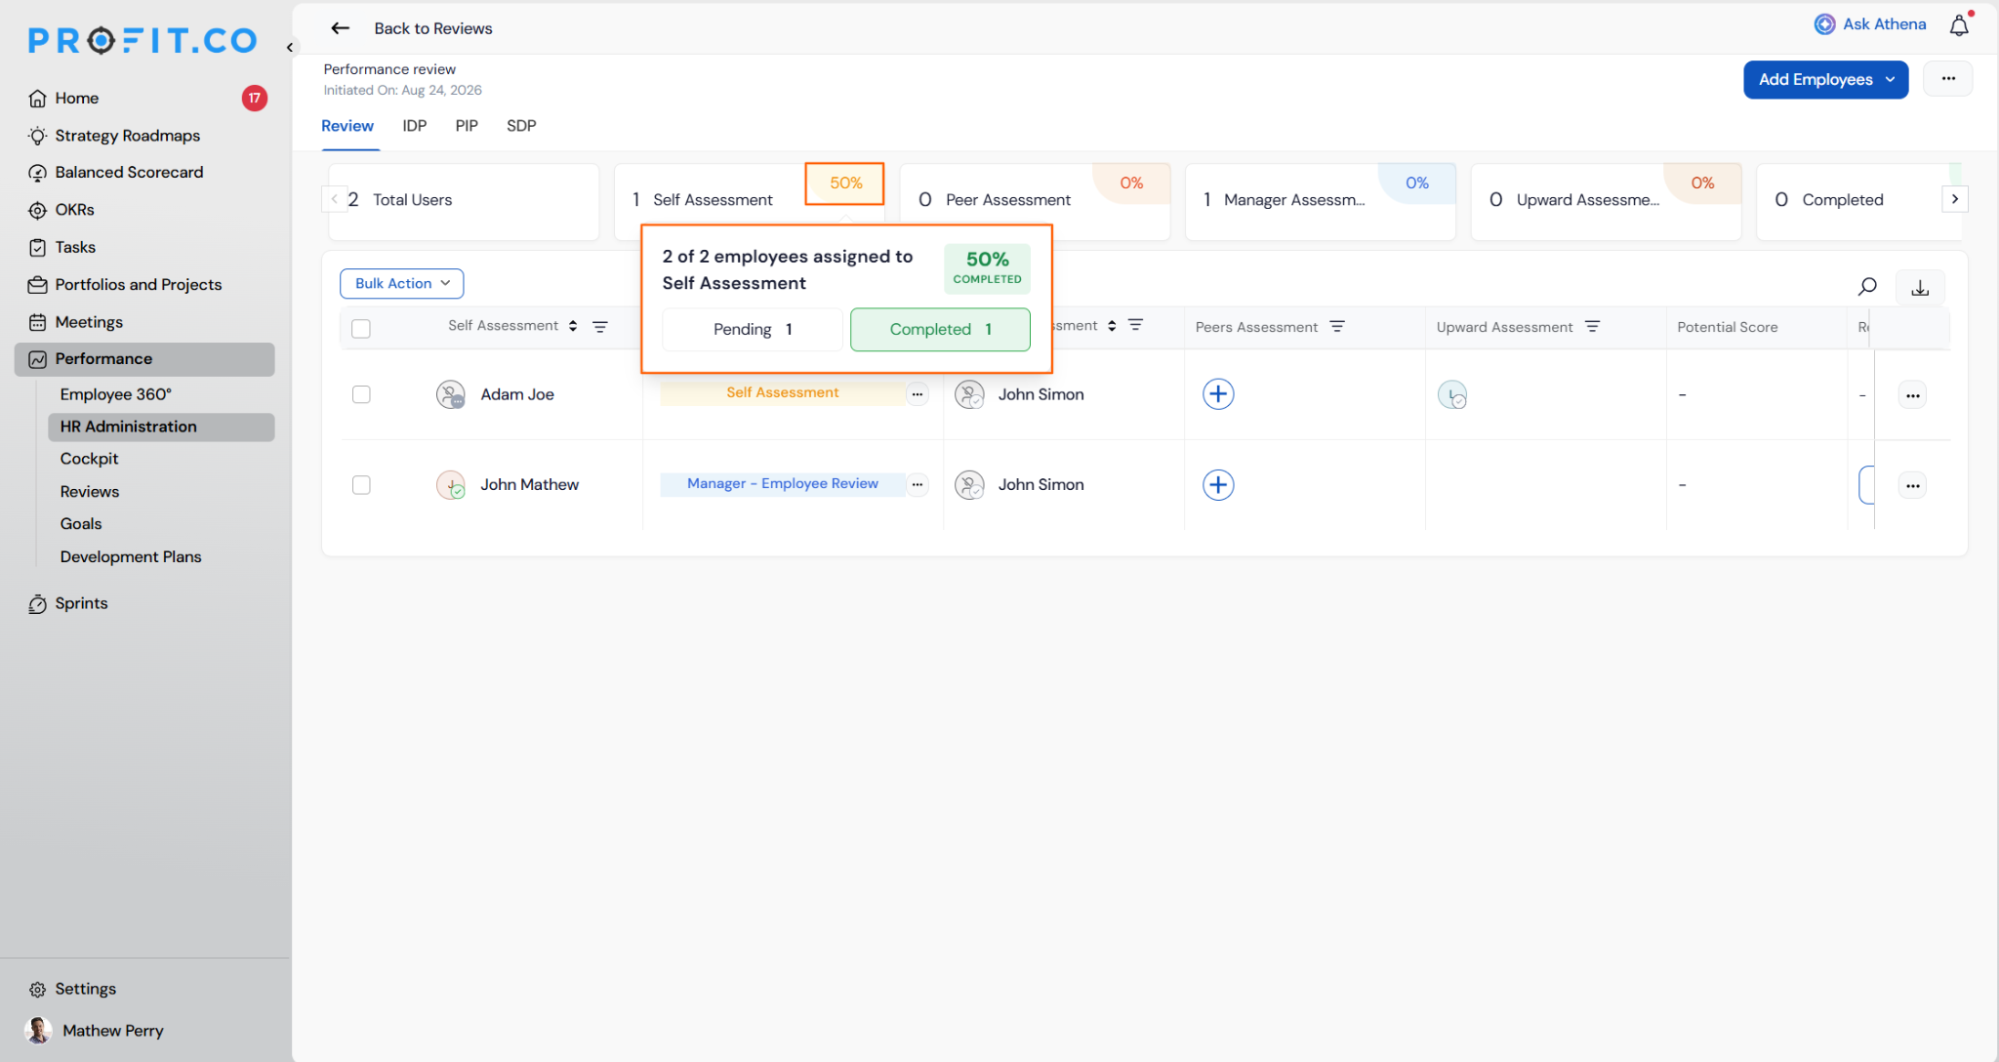
The review cycle summary bar now shows a clear, labelled breakdown for each assessment stage: how many employees have completed it, how many are still pending, and the overall completion percentage. Previously, the bar showed a condensed format like "Self (10/39) 26%" with no labels, leaving HR admins to figure out what each number meant and calculate the rest themselves. The update removes that guesswork and puts the information HR needs front and centre.
How It Works
- Navigate to Performance → HR Administration → Reviews → open the relevant review cycle
- The summary bar at the top of the Review tab now shows each stage with three clearly labelled numbers:
- A green count showing how many employees have completed that stage
- An amber count showing how many employees are still pending
- A completion percentage showing overall progress for that stage
- Hover over any stage in the bar to see a full breakdown, including how many employees have not yet reached that stage
- If any employees are stuck waiting because their assigned reviewer is no longer active, the pending count will show this as "N awaiting (M blocked)"
- All numbers update immediately after any action is taken on the cycle, without needing to refresh the page
Why It Matters
- No more number guessing: HR admins can see at a glance how many employees are done and how many are still pending for each stage, without doing any mental calculation.
- Percentages that actually mean progress: The completion percentage now reflects how far along each stage really is, so the numbers make sense when shared with leadership.
- Stuck reviews flagged upfront: If a stage has employees who cannot move forward because their reviewer was removed or deactivated, the summary bar highlights this immediately so HR can step in quickly.
5. CSV Export for Competency/Performance Cockpit Charts
Overview
The Competency/Performance chart in the Performance Cockpit now includes a CSV export option, giving managers and HR teams a direct way to extract review data for offline analysis and reporting. Previously, this data could only be viewed on screen, requiring manual workarounds to share or process it further. Users can now export all fields or define a custom selection, depending on what their report needs.
How It Works
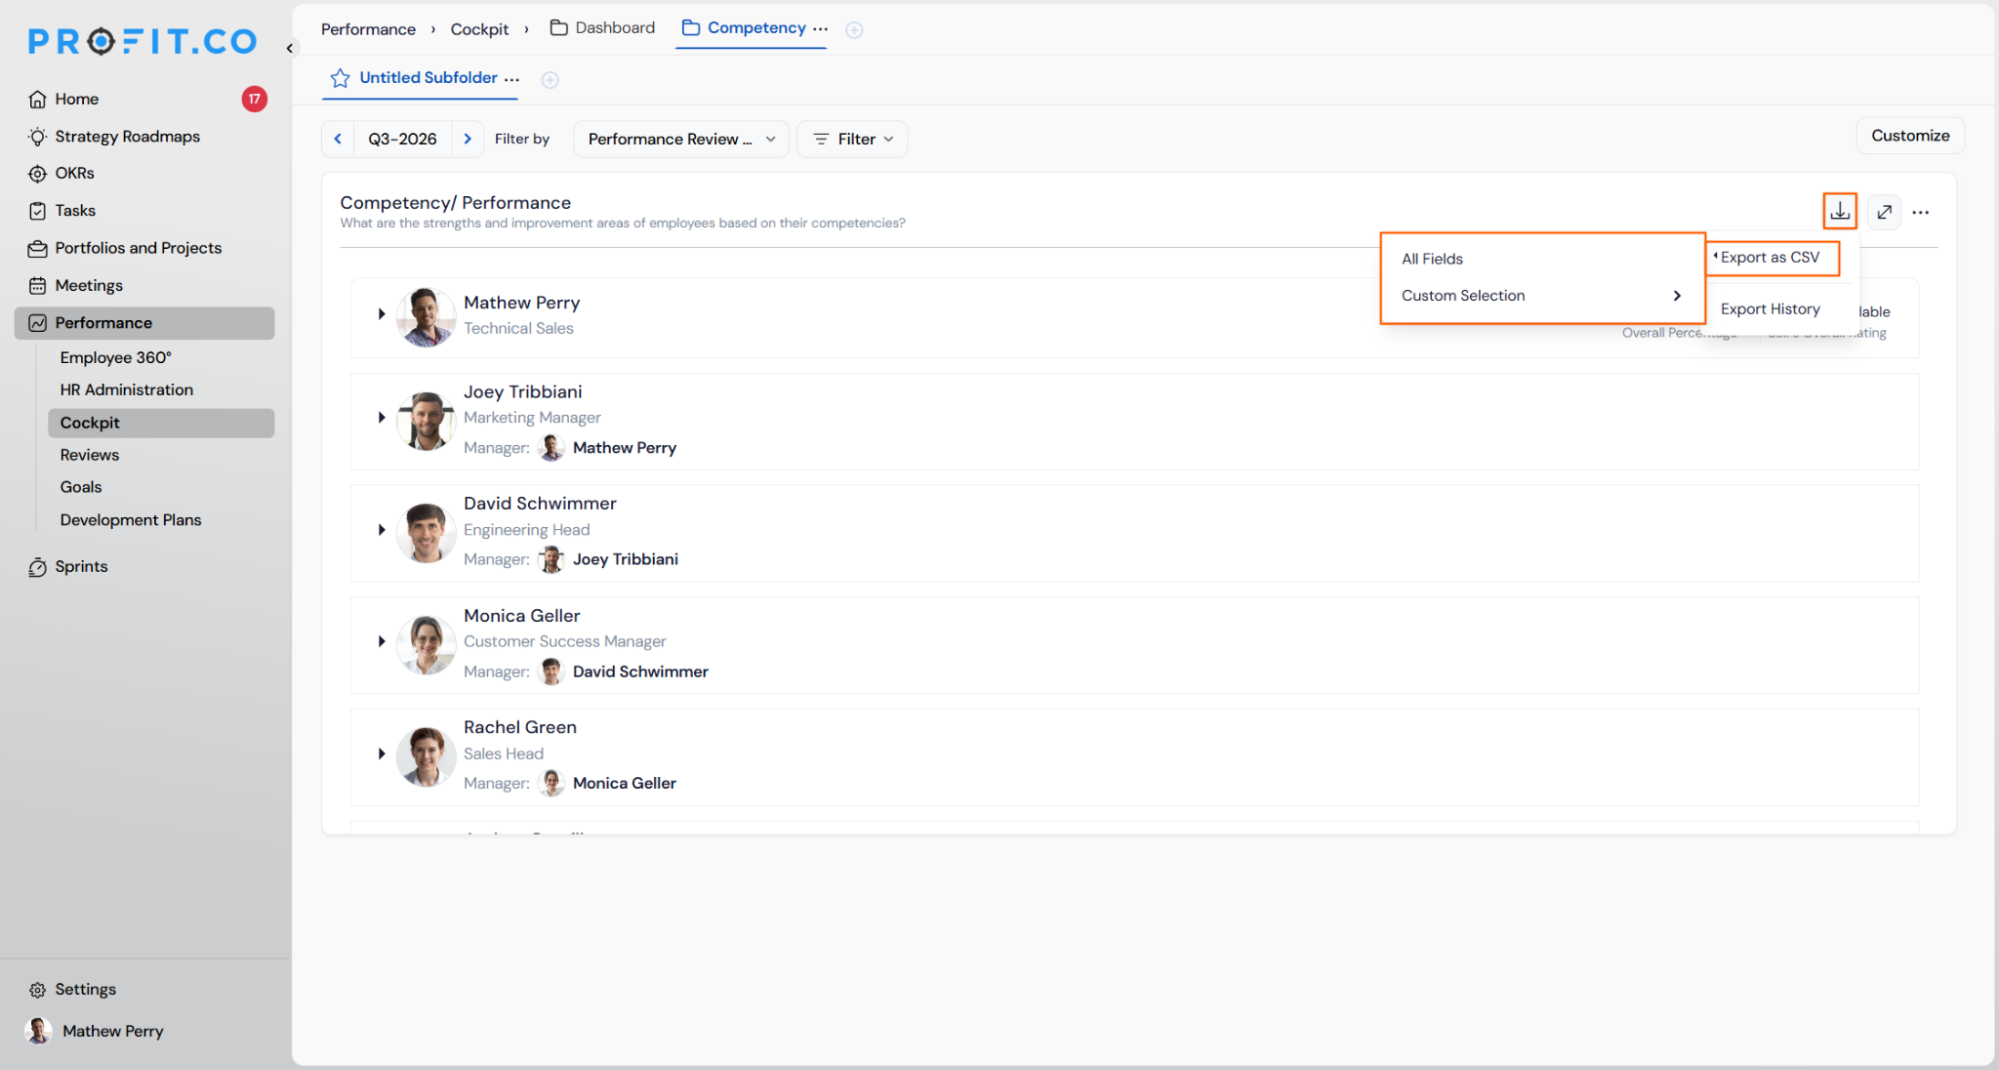
- Navigate to Performance → Cockpit tab
- Click the Export icon in the top- right corner of the Competency/Performance chart
- Select Export as CSV from the dropdown
- Choose All Fields to include all available data columns, or select Custom Selection to pick specific fields
- The CSV file downloads immediately to your device
- To retrieve a previously generated export, select Export History from the same dropdown
Why It Matters
- Ready- made reporting data: Managers can pull competency and performance data directly into spreadsheet tools without re- entering anything manually.
- Targeted field selection: Custom Selection keeps exports focused – teams only include the columns relevant to their review or audit, reducing noise in shared reports.
- Export audit trail: Export History lets users retrieve past downloads without re- running the export, useful during recurring quarterly review cycles.
6. Filter Support for Individual Development Plans
Overview
HR admins can now filter the Individual Development Plans list in HR Administration, making it easier to locate and manage IDPs across a large employee base. Previously, the IDP page displayed all plans without any filtering capability, requiring users to scroll through the full list to find what they needed. The new Filter option lets users narrow down plans by relevant criteria directly from the page.
How It Works
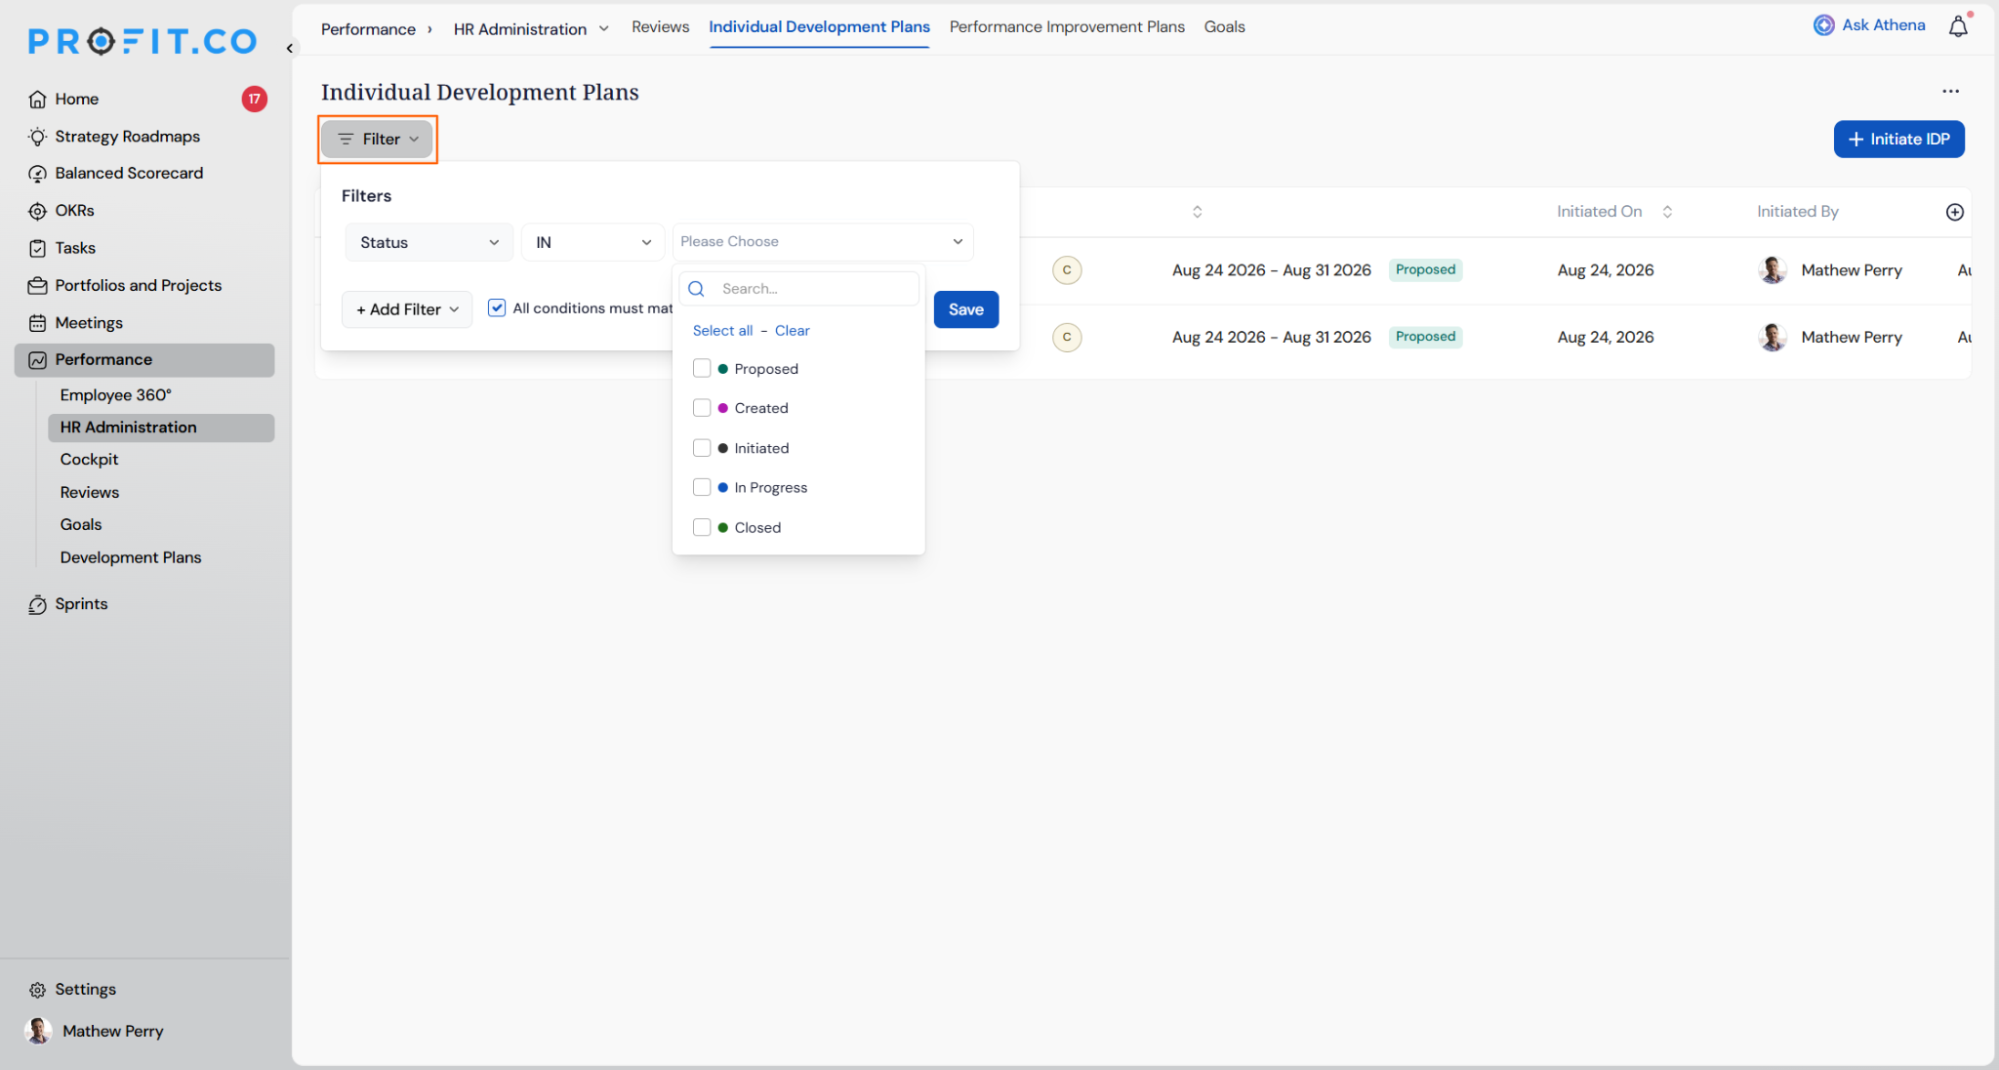
- Navigate to Performance → HR Administration → Individual Development Plans
- Click the Filter button in the top- left of the IDP list
- Select the desired filter criteria to narrow down the plans displayed
- The list updates to show only the IDPs matching the applied filter
Why It Matters
- Faster plan lookup: HR admins working across large teams can zero in on specific IDPs without scrolling through the full list, saving time during reviews and follow- ups.
- Focused HR workflows: Filtering by relevant criteria keeps HR admins focused on the subset of plans they need to act on, reducing distraction from unrelated entries.
- Scalable plan management: As the number of IDPs grows with the Organization, the filter ensures the page stays usable regardless of volume.
SECURITY
1. Scoped access key generation for API integration
Overview
Administrators can now generate multiple scoped access keys in Profit.co to allow external systems to read or write Profit.co data securely. Each access key carries its own permissions, department scope, and expiry – and is paired with the organisation's API key to authenticate API calls. Up to five access keys can be active at a time.
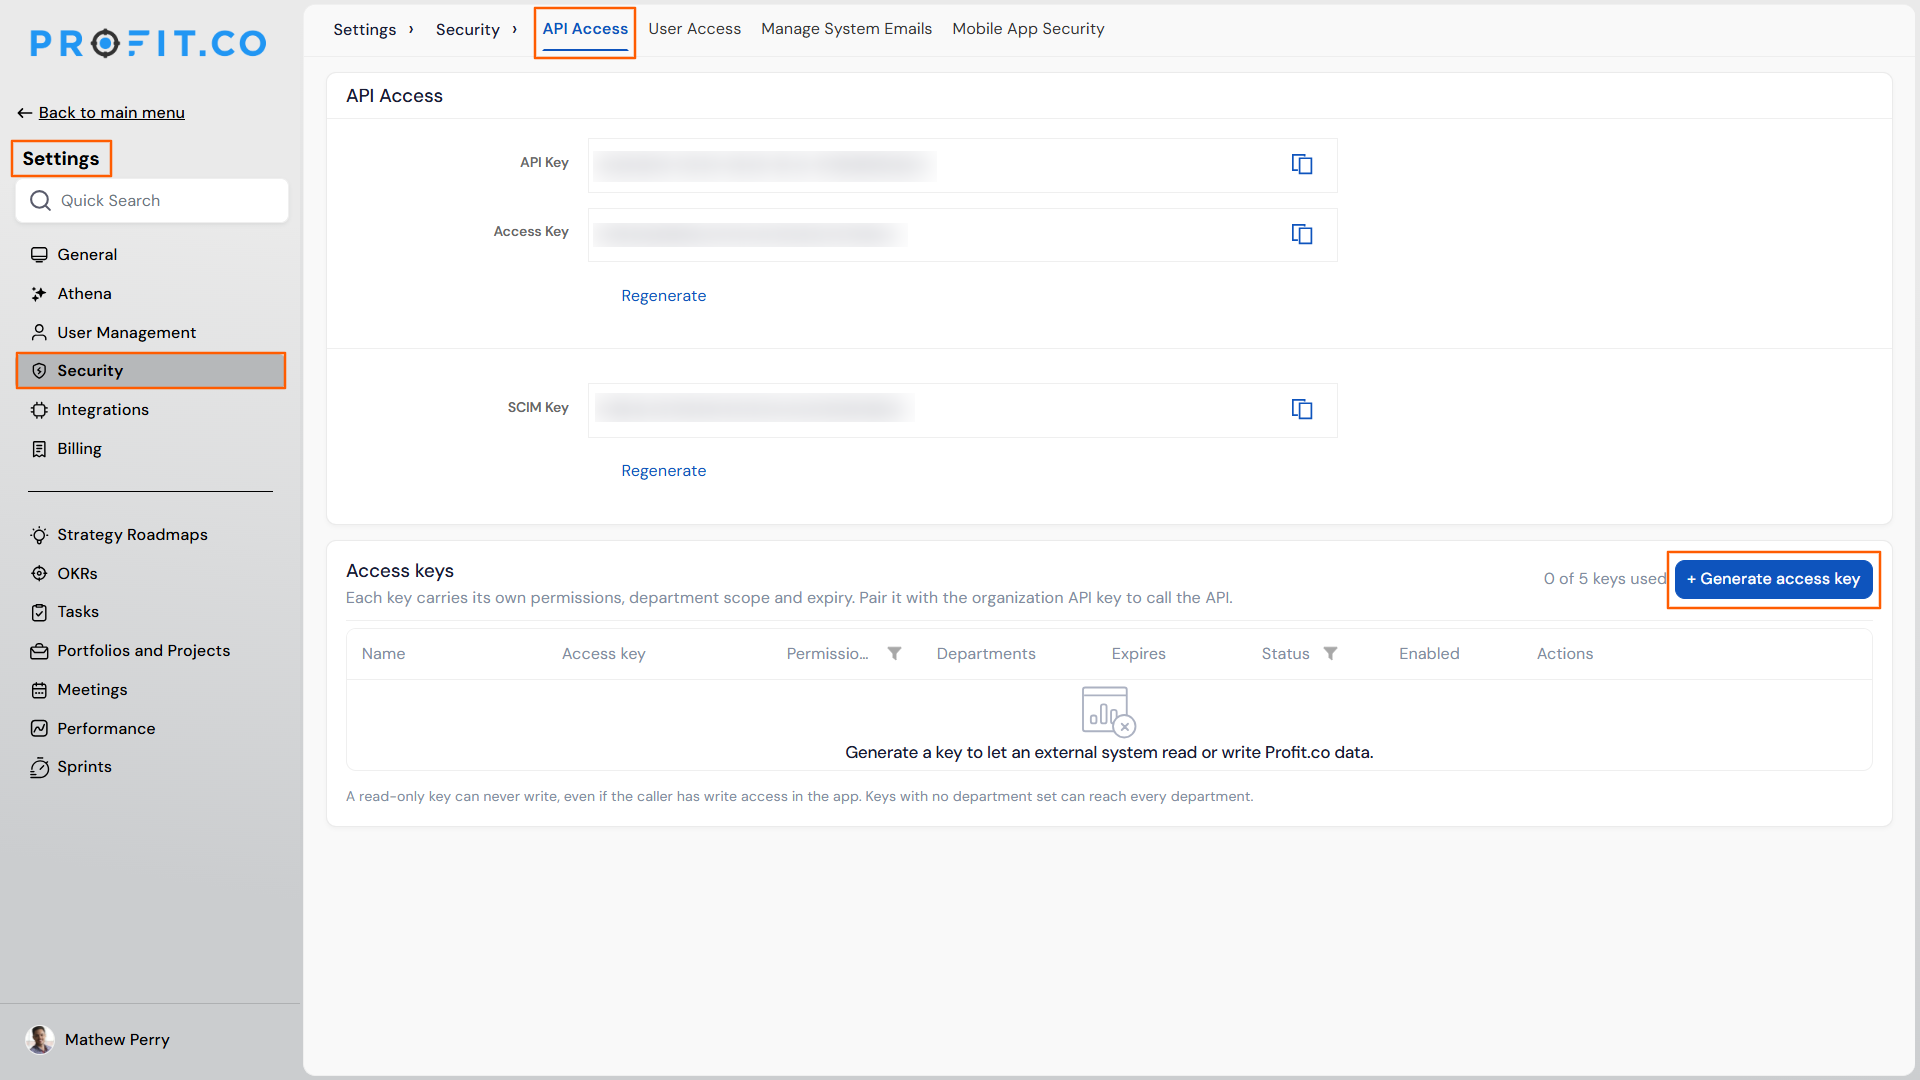
How It Works
- Navigate to Settings → Security → API Access.
- Under the Access Keys section, click + Generate Access Key.
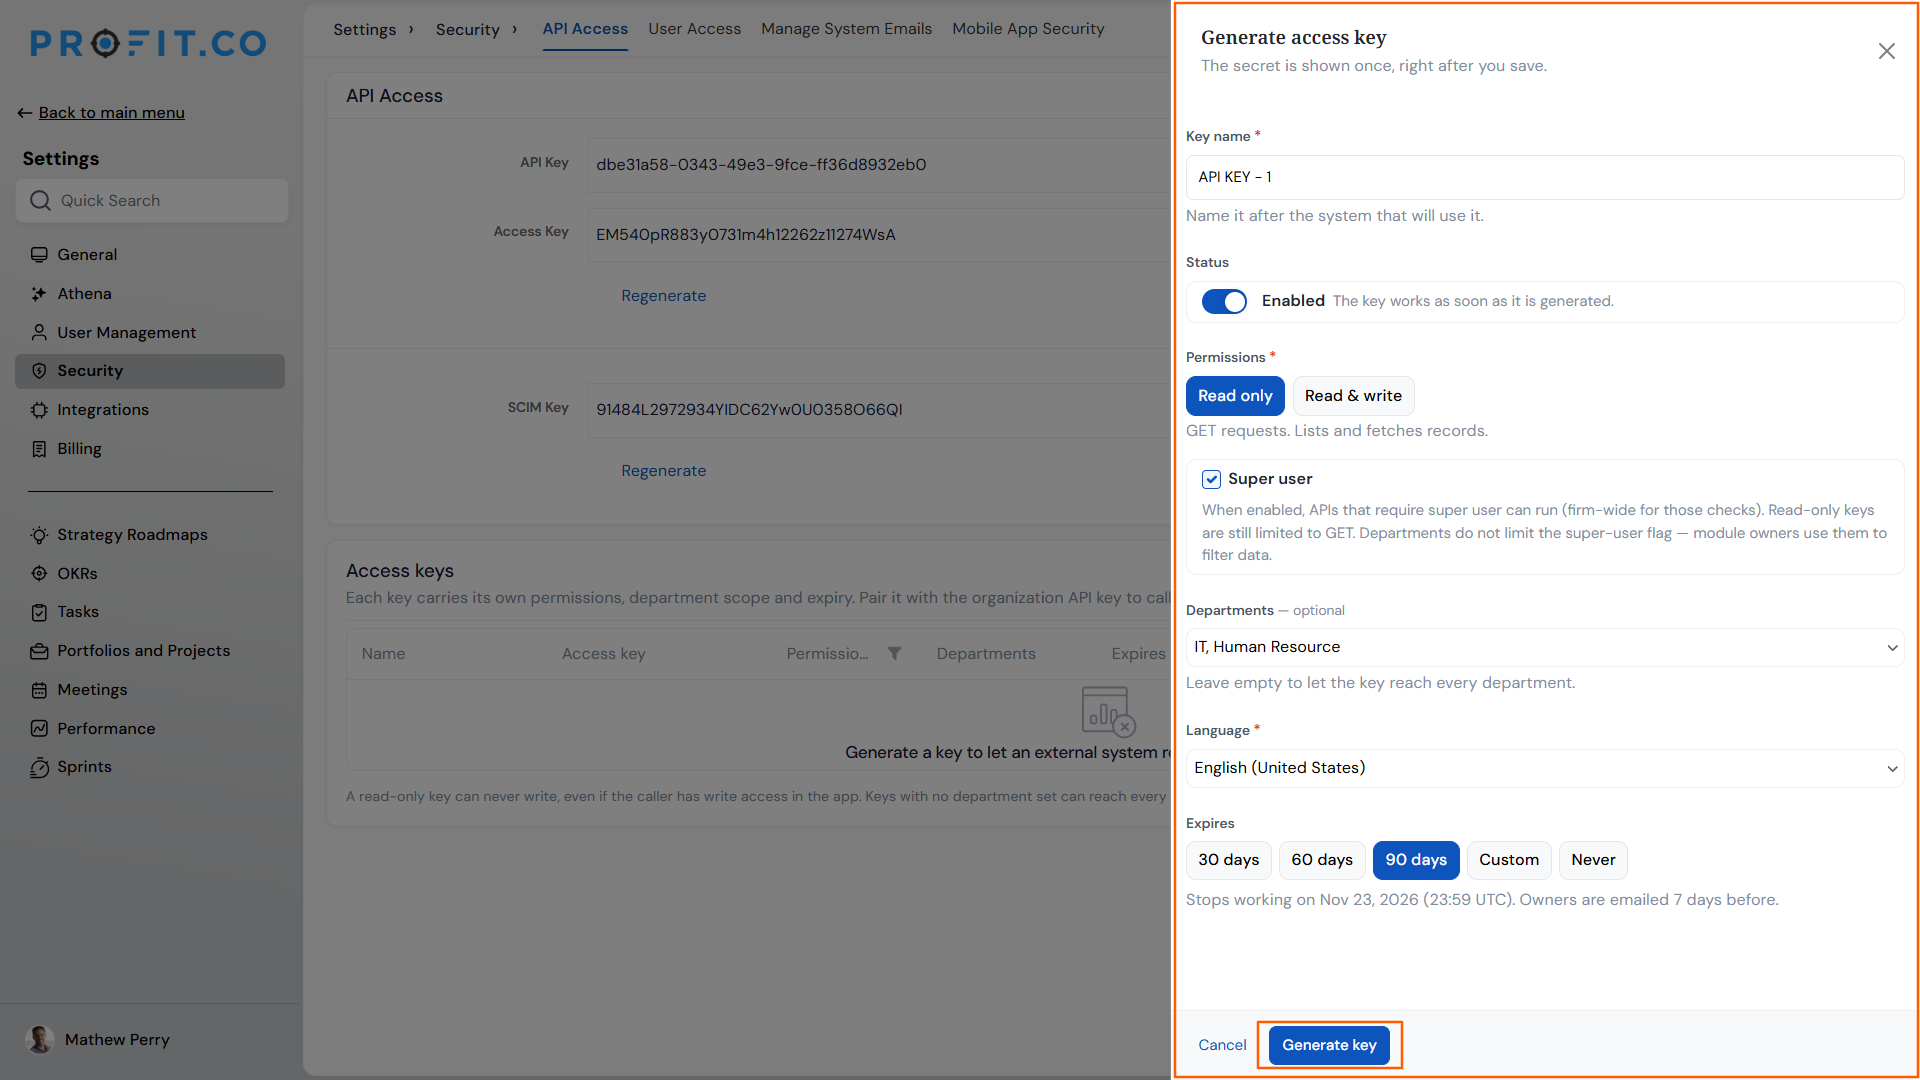
- Configure the key with the following options:
- Key name – name it after the system that will use it (e.g., Jira objectives sync).
- Status – enable or disable the key immediately after generation.
- Permissions – choose Read only or Read & Write.
- Super user – enable if the key needs to run APIs that require super user access firm- wide.
- Departments – optionally restrict the key to specific departments; leave empty to allow access across all departments.
- Language – set the language for the key.
- Expires – set an expiry date for the key.
- Click Generate Key – the secret is shown once immediately after generation.
- Pair the generated access key with the organisation's API key to authenticate external API calls.
Why It Matters
- Granular access control: Each key can be scoped to specific departments and permissions, ensuring external systems access only the data they need.
- Secure by design: Keys carry their own expiry and can be enabled or disabled independently, making it easy to rotate or revoke access without affecting other integrations.
- Multiple integrations supported: Up to five access keys can be maintained simultaneously, allowing different external systems to connect to Profit.co with their own dedicated keys.
