


9 Box Matrix
Plot talent across performance and potential
Give HR a dynamic view of every employee’s performance and potential in one grid. Spot your stars, your rising talent, and the people who need more support.
Industry
Company Size
Coaching & Consulting
Insight Hub
Support
Products
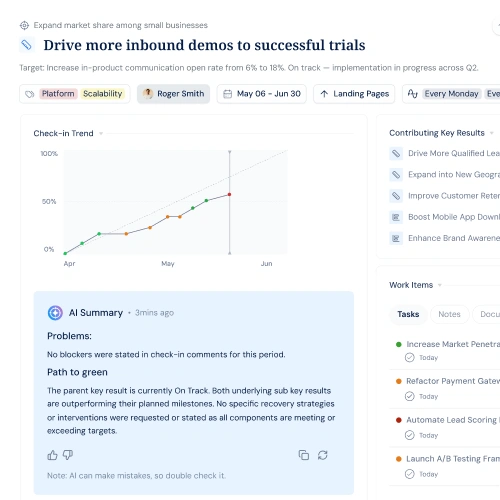
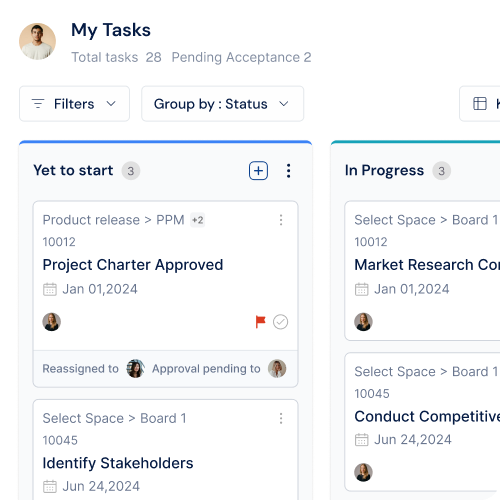
Performance Dashboard
Track ratings, trends, and compensation decisions for every employee in one clear view.

Rated 4.7/5 by 500+ Leaders

Trusted by 1,500+ Organizations worldwide

Without vs With Profit.co
Most teams make performance decisions without a clear picture. Here is what that looks like, and what changes with Profit.co.
Without Profit.co
With Profit.co
Core capabilities
Built for HR, managers, and employees to understand and act on performance data.
9 Box Matrix
Give HR a dynamic view of every employee’s performance and potential in one grid. Spot your stars, your rising talent, and the people who need more support.

Rating Grid
Rate every employee against specific criteria with defined scales. See all scores in one grid so every evaluation stays objective and every comparison is fair.

Bell Curve
See the distribution of employee performance across your organisation. Guide reward and promotion decisions using a consistent, data-driven view rather than manager memory or recency bias.

Incentive Workbench
Manage incentive compensation in one place. Link payouts to performance ratings, track budget allocation across your team, and give HR a data-driven basis for every reward decision.
Supporting tools that make the Performance Dashboard work harder for your team.
Filter any view by team, department, or role to focus instantly.
Export any dashboard view for HR records, leadership reviews, or calibration sessions.
Get notified before review deadlines so no cycle closes with incomplete data.
Employees, managers, and HR each see a view built for their needs.
Compare employee scores side by side to run fair, consistent calibration sessions.
See self, manager, and peer review completion rates in real time.
The Profit.co Platform
The Performance Dashboard connects with every other People tool in Profit.co so nothing about your team sits in isolation.
Reviews tied to OKR outcomes
Growth plans linked to team goals
Individual goals tied to OKRs
Consistent 1-on-1s with shared agendas
Fair, consistent ratings across teams
Flexible reviews tied to goals and OKRs
Performance-driven pay decisions, simplified
Standardize reviews with ready-made templates
Performance Execution Suite
Performance doesn’t stop at the annual review. Profit.co connects your reviews to OKR progress, task completion, and peer feedback in one platform — not three separate tools.
Strategy Execution
Your strategy links to each review so leaders see how every employee’s work supports company goals.
Task Management
Employee tasks during the review period are visible inside their 360 appraisal so managers see the full picture when they rate.

Meetings
Run every 1:1 and team meeting with OKR progress visible in the sidebar. Decisions stay connected to goals and action items sync automatically to your task board.
Book a demo and see the 9-box matrix, rating grid, bell curve, and trend reports live in Profit.co.
Integrations ecosystem
100+ native integrations that keep your data in sync - so teams check in, update progress, and stay aligned without switching apps.
Browse all 100+ integrations →Customer stories
“We accomplished nearly 90% of our high-level objectives that we set out at the beginning of the year. And these objectives are our direct lead indicators to the success of the business.”
Mark Hudoba
Executive VP, REHAU Building Solutions
“After implementing Profit.co, our employee participation in goal setting jumped from 60% to 80%, and review cycles became 40% faster. Leaders now have clear, real-time visibility into progress.”
Suganya R.
Senior HR, Toyota Connected India
“For us, the key factor was achieving full alignment between OKRs, projects, and tasks, supported by automation and KPI-driven governance. Profit.co provided a centralized portfolio management system — a single source of truth for all projects.”
David Serra
Head of Transformation & CMO, CELO Industry
Enterprise Grade Security
Keep your company’s data secure and compliant with industry-leading security standards and certifications.
SOC 2 TYPE II
ISO 27001
GDPR
HIPAA
FAQs
Everything you need to know before getting started.
The Performance Dashboard is the performance management cockpit in Profit.co. It brings together the 9 Box Matrix, Rating Grid, Bell Curve, Incentive Workbench, and Performance Trend Report so HR, managers, and employees always have a clear, current view of performance data.
Yes. Each person sees a view relevant to them. Employees track their own scores and trends. Managers see their team. HR administrators get the full organisational view including the 9-box matrix and bell curve distribution.
The 9 Box Matrix plots every employee across two dimensions — current performance and future potential. It gives HR a dynamic, visual way to identify top talent, rising contributors, and people who need development support, all in one grid.
The dashboard updates to reflect the current review cycle automatically. Previous cycle data stays accessible so you can compare trends across periods and track improvement over time without any manual work.
Yes. Profit.co offers a free trial with no credit card required. You can set up your performance dashboards, configure your rating criteria, and invite your team right away.
Most teams are live within a day. Once your review cycles and employee data are in Profit.co, the dashboards populate automatically. No manual configuration is required to start seeing your team’s performance picture.
Yes. Profit.co supports role-based access so review and rating data is only visible to the people who should see it. Individual scores are never shared without the right permissions in place.
Yes. Profit.co connects with Jira, Slack, Microsoft Teams, Azure DevOps, Salesforce, and many more. Performance data stays current across the tools your teams already work in every day.
Ready to transform execution?
When performance data is clear and consistent, every decision about people gets easier and fairer.

Welcome to Profit.co 👋
How can I help you today?