


Performance Indices
Three numbers that tell the whole story
CPI, SPI, and TCPI calculate automatically from your project data. The 2×2 matrix maps every project to its exact health quadrant at a glance.
Industry
Company Size
Coaching & Consulting
Insight Hub
Support
Products
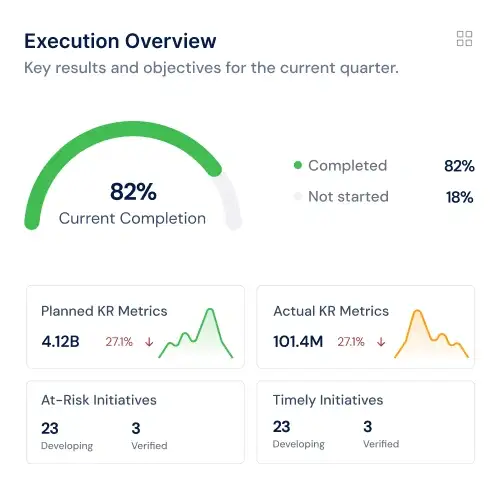
EVM Dashboard
See cost, schedule, and scope performance in one view so you never discover problems after it is too late to act.

Rated 4.7/5 by 500+ Leaders

Trusted by 1,500+ Organizations worldwide

Without vs With Profit.co
Most teams find out a project is over budget at the end. Here is what that looks like, and what it looks like with Profit.co.
Without Profit.co
With Profit.co
Core capabilities
Real numbers, calculated automatically, at project and portfolio level.
Performance Indices
CPI, SPI, and TCPI calculate automatically from your project data. The 2×2 matrix maps every project to its exact health quadrant at a glance.

Trend Analysis
Plot Planned Value, Actual Cost, and Earned Value month by month. Track whether project efficiency improves or declines before it becomes a board-level problem.
Portfolio View
See combined cost and schedule health across your full portfolio. Spot which projects need attention before a review meeting, not during one.

Track every health signal across your project portfolio from a single, connected workspace.
Lock the approved budget as your Performance Measurement Baseline for accurate variance.
Download EVM reports to share project health with stakeholders outside Profit.co.
Every EVM metric recalculates automatically the moment project data changes.
Track Variance at Completion to see the gap between budget and final forecast.
Monitor Actual Cost against planned spend at every review cycle.
Forecast the Estimate at Completion based on current project performance.
Generate reports that follow PMI earned value management standards.
Control who can see, edit, or export each project’s EVM data.
The Profit.co Platform
Profit.co features connect so your goals, dashboards, alignment, and reporting all run as one system.
Projects tied to strategic goals
Track project budgets and spend
Stage-gate reviews and approvals
Model delivery options before committing
Live health across all projects
Measure benefits delivered by projects
Compare costs against expected benefits
Organize work across multiple streams
Personal task and deadline view
Build and manage sprint cycles
Capture and prioritise project requests
Analyze task completion patterns
Run iterative cycles with velocity tracking
Central hub for teams and projects
Discuss and collaborate in context
Link tasks and sequence work
Plan, schedule, and ship releases
Configure custom fields and layouts
Project Execution Suite
Profit.co brings project portfolios, sprint execution, financial tracking, and OKR alignment together so every team delivers work that moves the business forward.
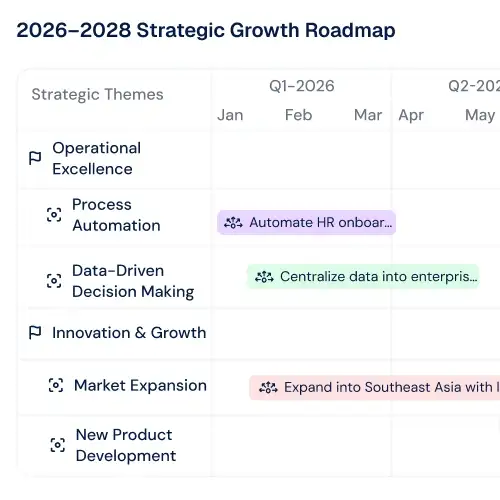
Strategy Roadmaps
Visualize strategic themes alongside the portfolio investments backing them. Leadership always sees which initiatives tie to which priorities.
Strategy Execution
Link every project to corporate objectives and track delivery against them. Full traceability from capital committed to outcome achieved.
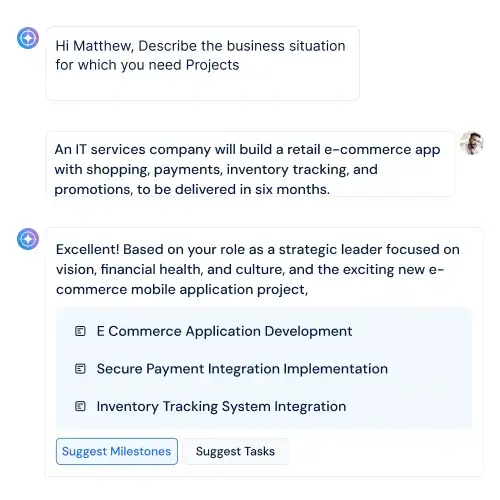
AI Agents
AI Agents accelerate project creation and structuring so your team spends less time on setup and more on governance.
Walk away with a live view of your project health and a clear picture of what to fix first.
Integrations ecosystem
100+ native integrations that keep your data in sync - so teams check in, update progress, and stay aligned without switching apps.
Browse all 100+ integrations →Customer stories
“We accomplished nearly 90% of our high-level objectives that we set out at the beginning of the year. And these objectives are our direct lead indicators to the success of the business.”
Mark Hudoba
Executive VP · REHAU Building Solutions
“Just in the last year, we saved over $300,000. That made it easy to pitch to the owners to implement OKRs throughout the company.”
Deena Giordano Ullom
VP of People Operations · United Technical Support Services
“After implementing Profit.co, our employee participation in goal setting jumped from 60% to 80%, and review cycles became 40% faster. Leaders now have clear, real-time visibility into progress.”
Suganya R.
Senior HR · Toyota Connected India
“One of the significant benefits we found was reduced time spent on reviews - 75% reduction of time spent in reviews and 84% reduction in time spent in PPTs for Executives.”
Gerardo Haro
CI Manager · Intuitive Surgical
Enterprise Grade Security
Keep your company’s data secure and compliant with industry-leading security standards and certifications.
SOC 2 TYPE II
ISO 27001
GDPR
HIPAA
FAQs
Everything you need to know before getting started.
EVM Dashboard is Profit.co’s earned value management view for project and portfolio managers. It combines cost, schedule, and scope performance into a single live view showing CPI, SPI, TCPI, and the 2×2 performance matrix. No spreadsheets required.
Yes. EVM Dashboard works at both project and portfolio level. A single project manager gets full CPI, SPI, and TCPI visibility for their project. A PMO leader or executive sees the same data rolled up across every project in the portfolio at once.
Yes. All EVM metrics, including CPI, SPI, TCPI, CV, SV, EAC, VAC, and AC, calculate automatically at every review cycle. No manual data entry. No spreadsheet formulas. The 2×2 matrix and trend charts update without any action from your team.
Lock the approved budget using the Performance Measurement Baseline. When scope changes, update the baseline and Profit.co keeps a full audit trail. All EVM metrics recalculate from the new baseline automatically so your data stays accurate.
Yes. Start a free trial from this page with no credit card required. You get full access to EVM Dashboard and all other Profit.co features. Book a demo if you prefer a guided walk-through with your own project data.
Most teams see live EVM data within one day. Connect your project data, set your budget baselines, and the dashboard populates automatically. Integrations with Jira and Azure DevOps mean you do not need to start from scratch.
Yes. Role-based access controls let you decide exactly who sees which project data. Project managers see their own full EVM view. Executives see the portfolio rollup. You control what each role can access, edit, or export.
Profit.co connects with Jira, Slack, Microsoft Teams, Azure DevOps, and Salesforce out of the box. Your project data syncs automatically so EVM metrics always reflect the latest state. No manual exports or duplicate data entry required.
Ready to transform execution?
When cost, schedule, and scope sit in one live view, every project decision gets faster and more accurate.

Welcome to Profit.co 👋
How can I help you today?