


Visual Tracking
Spot performance patterns across every period
Color-coded cells show each Key Result’s progress across months or quarters at a glance. A declining KR across three periods is impossible to miss in the Bowler Chart.
Industry
Company Size
Coaching & Consulting
Insight Hub
Support
Products
Bowler Chart
Track how every Key Result performs month by month with color-coded cells that make patterns impossible to miss.

Rated 4.7/5 by 500+ Leaders

Trusted by 1,500+ Organizations worldwide

Without vs With Profit.co
Most teams only see where they stand today. Here is what that looks like, and what it looks like with Profit.co.
Without Profit.co
With Profit.co
Core capabilities
Everything your teams need to track, understand, and act on OKR performance across time in one place.
Visual Tracking
Color-coded cells show each Key Result’s progress across months or quarters at a glance. A declining KR across three periods is impossible to miss in the Bowler Chart.

Transparent Scoring
The overall performance score sits at the top of the chart. Expand it to see the exact formula and each OKR’s individual contribution with no hidden logic.
Full Management Control
Add new Key Results, adjust targets, or remove outdated ones without leaving the chart. Every change syncs automatically to List View and Gantt View.

Every control you need to keep your Bowler Chart accurate and your reviews sharp sits inside Profit.co from day one.
Move between List View and Bowler Chart to get both detailed data and trend insights.
View the full formula and each OKR’s contribution before any review or check-in.
Scores recalculate instantly as check-ins are logged with no manual refresh needed.
Switch between monthly and quarterly period groupings to match your review cadence.
Adjust targets or update progress for any Key Result without leaving the chart view.
Delete irrelevant Key Results to keep the chart focused on what is still active.
Green, yellow, and red cells surface performance health across every period instantly.
All chart updates sync to List View and Gantt View so data stays consistent everywhere.
The Profit.co Platform
Profit.co Plan features connect so your chart, dashboards, alignment, and reporting all run as one system.
Track who checks in on time
Present live OKR data in board meetings
Weekly OKR digest sent automatically
Goals grouped by current status
Strategy across four perspectives
Measure commitments versus delivery
Share OKR progress in review meetings
Live view of all goal progress
Run OKRs, Hoshin, MBO, and more
Vision to execution on one page
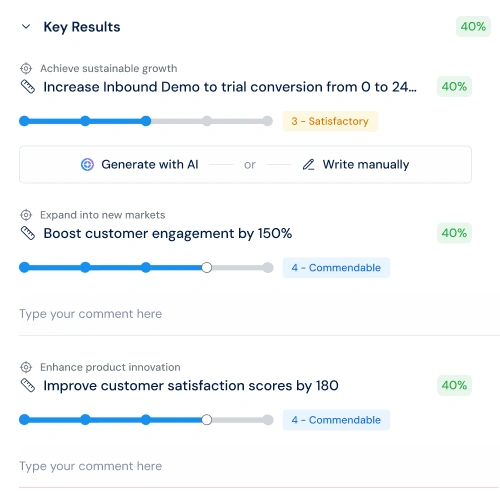
Write Key Results in seconds
Track threats to your OKRs
Link projects to Key Results
See how goals roll up and connect
Map links and dependencies across goals
Score and sharpen OKR quality
Strategy Execution Suite
Profit.co brings OKRs, strategy roadmaps, performance, and projects together so your strategy runs from vision to results with no gaps in between.
Performance Management
Run performance reviews tied directly to OKR outcomes so every conversation is grounded in real progress, not opinions.
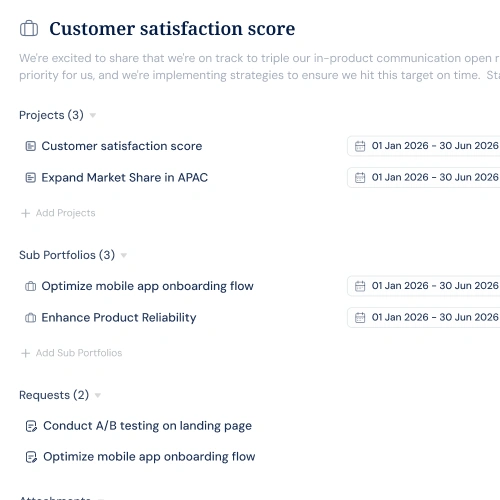
Project Portfolio Management
Link active projects to the OKRs they support so leaders always see a clear line from investment to outcome, with no gaps between strategy and delivery.

Meetings
Run every 1:1 and team meeting with OKR progress visible in the sidebar. Decisions stay connected to goals and action items sync automatically to your task board.
Book a demo with an OKR expert and walk away knowing exactly how your KR trends look across every period.
Integrations ecosystem
100+ native integrations that keep your data in sync - so teams check in, update progress, and stay aligned without switching apps.
Browse all 100+ integrations →Customer stories
“We accomplished nearly 90% of our high-level objectives that we set out at the beginning of the year. And these objectives are our direct lead indicators to the success of the business.”
Mark Hudoba
Executive VP · REHAU Building Solutions
“Just in the last year, we saved over $300,000. That made it easy to pitch to the owners to implement OKRs throughout the company.”
Deena Giordano Ullom
VP of People Operations · United Technical Support Services
“After implementing Profit.co, our employee participation in goal setting jumped from 60% to 80%, and review cycles became 40% faster. Leaders now have clear, real-time visibility into progress.”
Suganya R.
Senior HR · Toyota Connected India
“One of the significant benefits we found was reduced time spent on reviews - 75% reduction of time spent in reviews and 84% reduction in time spent in PPTs for Executives.”
Gerardo Haro
CI Manager · Intuitive Surgical
Enterprise Grade Security
Keep your company’s data secure and compliant with industry-leading security standards and certifications.
SOC 2 TYPE II
ISO 27001
GDPR
HIPAA
FAQs
Everything you need to know before getting started.
The Bowler Chart gives you a visual summary of OKR progress across months or quarters. Each Key Result appears as a row, and each period gets a color-coded cell showing performance at a glance. An overall score sits at the top with a full breakdown available on demand.
Yes. Any user can view their own Key Results in the Bowler Chart. You see your personal trend data across periods, create new Key Results, and update progress without leaving the chart view.
Yes. Every time a check-in is logged, the relevant cell updates and the overall performance score recalculates. No manual refresh is needed. The chart always shows current data.
You can add, edit, or remove Key Results directly from the Bowler Chart at any time. Changes sync immediately to List View and Gantt View so all your views stay consistent.
Yes. Profit.co offers a free trial with no credit card required. Sign up and start tracking your KR trends in the Bowler Chart right away.
The Bowler Chart is ready as soon as your Key Results exist in Profit.co. No additional setup is required. Your first trend view appears the moment check-ins start coming in.
Yes. Profit.co supports private Key Results so personal goals stay visible only to the owner. The Bowler Chart respects the same access controls set across your workspace.
Yes. Profit.co connects with Jira, Slack, Microsoft Teams, Azure DevOps, Salesforce, and many more. Progress from connected tools flows into your Key Results and keeps the Bowler Chart current.
Ready to transform execution?
When every KR’s trajectory is visible across every period, your team acts early instead of catching up late.

Welcome to Profit.co 👋
How can I help you today?