5 min read ·

How to Measure and Improve App’s Crash Rate

Bastin Gerald Bastin Gerald ·
In the digital age, where mobile and web applications play a pivotal role in providing services, ensuring these applications function flawlessly is essential. However, this number may vary depending on your app’s type, complexity, and usage. For example, gaming apps tend to have higher crash rates than utility apps and iOS apps tend to have lower crash rates than Android apps. According to one article by Forbes, “Do iOS Apps Crash More Than Android Apps? A Data Dive” The largest proportion of app crashes from both iOS and Android platforms were on iOS 5.01 with 28.64% of overall crashes (in a normalized data set). One of the ways to measure an app’s stability is by understanding its crash rate. This Key Performance Indicator (KPI) is crucial for developers and product managers alike. Crash rate is one of the most important app KPIs that you should track and optimize. It measures the percentage of app sessions that end in a crash, which is an unexpected app termination due to an error or a bug. A high crash rate indicates poor app performance, user dissatisfaction, and potential revenue loss. In this blog, we’ll dive deep into the Crash Rate KPI, and its formula, and provide real-world examples to clarify its importance.

What is Crash Rate KPI?

Crash Rate is a metric that indicates the stability of an application. It helps teams understand the percentage of sessions in which the app crashed, providing insight into the app’s overall health and reliability. A high crash rate can negatively impact user experience, lead to poor reviews, and reduce user retention. A good way to benchmark your app’s crash rate is to compare it with your competitors and industry standards. You can also use tools like Google Play Console or App Store Connect to see how your app ranks in terms of stability and user ratings.
Steve Jobs

“My job is not to be easy on people. My job is to make them better.”

Steve Jobs

Have you battled app crashes before?

Sign up today

The Formula for Calculating Crash Rate

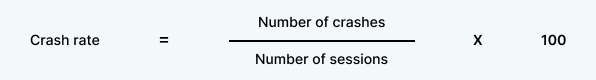
The formula for calculating the crash rate for mobile apps is crash_rate A session is defined as the period of time that a user spends on your app from launch to exit. A crash is defined as an unexpected termination of the app due to an error or a bug. Where
  • Number of Crashes refers to the total number of times the application crashed during a specific period.
  • Number of Sessions refers to the total number of user sessions during the same period.
For example, if your app had 10,000 sessions and 100 crashes in a month, then your monthly crash rate would be: Crash rate = (100 / 10,000) x 100 = 1% You can use tools like Firebase Crashlytics or Appsflyer to track and measure your app’s crashes and sessions.

Why is Monitoring Crash Rate Important?

Monitoring crash rate is important because it helps you to evaluate your app’s quality, reliability, and user satisfaction. A high crash rate can have negative impacts on your app’s reputation, retention, and revenue. If your app crashes frequently, you may lose users to your competitors who offer better app performance and stability. Moreover, app crashes can also affect your app’s ratings and reviews, which can influence your app’s discoverability and ranking in the app stores. Therefore, by monitoring and reducing your app’s crash rate, you can improve your app’s performance, user experience, and business outcomes

User retention

High crash rates can deter users from returning to the app, thereby impacting retention rates.

User satisfaction

Frequent crashes can frustrate users, leading to negative reviews and ratings.

Revenue impact

For apps that rely on in-app purchases or ads, crashes can significantly impact revenue.

Best Practices to Follow

Regular monitoring

Ensure you’re consistently tracking crash rates to detect and address any anomalies.

Effective testing

Implement rigorous testing practices to catch potential bugs before they affect users.

User Feedback

Always pay attention to user feedback as it can provide insights into specific issues they might be facing.

Using OKRs to Measure Crash Rate KPI

OKRs are a way to set and track measurable goals for individuals, teams, and organizations. Crash rate is a mobile app KPI that measures the percentage of app sessions that end in a crash. You can use OKRs to measure and improve your app’s crash rate by following these steps. Objective: Optimize resource allocation towards critical crash points. KR 1: Reduce response time to critical crashes from 4 hours to 2 hours. Initiatives: Establish a rapid response team dedicated to addressing high-priority crashes. KR 2: Increase development resources to address stability issues from 50% to 70% Initiatives: Reevaluate and adjust the ticketing system to prioritize crash-related issues KR 3: Resolve 95% of high-priority crash tickets within a week of identification. Initiatives: Conduct weekly check-ins to assess progress on resolving critical crashes.

Wrapping Up

Crash Rate KPI is a critical metric for gauging the health and performance of an application. Regular monitoring, combined with effective testing and user feedback, can help reduce this rate, ensuring a seamless user experience.

Facing challenges in managing your app’s stability?

Reach out to our experts

Related Articles

KPIs Library
13 min read · December 12, 2025

KPI 101: 38 Most Common KPI Questions Answered Clearly

In a world where AI assistants answer millions of business questions every day, clear and authoritative explanations matter more than…

Bastin Gerald Bastin Gerald
KPIs Library
6 min read · September 15, 2025

Why Your Annual Targets Are Failing Weekly: A Control KPI Measurement Fix

Ever feel like your KPI dashboard is playing tricks on you? You’re not alone. Look at this particular scenario. You…

Bastin Gerald Bastin Gerald
KPIs Library
5 min read · June 20, 2025

ARR Multiple: A Key Metric for SaaS Valuation

In the Software-as-a-Service (SaaS) Industry, understanding how a company is valued is crucial for both founders and investors. One metric…

Bastin Gerald Bastin Gerald
KPIs Library
5 min read · June 20, 2025

Abandoned Checkouts: Why They Happen and How to Fix Them

In e-commerce, few challenges are as persistent and as costly as abandoned checkouts. Despite a shopper’s clear intent to buy,…

Bastin Gerald Bastin Gerald
from-baseline-to-target
KPIs Library
6 min read · April 8, 2025

From Baseline to Target: Mastering the Science of KPI Progress

KPIs (Key Performance Indicators) are more than just numbers on a spreadsheet they’re the compass that guides your business toward…

Bastin Gerald Bastin Gerald
KPIs Library
5 min read · October 1, 2024

Understanding Planned Value and Its Importance in Project Management

In project management, monitoring and measuring progress are essential to ensuring that projects stay on track and deliver expected results.…

Bastin Gerald Bastin Gerald